Thahbib Rahman
Research Analyst
Despite the “debasement trade” dominating headlines this week as BTC and gold rallied concurrently with each other, beneath the surface, derivatives markets indicate the rally is a fragile one. Open interest in perpetual swap contracts has declined over the past few days, suggesting signs of profit-taking, and funding rates have remained between neutral and modestly positive levels — hardly a hallmark of an ATH rally. This is further supported by suppressed activity in BTC, ETH and SOL options markets, where volumes have remained low and skewed mostly toward puts, and volatility smiles have been skewed toward puts.

Despite the “debasement trade” dominating headlines this week as BTC and gold rallied concurrently with each other, beneath the surface, derivatives markets indicate the rally is a fragile one. Open interest in perpetual swap contracts has declined over the past few days, suggesting signs of profit-taking, and funding rates have remained between neutral and modestly positive levels — hardly a hallmark of an ATH rally. This is further supported by suppressed activity in BTC, ETH and SOL options markets, where volumes have remained low and skewed mostly toward puts, and volatility smiles have been skewed toward puts.
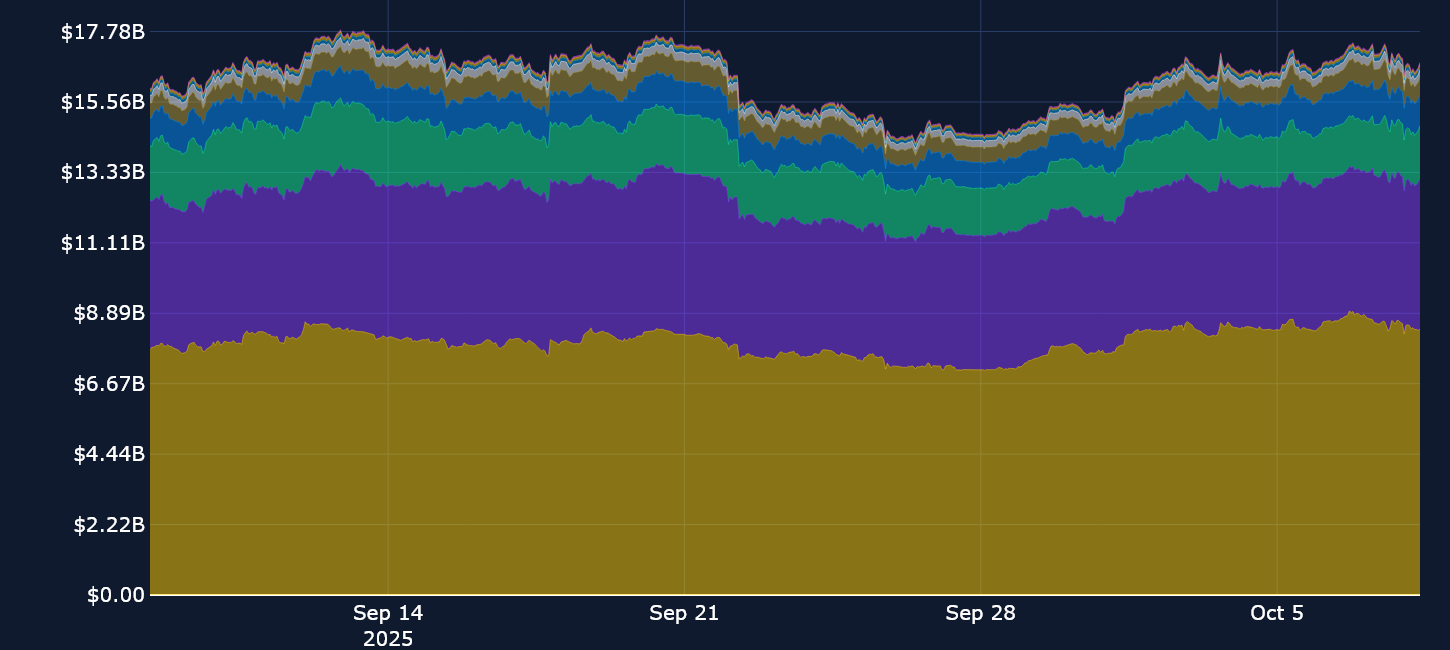
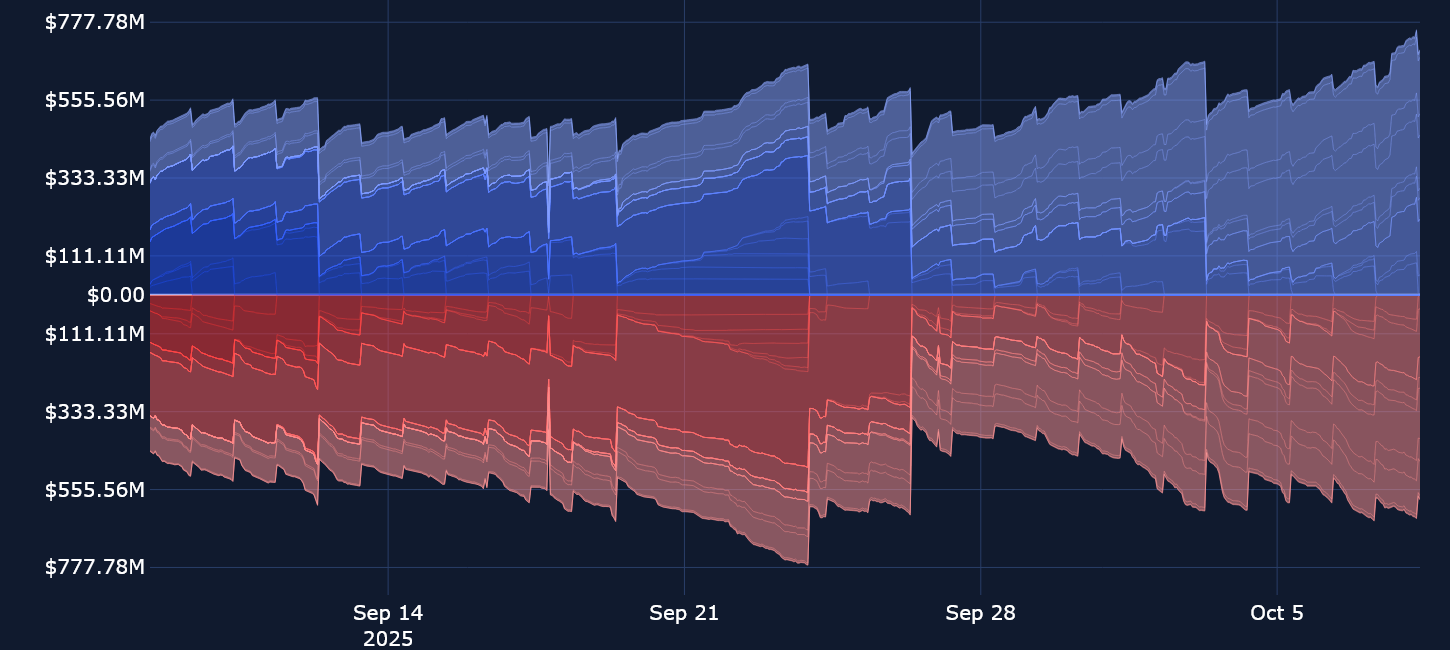
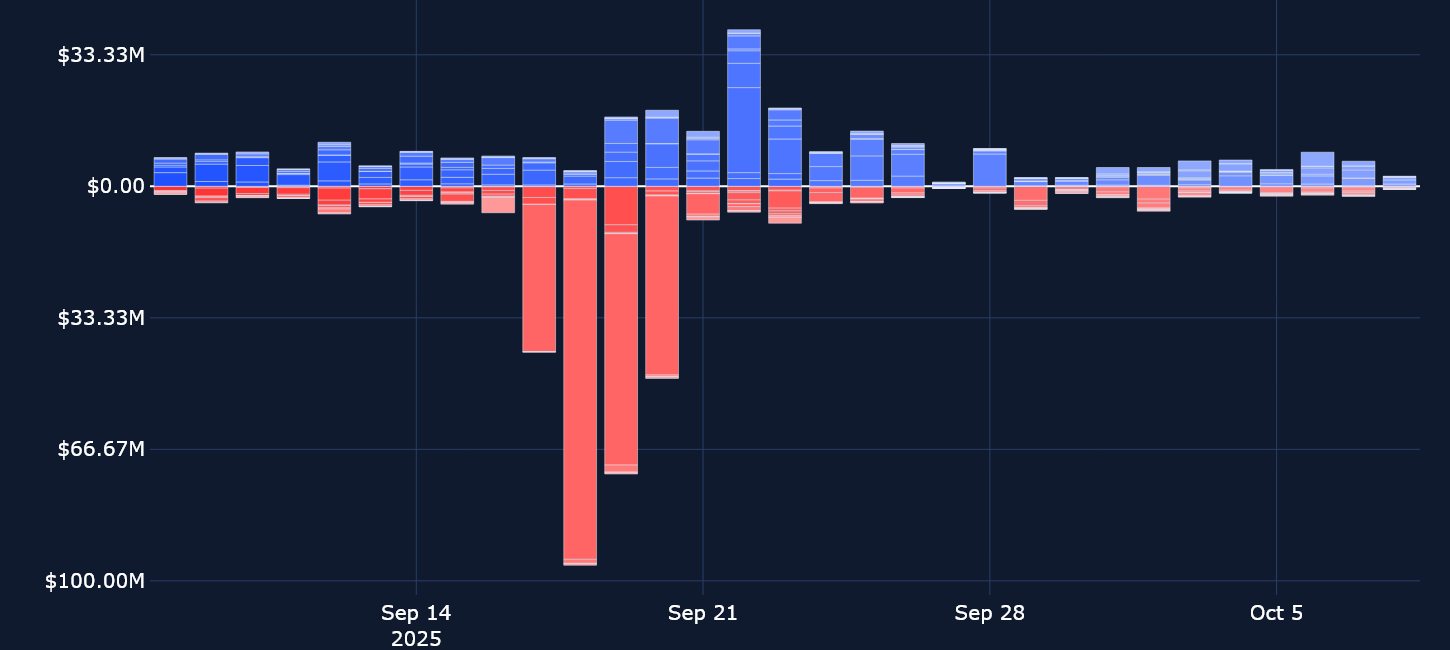
Perpetuals: Open interest has dropped off from its pre-September FOMC meeting highs, and even a rally for BTC to new highs has failed to inspire a recovery in open interest back to those levels.
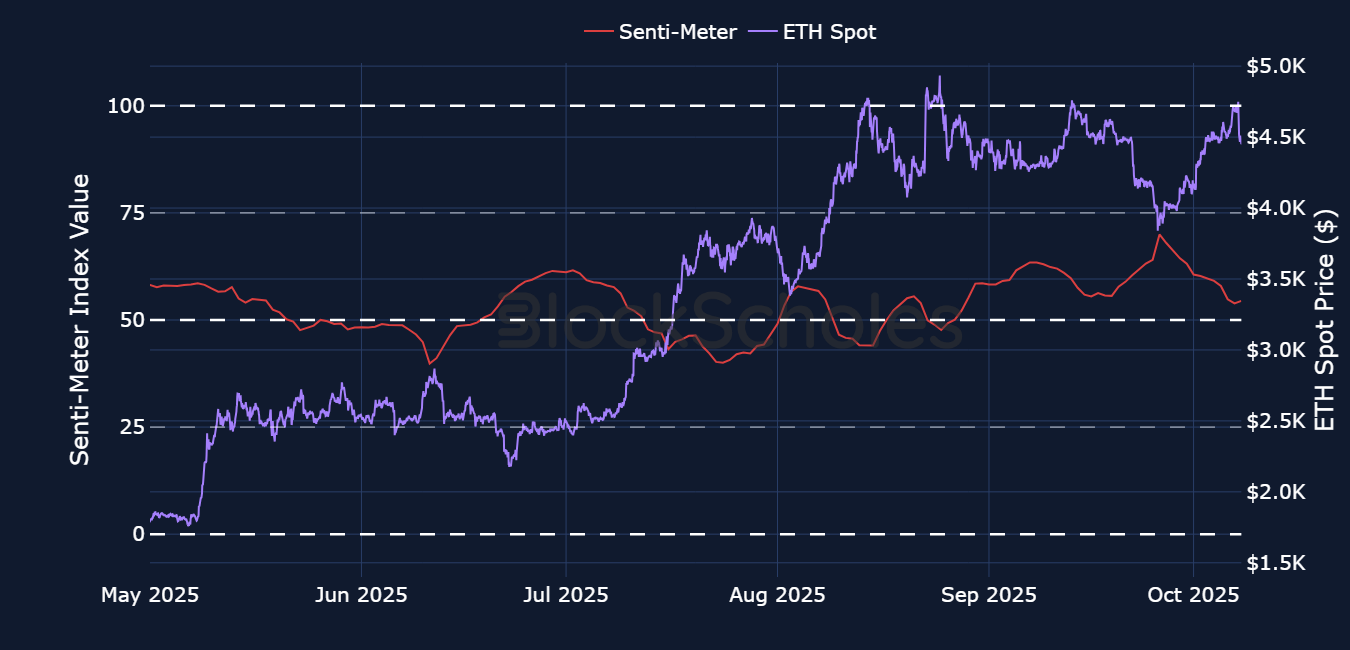
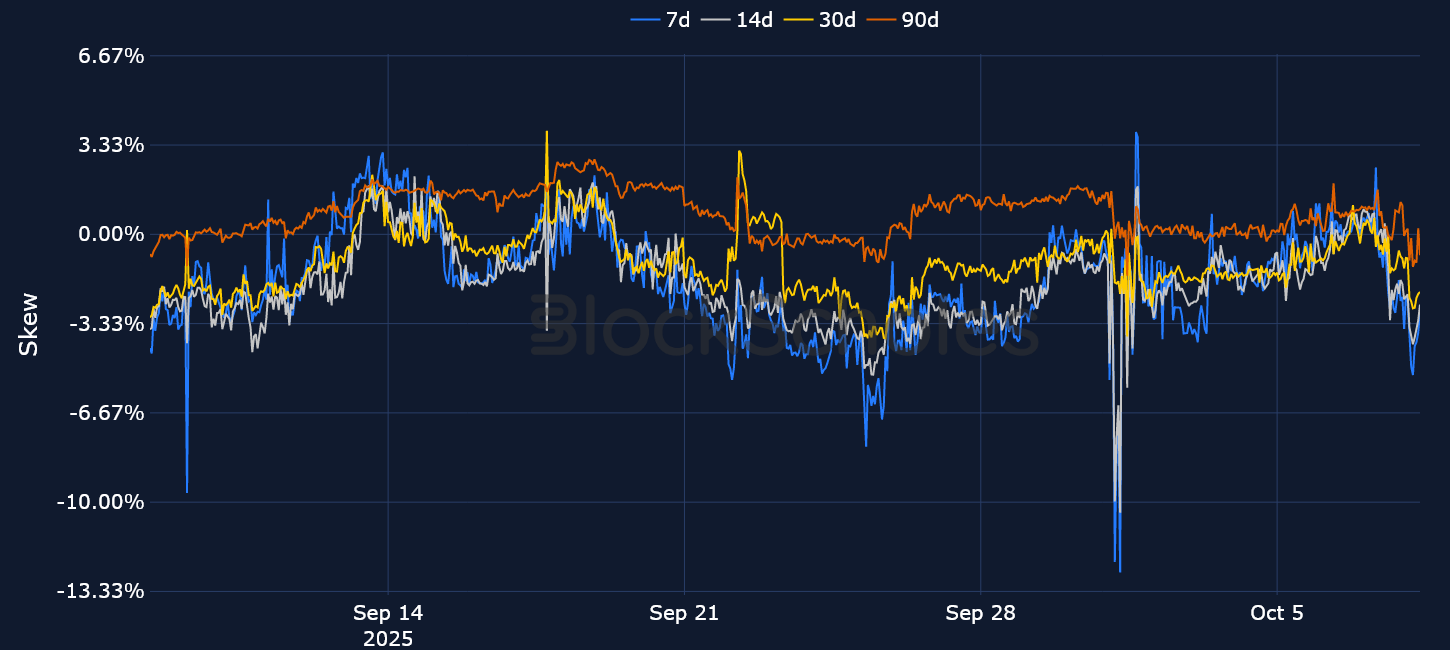
Options: BTC volatility smile skews briefly skewed toward call options for one-week contracts, though longer-dated options never shifted to a full bullish mode, at most reaching neutral levels before dropping. A larger drop in ETH’s spot price since touching $4,700 has resulted in a sharp switch from neutral to bearish (−3.3% skew) at quite an extreme speed.
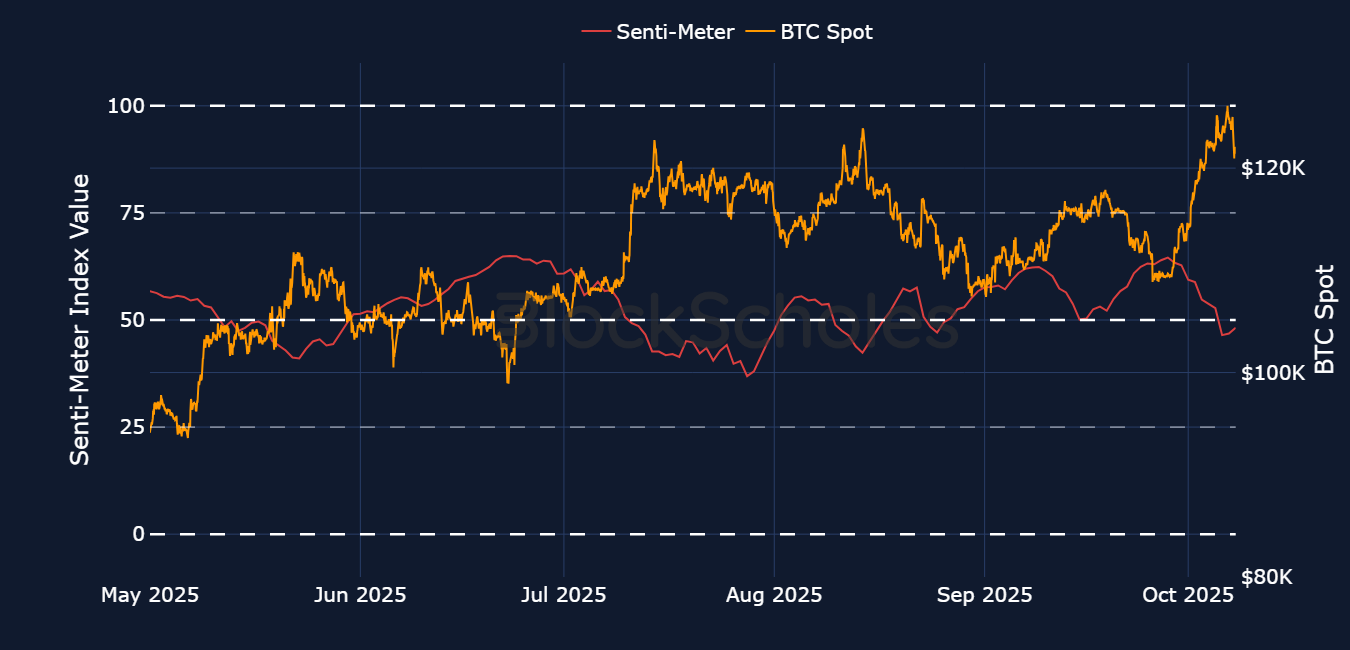
Block Scholes’s Senti-Meter Index aggregates the funding rate, future-implied yield and volatility smile skew into a single expression of sentiment in derivatives markets. See more in the methodology article here.
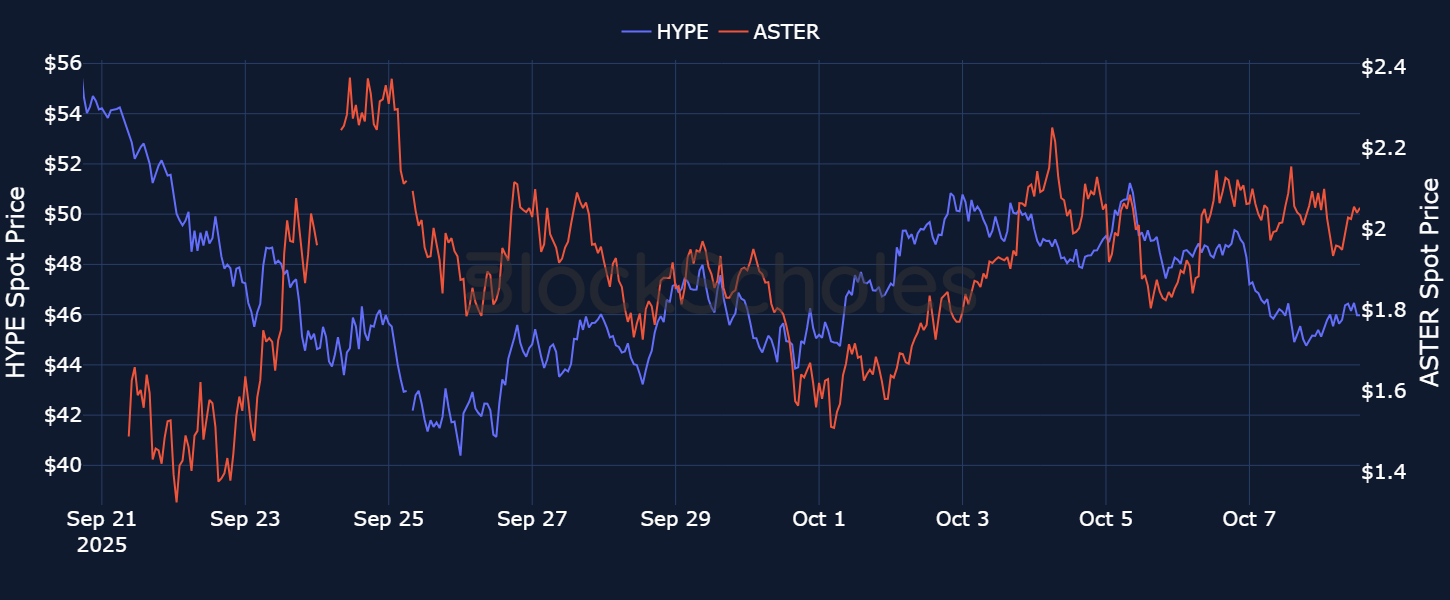
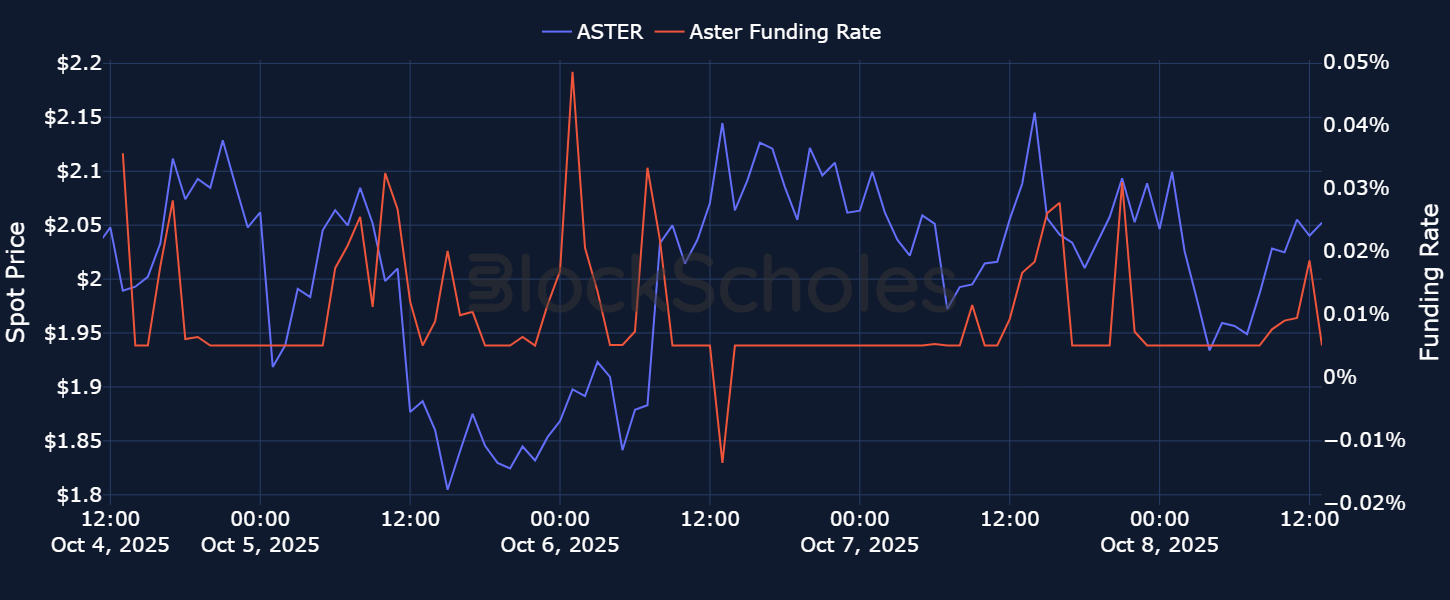
Perpetual swap decentralized exchanges (DEXs) have recently made crypto headlines, as monthly trade volumes across the major perp DEXs exceeded $1T for the first time in September. One particular DEX which has grabbed attention is Aster, a multi-chain DEX with plans of launching its own Layer 1 blockchain.
Aster’s native ASTER token, which launched on Sep 17, 2025, has since seen a significant rally, surging from $0.10 at launch to above $2.30 at its peak on Sep 24, 2025. It has outperformed most of the crypto market as a whole, including other DEX-based tokens, such as Hyperliquid’s HYPE token.
One feature of the Aster DEX is a Pro Mode that allows users to place hidden orders, which allow a trader to make a limit order that’s hidden from the order book until it’s executed. This aligns with other “privacy-coin” narratives that we’ve recently highlighted.
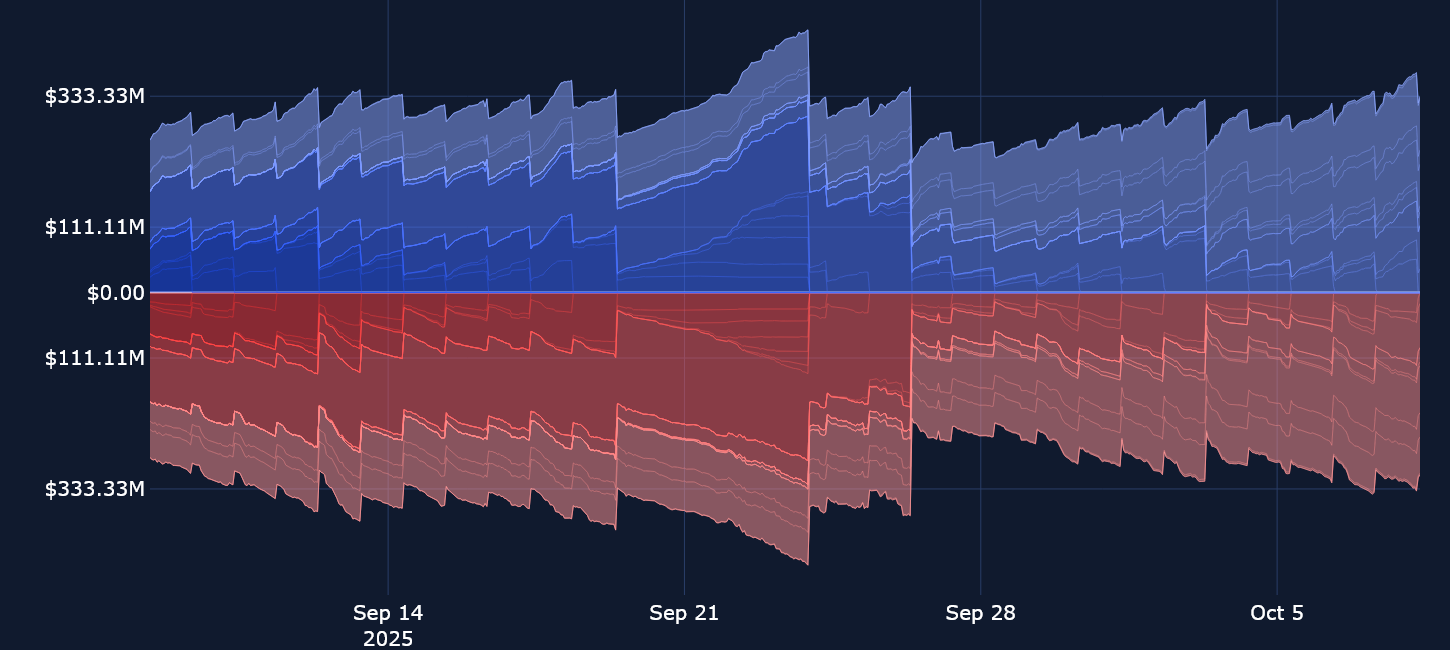
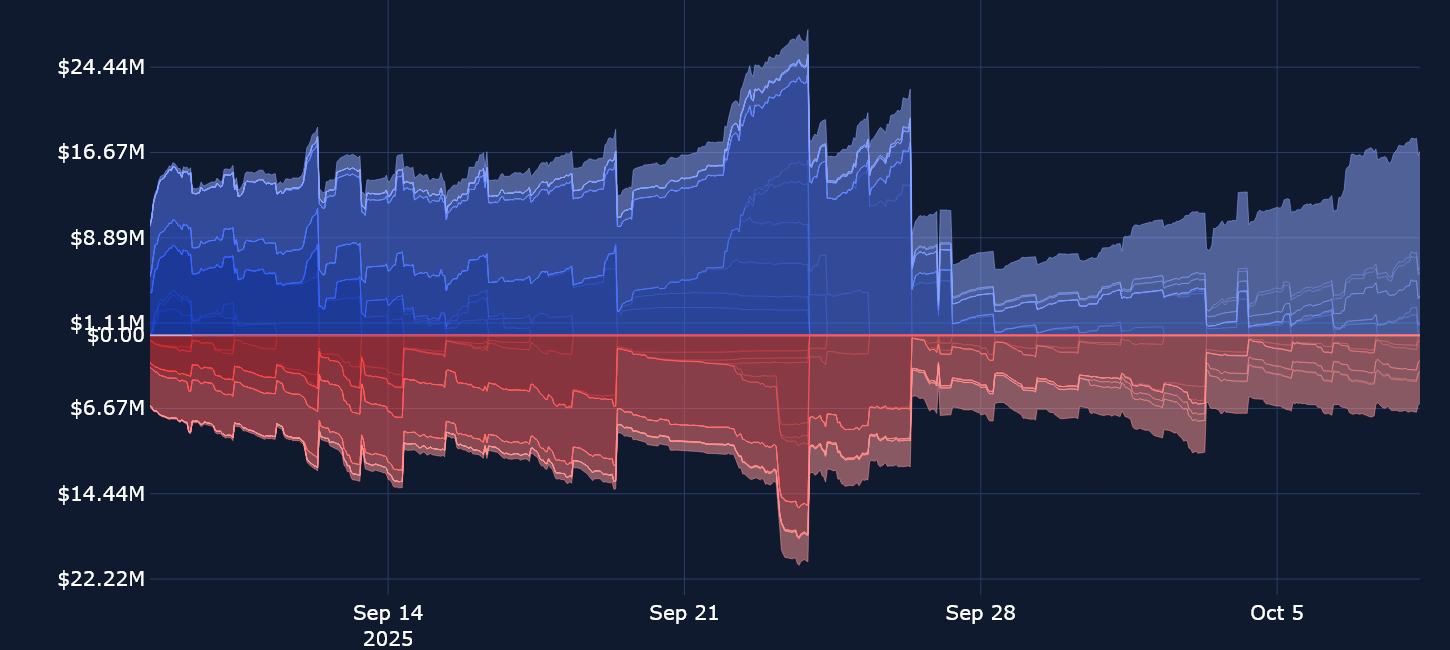
In last week’s edition, we noted that open interest in perpetual contracts had plunged lower following a major liquidation event on Sep 22, 2025. Open interest in ETH contracts dropped by over $1B as Ether’s spot price retested the support level of $3,800. Despite BTC and ETH finding large buy-side demand at lower levels, pushing BTC to new all-time highs of $125K and ETH to $4,700, open interest has not only failed to recover to the levels it fell from in mid-September but has also started to fall again as BTC quickly pulled back from its ATH. This suggests signs of profit-taking in both spot and perp markets.
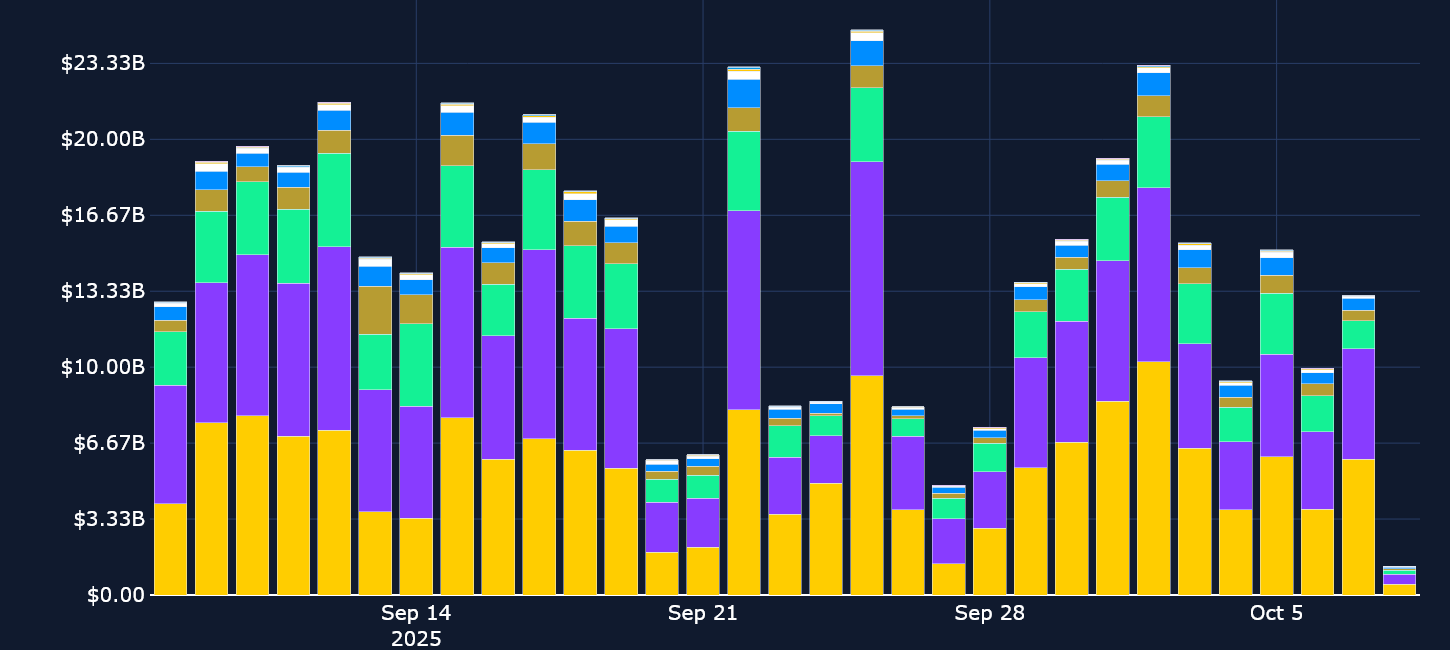
Traders seem to be closing BTC perpetual positions and taking profits, and a similar activity may be taking place in spot markets, too. However, it may also be the case that the spot rally is being driven by buyers elsewhere, perhaps in Spot Bitcoin ETFs, which had their second-strongest week of inflows since launch last week. A similar story is seen in ETH, too, with strong Spot ETF inflows and a lack of participation in the rally from perpetual swap traders.
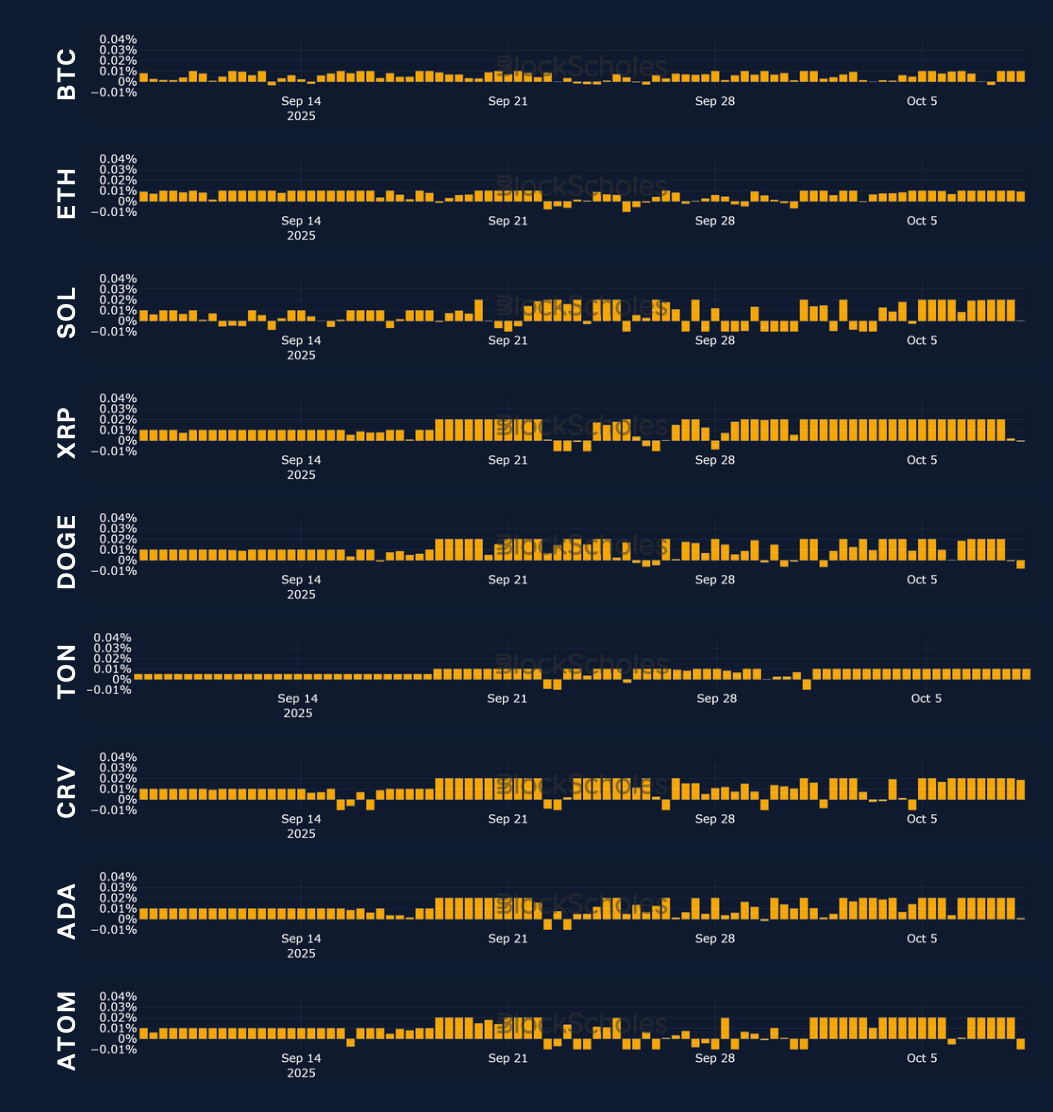
This week, altcoins have seen varying sentiment. At 0.02%, XRP stands out as a token with a consistent positive funding rate through the week — despite a negative price performance over the same period, with the last time the token’s spot price rallied back in mid-July. On the other hand, SOL, which is marginally up over the past seven days (and 10% in the past 30 days), has experienced a whipsaw of positive and negative rates.
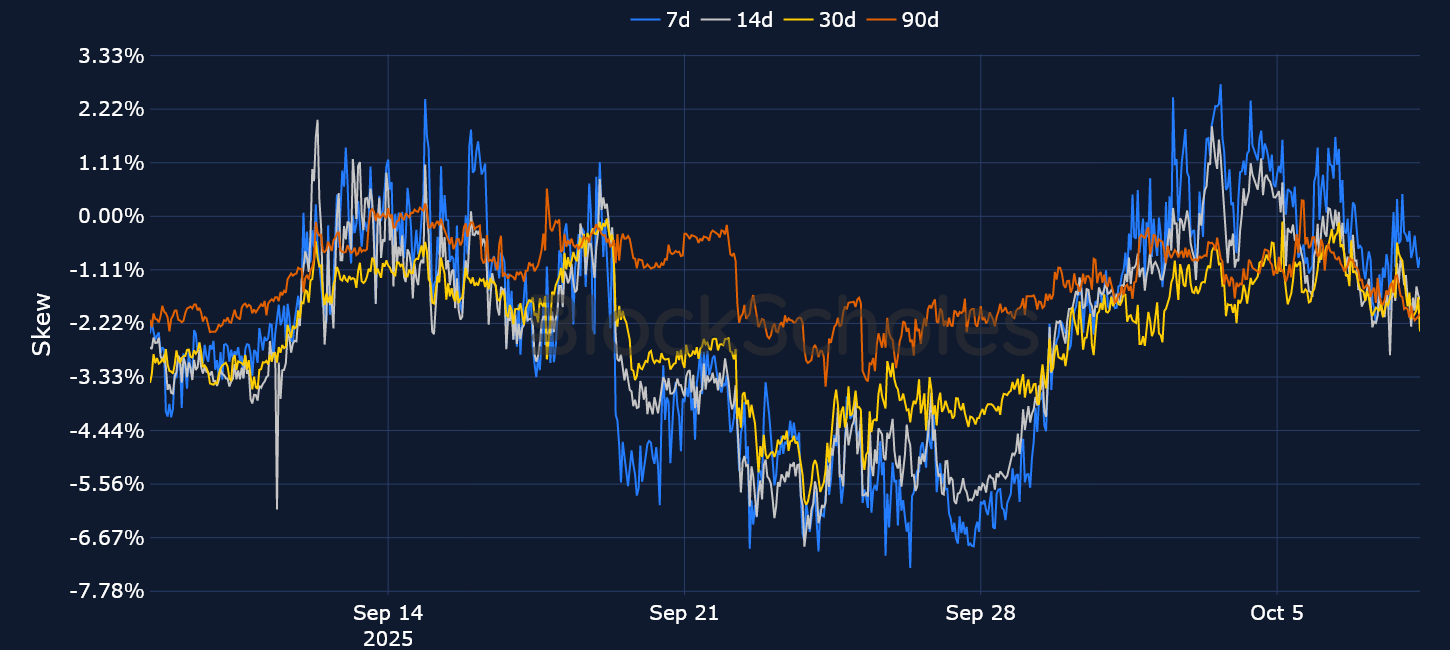
BTC funding rates have once more failed to drop to negative levels (where short traders pay fees to longs to keep their positions), but haven’t risen to any significant highs, either — as one might expect during a week of two ATHs. That’s still a different sentiment from that seen in options markets (where skew levels have bounced around a lot more), which have also had a bias toward puts for most of the past week. The lack of big moves in BTC funding rates may be a reflection of the lower participation rates — an observation backed up by the falling levels of open interest without any obvious liquidation event.
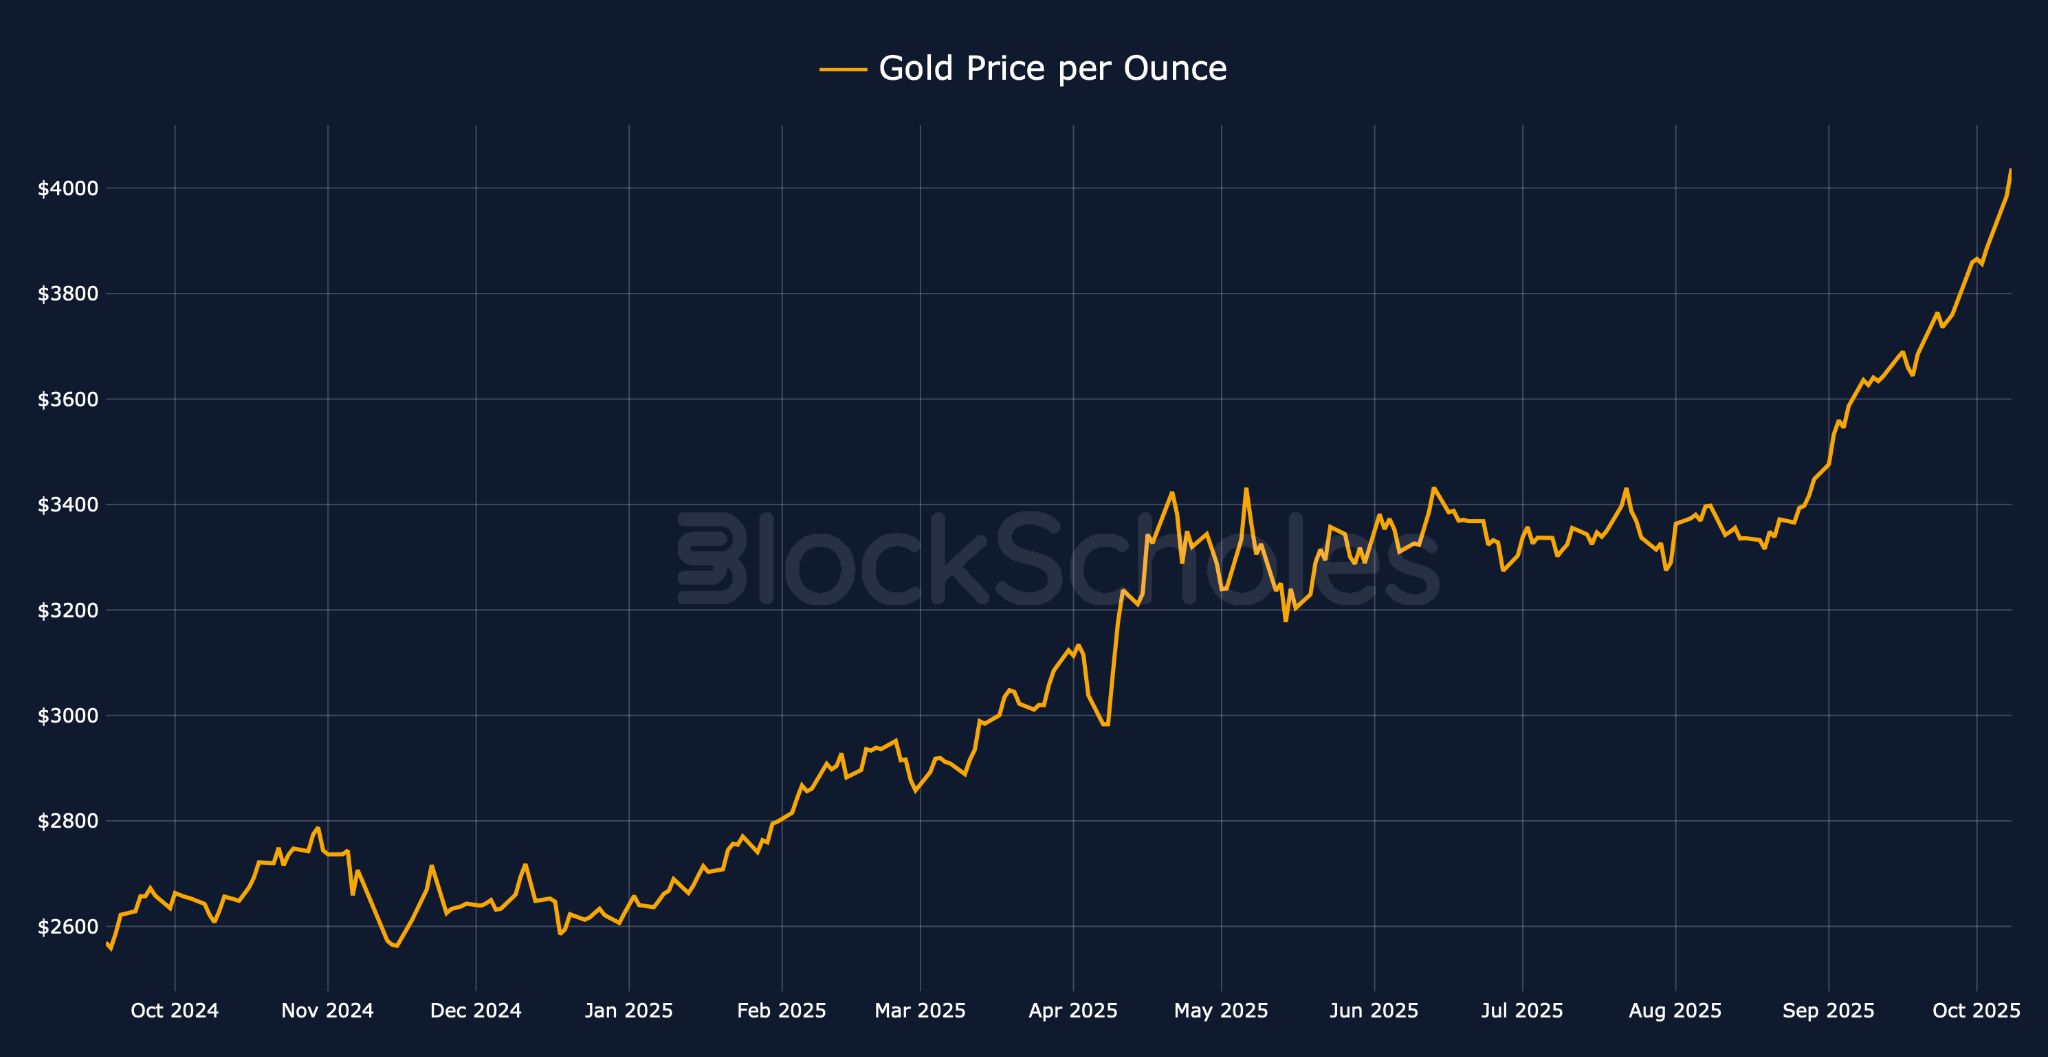
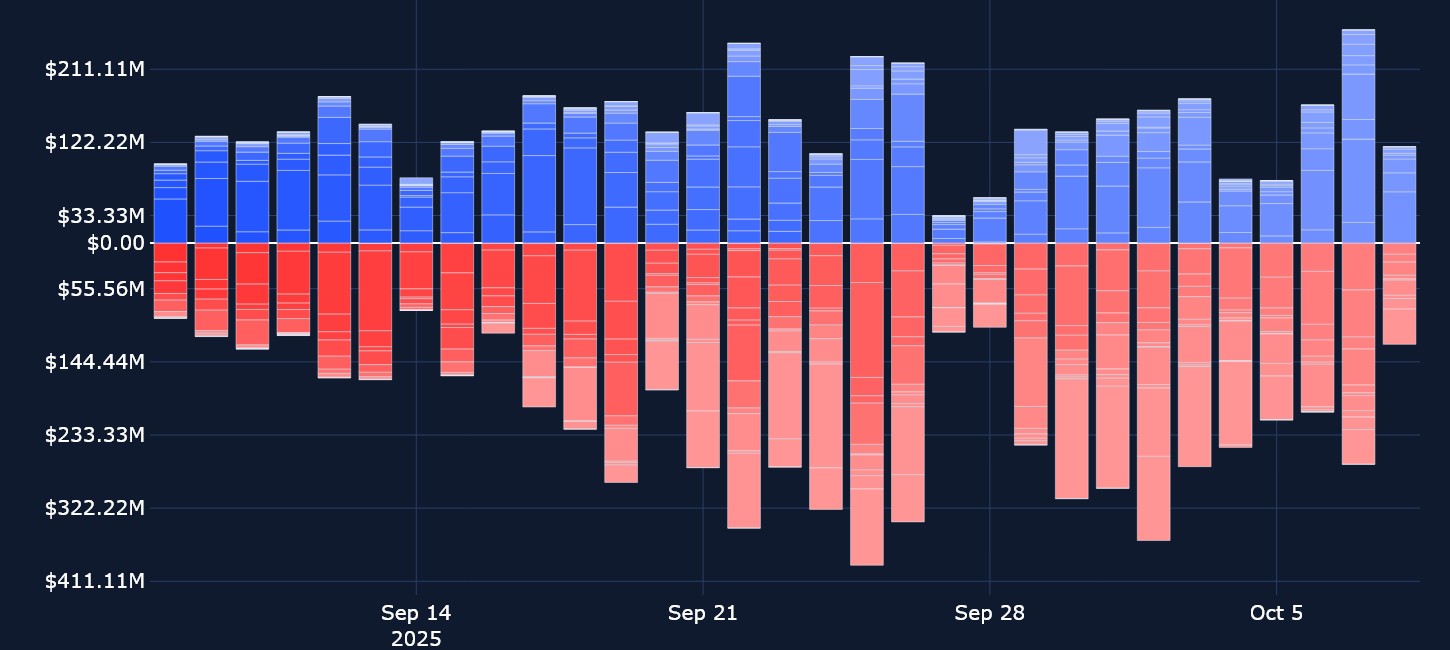
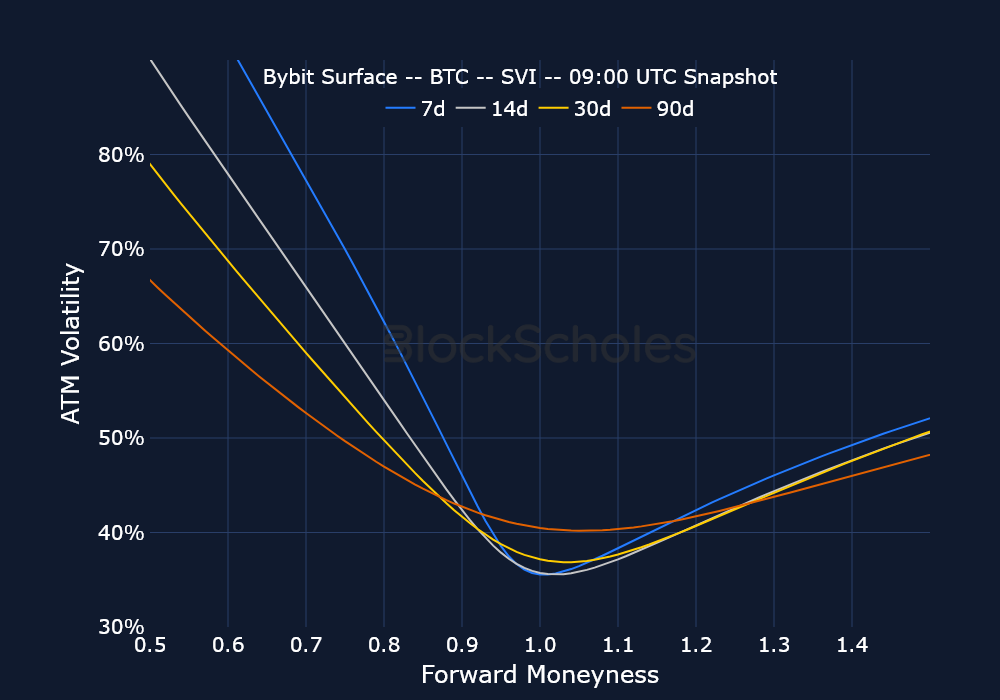
Market spectators have assigned a name to the recent concurrent rally of BTC and gold: “The debasement trade.” Despite both assets rising to new highs (gold is still ploughing forward, while BTC has at least temporarily stopped), activity in options markets hardly show that a new ATH was reached, or that BTC’s recent rally came with a name. We can see relatively consistent levels of volumes in call options over the past week, and note that volumes have been skewed higher toward short-dated puts.
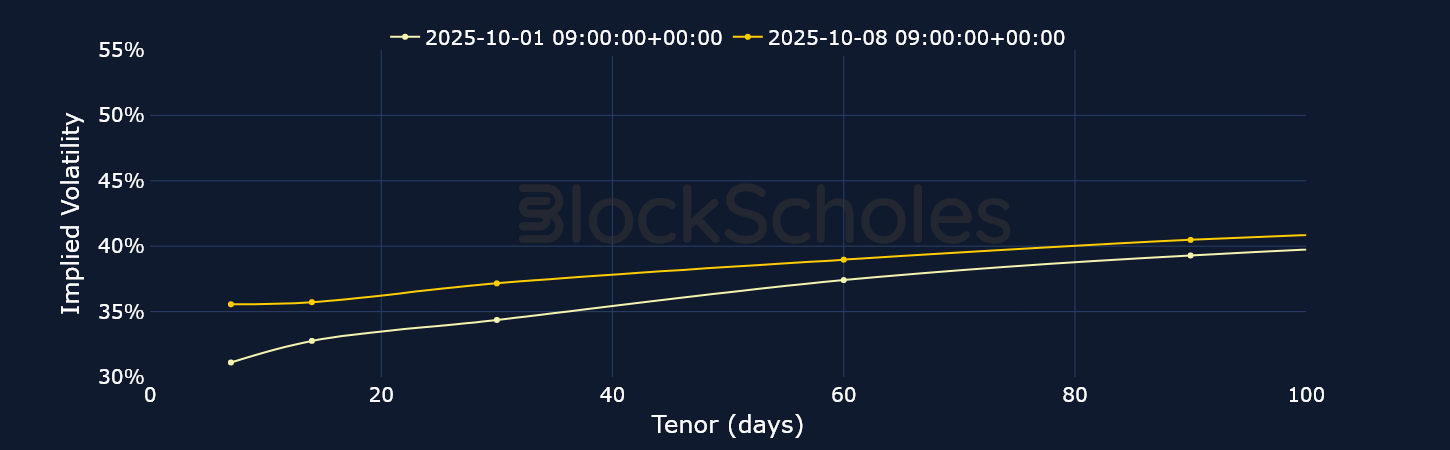
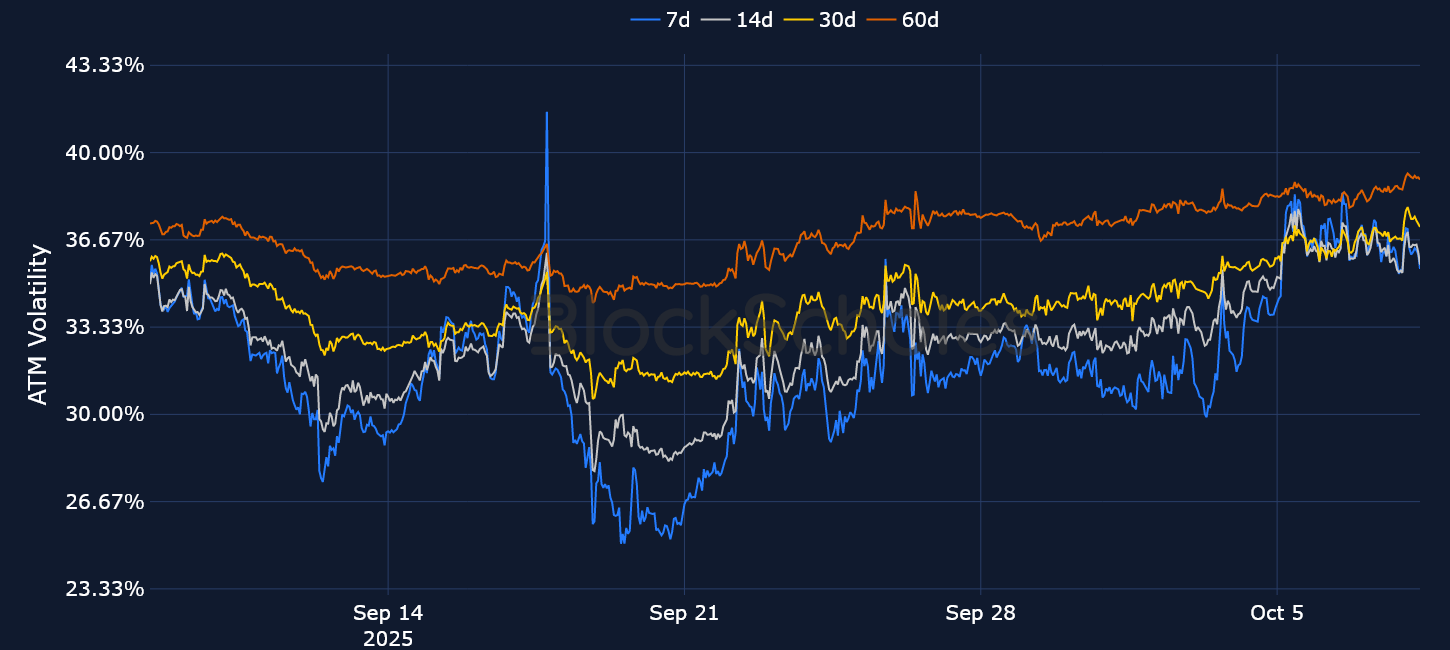
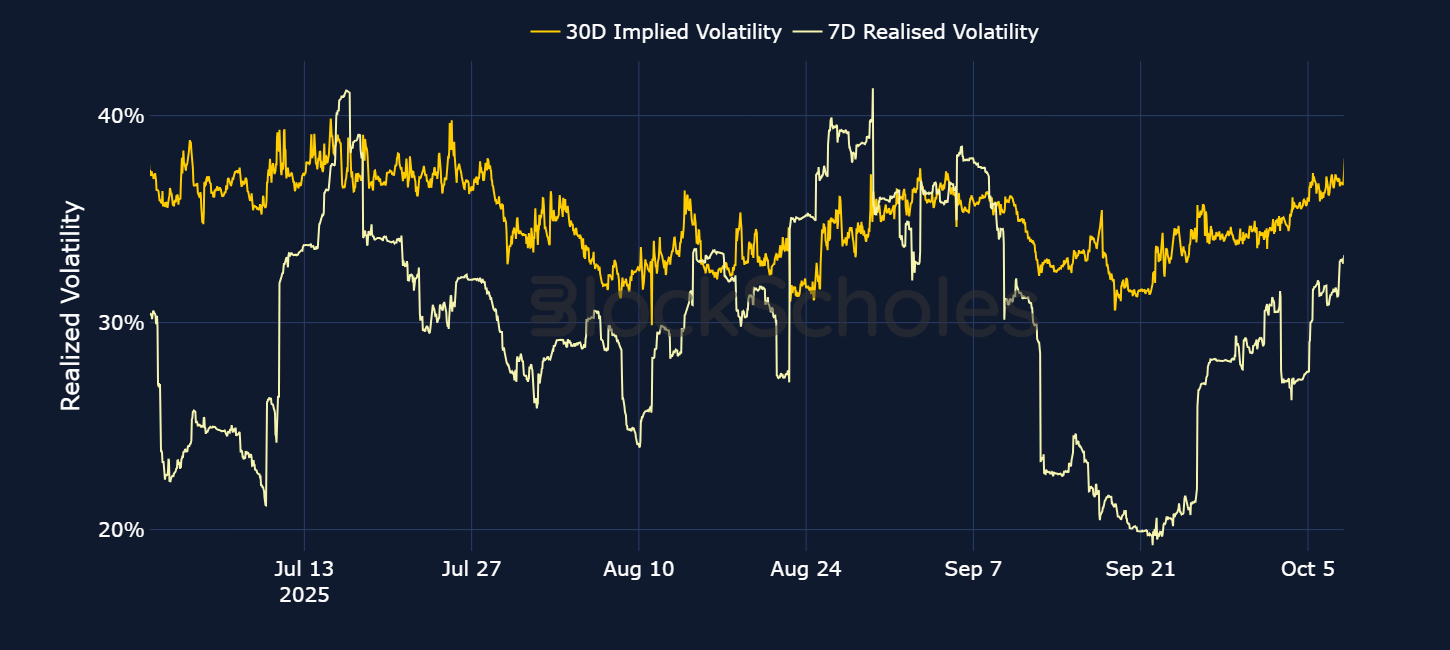
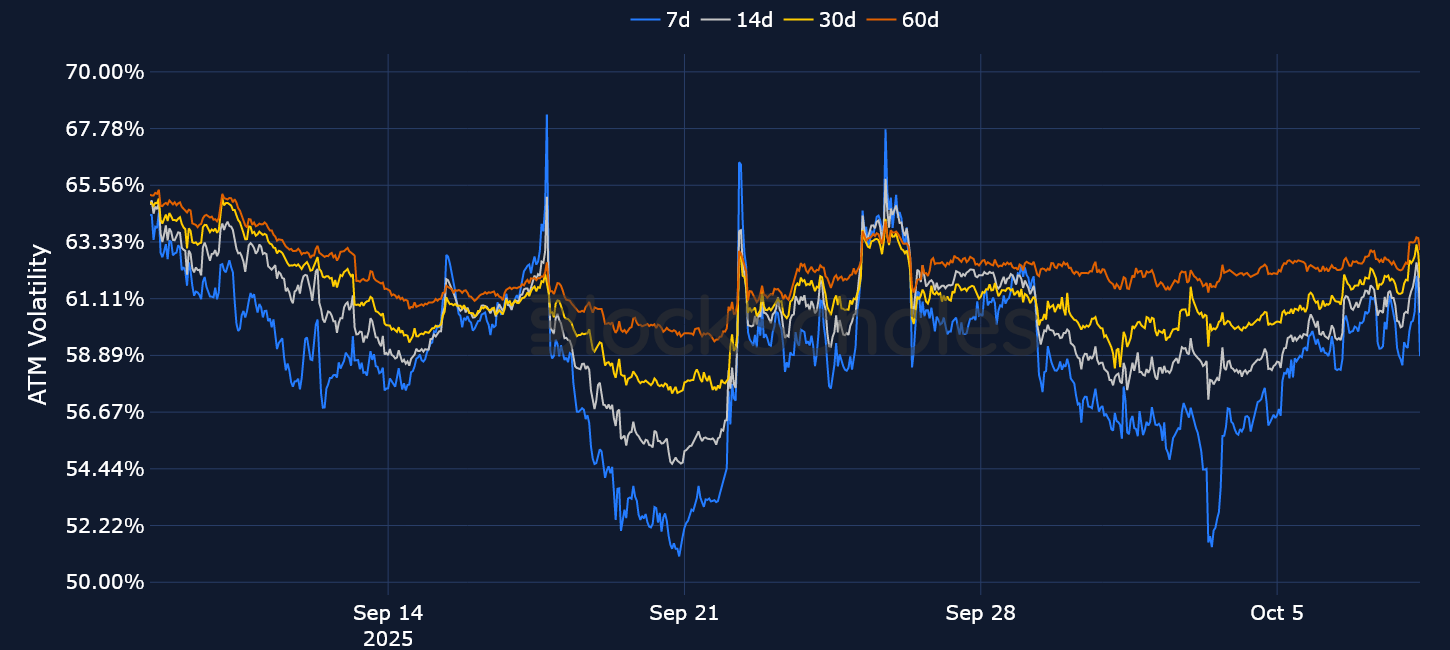
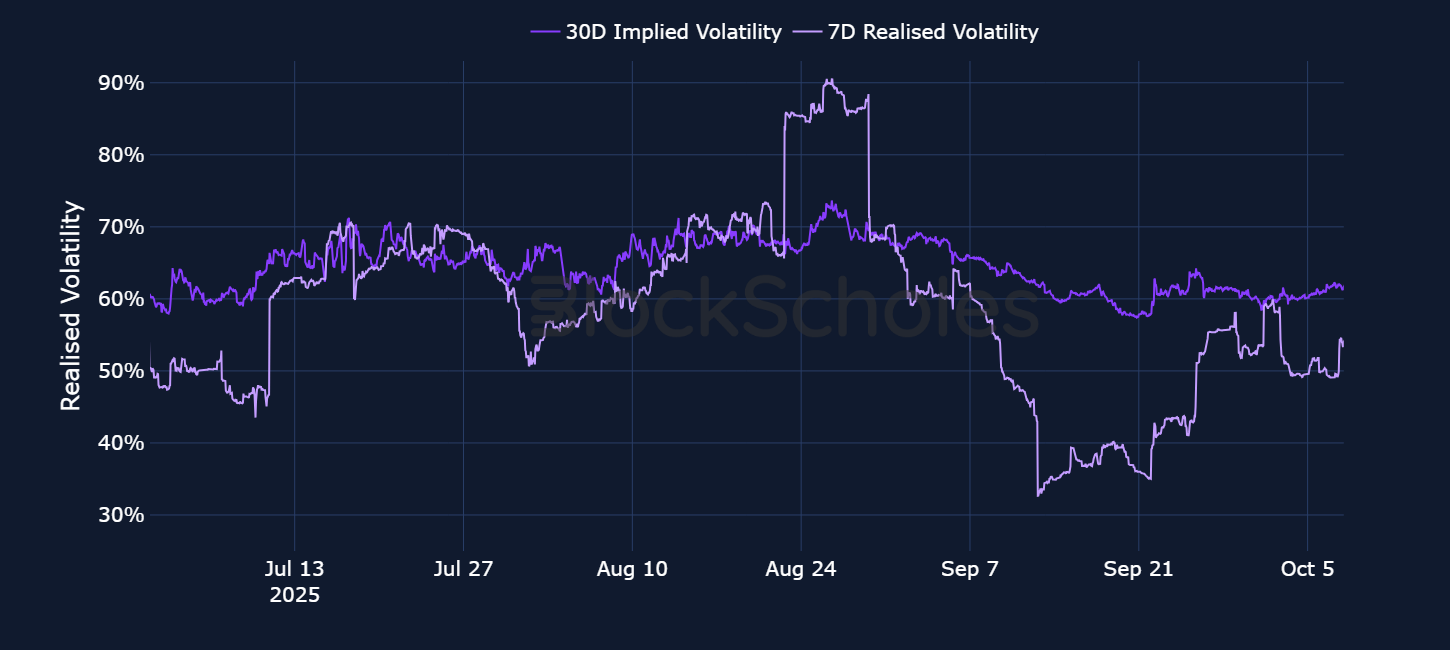
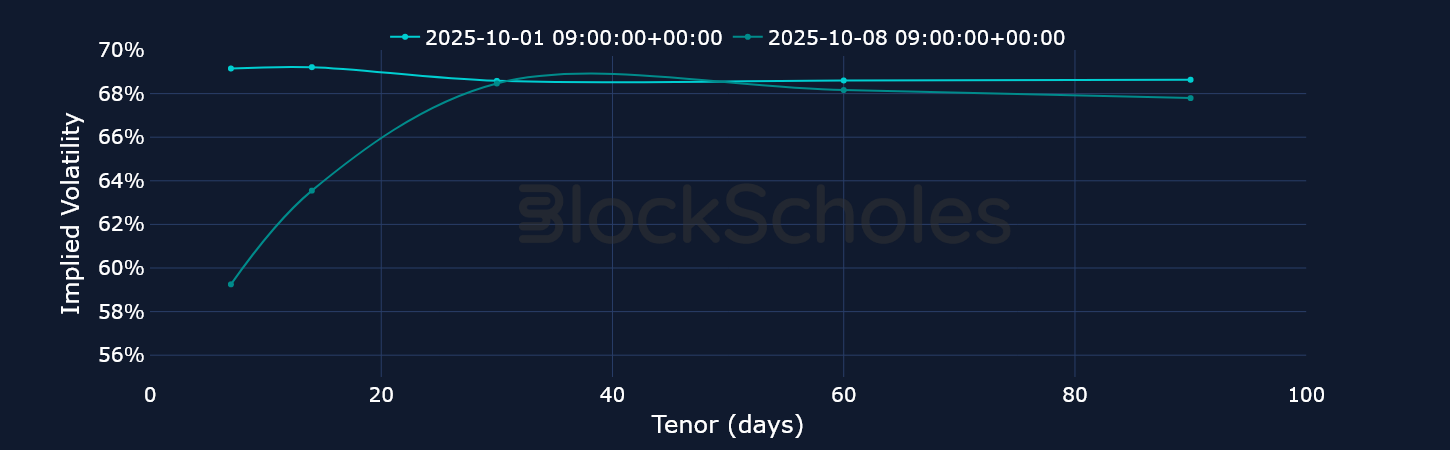
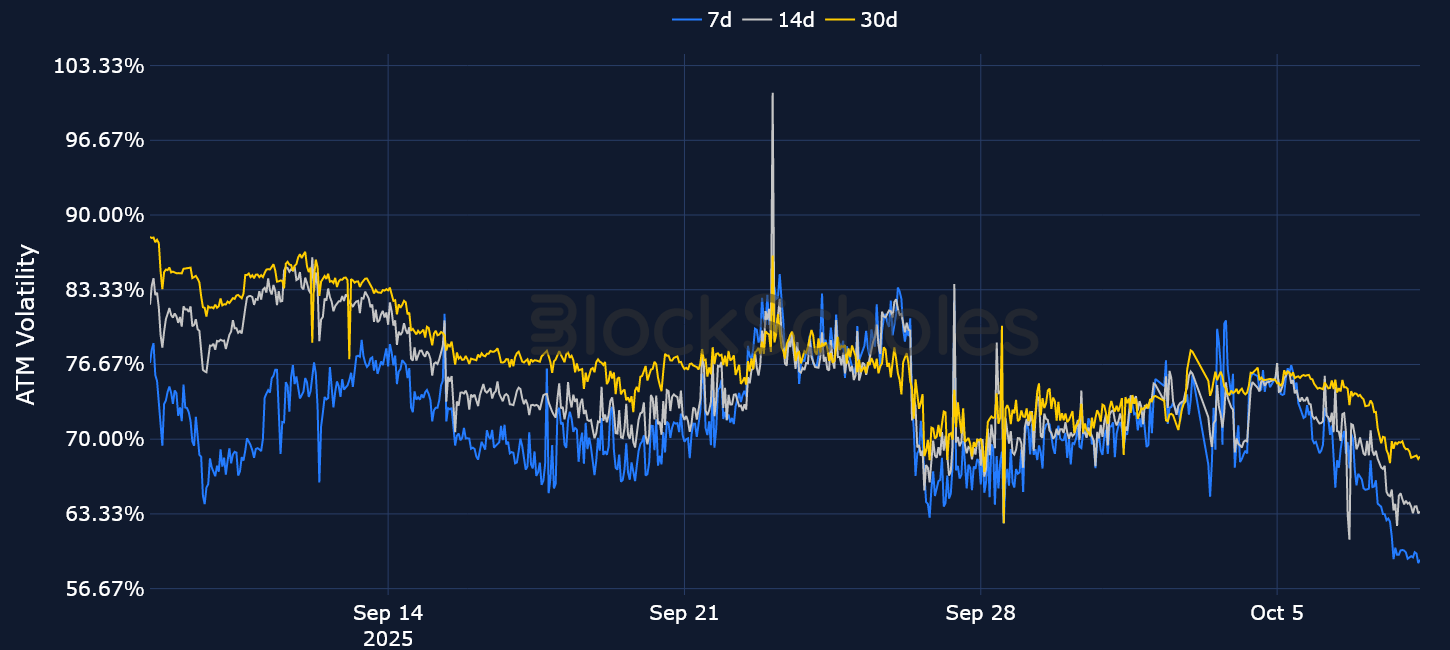
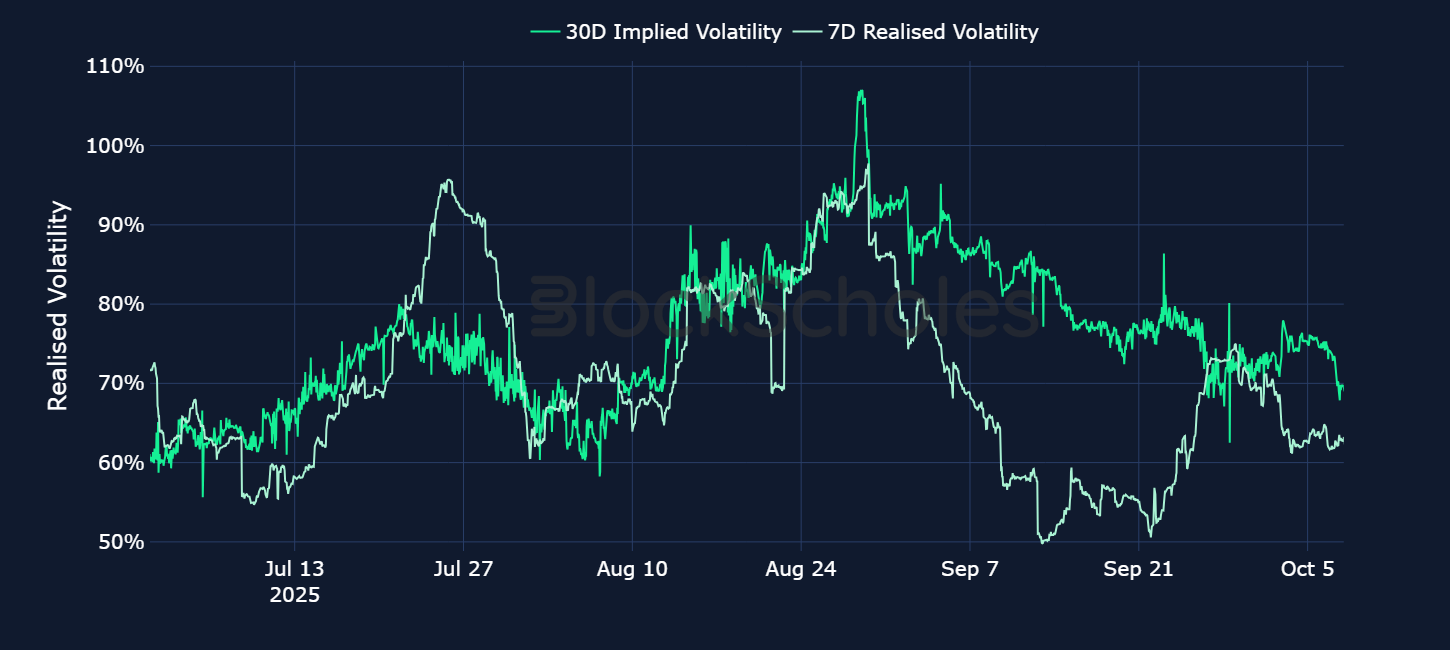
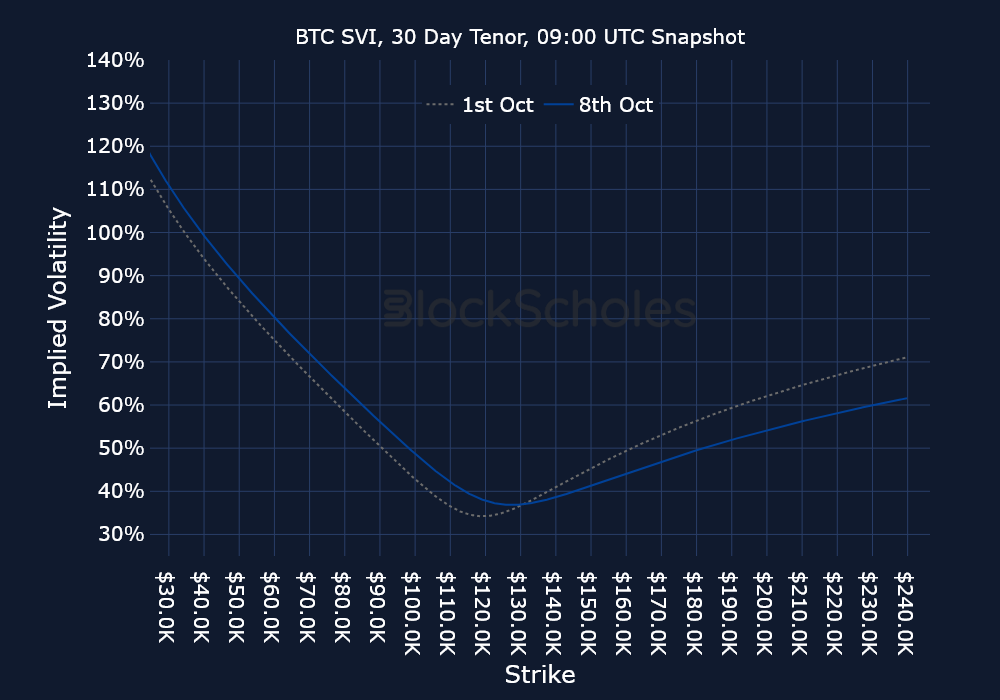
ATM implied volatility levels have lifted slightly over the week, likely a parallel move to the rise in delivered volatility since the end of September and into October. However, that 15 volatility points move in realized volatility went from a range we’ve defined as historically low to a range that’s still relatively low. All in all, it suggests implied volatility has moved up alongside realized volatility — and that a new ATH for BTC is still not quite enough to inspire volatility levels past 40% for one-week contracts.
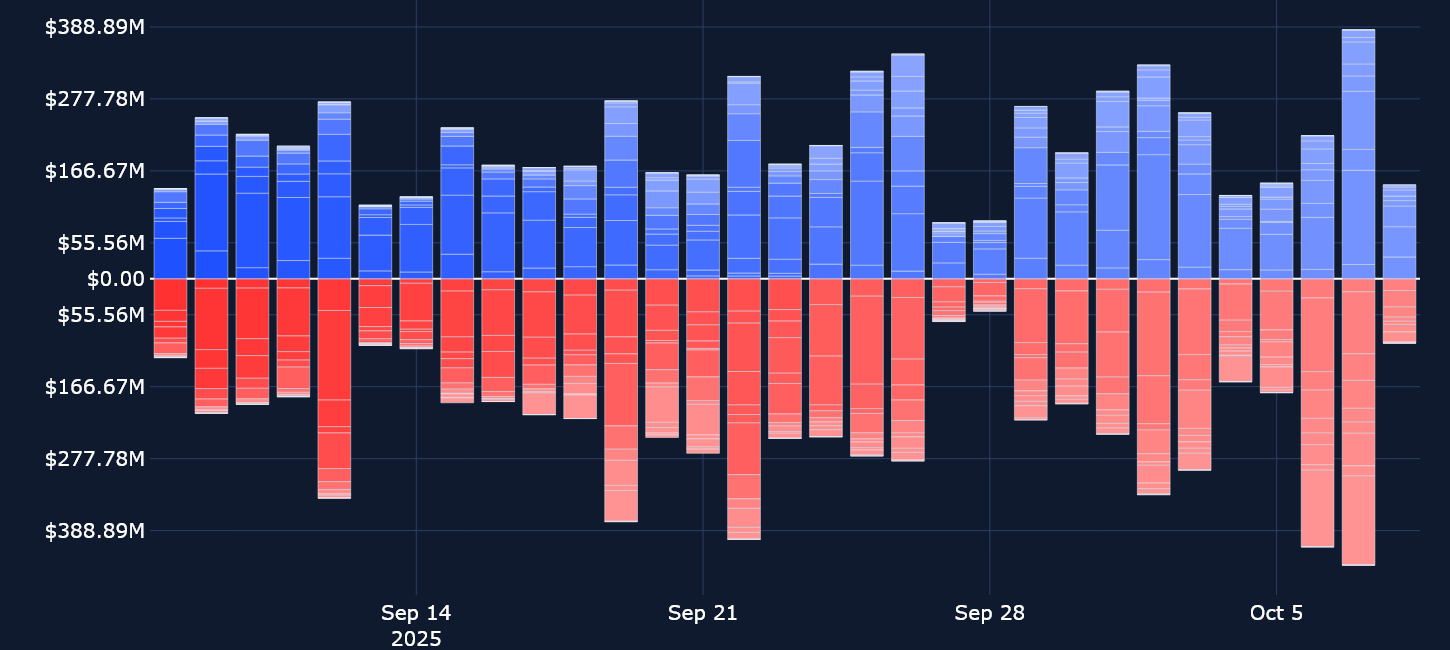
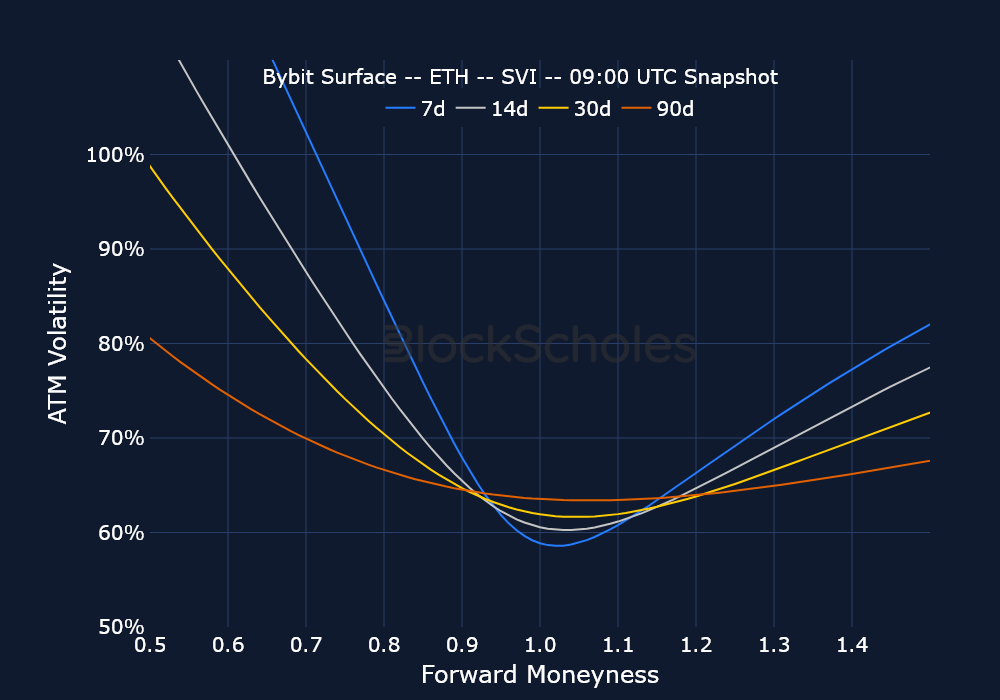
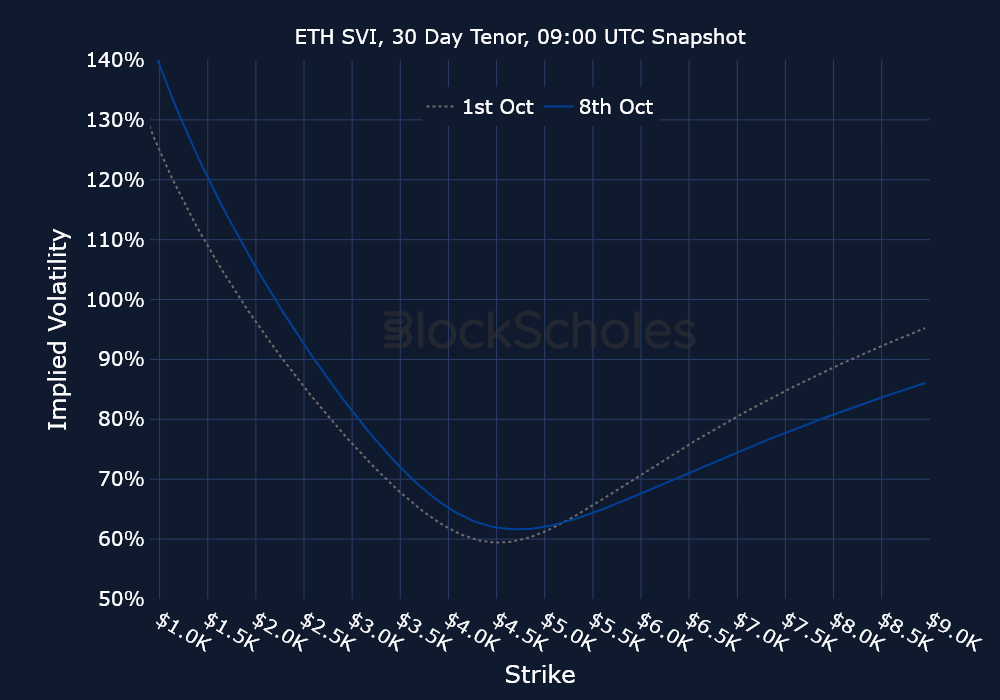
While ETH’s spot price and its options markets tend to react more sensitively to the same drivers that affect BTC’s markets, the slow, range-bound activity we covered for BTC is actually taking place for Ether, too — at least over the past month or so. Options volumes show an even more consistent pattern relative to BTC, being dominated by puts and failing to exceed $120M on most days. That dominance in options volumes toward puts also matches the demand for short exposure expressed by the skew of ETH’s volatility smiles.
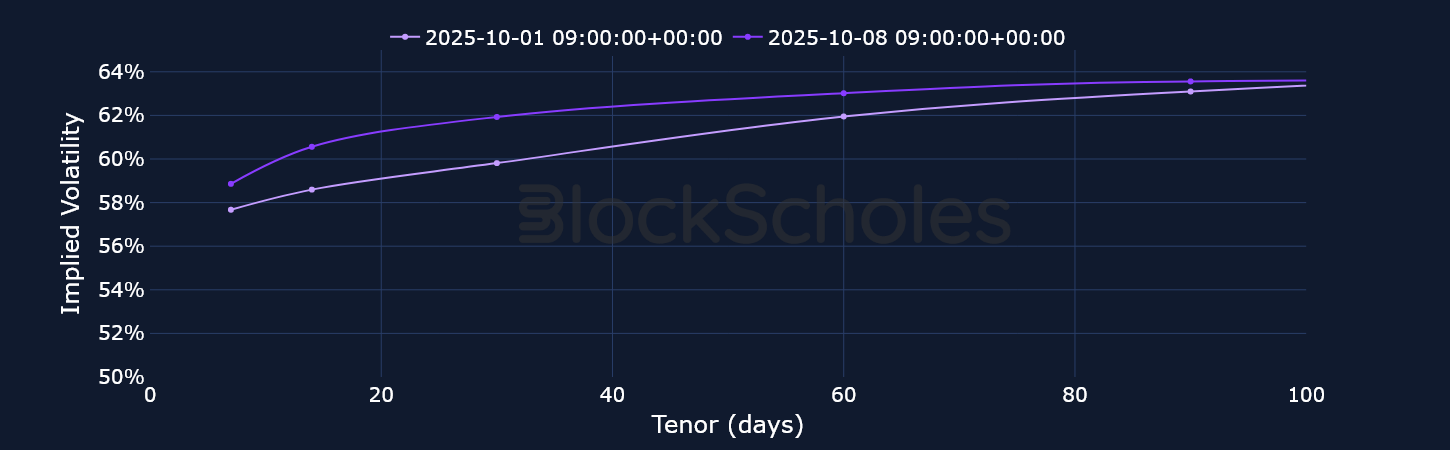
Short-tenor Implied volatility has found a low floor at 50%, a level it has seldom fallen to, but has quickly bounced off each time. We’re also seeing that even during periods of market “blowups” and inversions (for example when the spot price sells off sharply), implied volatility hasn’t reached the same high-70% and low-80% levels it did earlier in the year. This is at least an early indication that ETH is tending toward the same phenomenon around BTC — that is, inversions are initially capped by short volatility sellers at the front end of the term structure, and then inversions later become a rare event as both realized and implied volatility steadily fall lower over a period of months.
If the low activity in options markets this week wasn’t evident from the charts we’ve analyzed so far, the case of SOL should make this point abundantly clear. Options volumes are far lower than what we’ve seen in recent weeks, though they do stand out for BTC and ETH in that they’re higher in calls than puts. This low activity isn’t a surprise, however — as realized volatility has continued to drop for SOL, which often translates into lower levels of volumes in spot (and, seemingly, in options markets too). Implied volatility is also dropping alongside realized volatility — despite a recent meme-coin meta that has gripped markets (and had previously benefited the Solana ecosystem). This time around, the activity seems to be routed in other DEXs with their own native blockchains, such as Aster and Hyperliquid.
The narrative this week is that options markets have seen relatively little activity (despite a rally in spot prices) — and sentiment has been fragile across the majors. That fragile sentiment is perhaps best seen in ETH’s volatility smiles, which have switched from neutral to bearish (−3.3% skew) at quite an extreme speed.
BTC first rose to an ATH on Sunday morning, then once more on Monday evening — and yet, these two new highs failed to inspire a positive skew toward calls for more than a few hours at a time. This suggests that despite a spot rally, options traders never switch to a full bullish mode in BTC — and definitely not in longer tenors, which only rose as high as neutral levels before immediately crashing back down with short tenors. Nonetheless, it cannot be argued that, relative to recent history, this was a more bullish week for BTC — both in short tenors, which hit a skew of 1.1% in favor of calls, and in spot price.
Open interest and trading volume data are sourced “as is” from the Bybit exchange platform API exclusively, and as such do not represent a comprehensive picture of the sum of trading activity across all derivatives markets or exchanges. The data visualized in this report consists of hourly and daily snapshots, recorded over the previous 30 days. Daily (hourly) snapshots of trade volume record the total sum of the notional value of trades recorded in the 24H (1 hour) period, beginning with the snapshot timestamp.
If not explicitly labeled as derived from another exchange, the input instrument prices to all derivatives analytics metrics in this report are sourced from the appropriate endpoints of Bybit’s public exchange platform API. In the event that data is labeled or referred to as representing the market on another exchange source, that data is sourced from the appropriate endpoint of each respective exchange’s public API.
Macroeconomic charts and data are sourced “as is” from the Bloomberg Terminal. Exchange data is sourced “as is” from publicly available exchange APIs. Block Scholes makes no claims about the veracity of public third-party data.
After acquisition of underlying-denominated raw data for open interest and trading volume on the Bybit exchange platform from Bybit’s API endpoint, equivalent dollar-denominated figures are calculated using the concurrent value of Block Scholes’s Spot Index for the relevant underlying asset.
Block Scholes’s Spot Index represents the aggregate Spot mid-price for a given currency across the top five CEXs by volume (with USD-quoted markets). It considers the proportion of total volume in the instrument on the exchange, as well as the deviation of a data point from those on other exchanges.
Futures prices are used for Block Scholes’s futures-implied yields calculation services in order to derive the constant-tenor annualized yields displayed in the Futures section of this report.
Options prices are used for Block Scholes’s implied volatility calculation services in order to calibrate volatility surfaces, from which all derivatives volatility analytics displayed in the BTC Options and ETH Options sections of this report are calculated. Volatility smiles are constructed by calibrating to mid-market prices observed in Bybit options markets. As part of the calibration process, prices go through rigorous filtration and cleaning steps, which ensures that the resulting volatility surface is arbitrage-free and has exceptional fit to the market observables.


.jpg)
.jpg)