Andrew Melville
Head of Research
Further sideways spot price activity has led both BTC and ETH to trade within their respective bounds of $94–97K and $1.7K–$1.8K. In response, their respective implied volatility levels continued dropping off for most of the past seven days before each bounced off its own 18-month floor after it was announced that the US and China would be having their first trade talk following a long game of cat and mouse, which saw neither side back down. In turn, we saw a near recovery of ETH skew from OTM puts and a bullish bounce toward calls from neutral levels for BTC.

Further sideways spot price activity has led both BTC and ETH to trade within their respective bounds of $94–97K and $1.7K–$1.8K. In response, their respective implied volatility levels continued dropping off for most of the past seven days before each bounced off its own 18-month floor after it was announced that the US and China would be having their first trade talk following a long game of cat and mouse, which saw neither side back down. In turn, we saw a near recovery of ETH skew from OTM puts and a bullish bounce toward calls from neutral levels for BTC.
Perpetuals: ETH funding rates have mostly registered positive values, whereas funding rates for BTC have fluctuated between −0.1% and +0.1% as spot prices have traded sideways.
Options: Implied volatility for BTC and ETH leaked lower for most of the past seven days before a bounce on May 6 after positive tariff developments. Open interest and volumes for calls are dominating puts for ETH, as ETH’s spot price has outperformed BTC’s over the past week as of the date of this report (May 7, 2025).


Block Scholes’s Senti-Meter Index aggregates the funding rate, future-implied yield and volatility smile skew into a single expression of sentiment in derivatives markets. See more in the methodology article here.
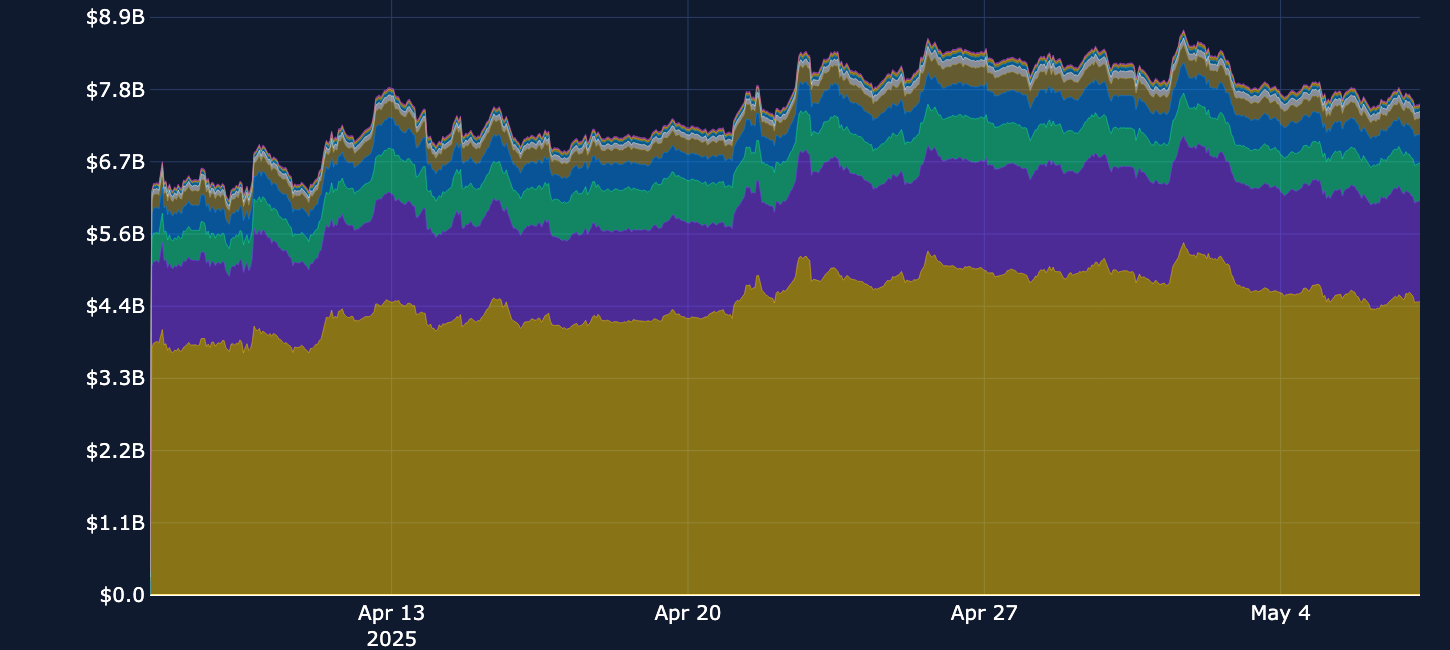
Open interest in perpetuals has dropped by around $1.15B from its May 1, 2025 high as BTC spot continues to consolidate within a tight band of $94K–$97K. So far, in May 2025, any subsequent rally or drop in price action has seen BTC rise or fall to one extreme of that band.
Most recently, the announcement of a trade meeting between the US and China later this week resulted in BTC moving up toward the ceiling of the range ($97K). Weekend activity continues to remain 50% lower than weekdays in perp trade volumes, with Sunday volumes consistently outperforming that of Saturdays. Additionally, 60% of open interest across the tracked tokens consistently remains in BTC perps.

BTC is up 4.73% since May 1, 2025, consolidating above $90K and trading just shy of the psychological wall of $100K once more. Recent spot price rallies have been met with either flat funding rates, or (as was the case of last week) counterintuitively negative funding rates. Sideways spot price action for the majority of the past week has resulted in a mix between the two, with traders not meaningfully committing to either back or fade the recent leg up.
The consistently positive funding rates observed with ETH last week have continued into this week, while another metric of derivatives sentiment, the put/call skew for ETH, has nearly recovered to neutral. Toncoin is down 5% over the past week and has seen some negative funding rates after being firmly positive at the tail end of April.

Throughout the past week, BTC implied volatility continued to tail off toward the floor of 35% that it’s consistently bounced off of for more than 18 months. This week saw a similar story: implied volatility for short tenors reached that floor, and have bounced five points since, now trading close to 40%. This bounce in implied volatility has been accompanied by a flat level of realized volatility (close to 30%), its own respective floor.
Meanwhile, open interest for BTC options continues to be stronger in puts than in calls (as we also saw last week). The demand for puts may be a sign of traders protecting themselves from a reversal in the relief rally, should tariff negotiations between the US and its partners disappoint, or perhaps instead fading a further move up in spot price.


Whereas open interest for BTC has been dominated by puts, the opposite is true for ETH. Open interest is now $39M greater for ETH calls than for puts, and options volumes are dominated by calls as well. Over the past week, ETH has outperformed BTC on the way up (+4%), though currently it’s still a distance away from $2K, a level it last saw back in early March 2025.
Volatility expectations for ETH remain higher than for BTC, and Ether’s term structure is positively sloped upward. That matches the positive futures curve and the mostly positive funding rates over the past week. However, the put/call skew, another measure of sentiment for ETH, is now tilted toward OTM puts at short tenors from its previously neutral value.


Open interest for SOL options has moved almost monotonically upward, having now recovered from a big expiration at the end of April that saw $2M of open interest in calls expire. Currently, calls dominate puts in both open interest and volume, despite SOL performing worse over the past week than majors BTC and ETH (up only 2.5%).
Implied volatility for Solana has continued to drop, with May 2, 2025 marking a local bottom. Since that bottom, short-tenor implied volatility has spiked up 12 points before dropping off slightly. SOL funding rates have mostly seen long positions pay fees to those with short positions over the past seven days, and skew has bounced from a bias toward OTM puts, to now close neutral (though still slightly negative).


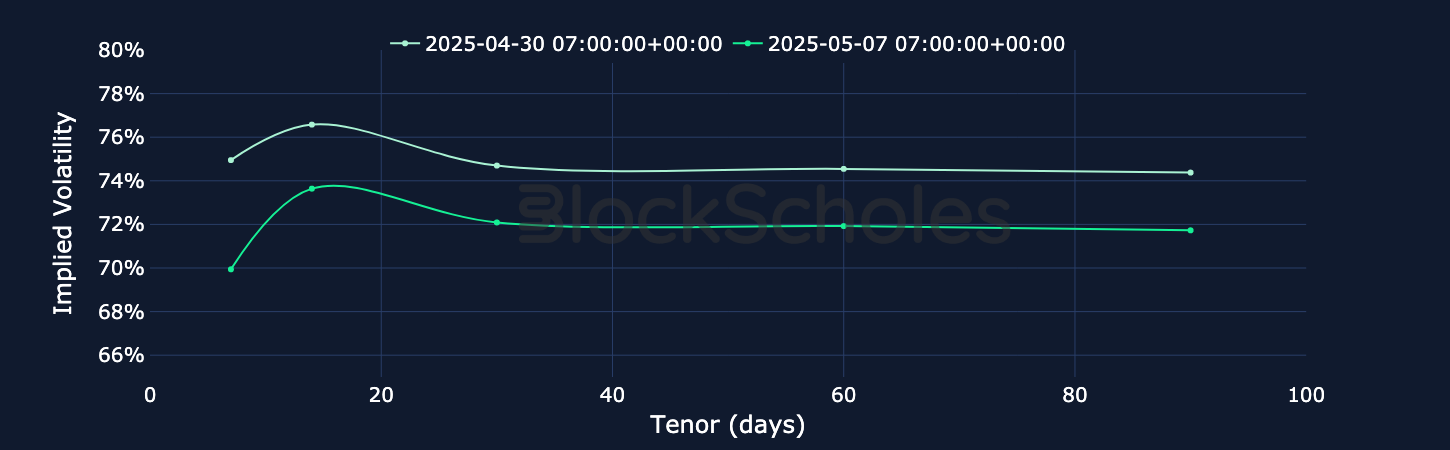


BTC’s volatility smiles were skewed toward calls for most of the past week before a brief drop to neutral, with a subsequent bounce back up toward calls (currently 2%) on May 6, 2025. That came following an announcement that US Secretary of the Treasury Scott Bessent would be meeting with Chinese Vice Premier He Lifeng to discuss trade policy. The skew of ETH smiles, which in contrast to BTC has been toward puts over the same period, has moved 3 percentage points to now nearly 0%.
Over a longer horizon, both BTC and ETH sentiment is more bullish. While ETH’s skew hasn’t quite recovered a bullish tilt at shorter maturities, other measures of directional sentiment suggest some bullish expectations from traders. For example, futures yields have risen from their April lows, and remain positively sloped, and funding rates have also mainly been positive.


Open interest and trading volume data are sourced “as is” from the Bybit exchange platform API exclusively, and as such do not represent a comprehensive picture of the sum of trading activity across all derivatives markets or exchanges. The data visualized in this report consists of hourly and daily snapshots, recorded over the previous 30 days. Daily (hourly) snapshots of trade volume record the total sum of the notional value of trades recorded in the 24H (1 hour) period, beginning with the snapshot timestamp.
If not explicitly labeled as derived from another exchange, the input instrument prices to all derivatives analytics metrics in this report are sourced from the appropriate endpoints of Bybit’s public exchange platform API. In the event that data is labeled or referred to as representing the market on another exchange source, that data is sourced from the appropriate endpoint of each respective exchange’s public API.
Macroeconomic charts and data are sourced “as is” from the Bloomberg Terminal. Exchange data is sourced “as is” from publicly available exchange APIs. Block Scholes makes no claims about the veracity of public third-party data.
After acquisition of underlying-denominated raw data for open interest and trading volume on the Bybit exchange platform from Bybit’s API endpoint, equivalent dollar-denominated figures are calculated using the concurrent value of Block Scholes’s Spot Index for the relevant underlying asset.
Block Scholes’s Spot Index represents the aggregate Spot mid-price for a given currency across the top five CEXs by volume (with USD-quoted markets). It considers the proportion of total volume in the instrument on the exchange, as well as the deviation of a data point from those on other exchanges.
Futures prices are used for Block Scholes’s futures-implied yields calculation services in order to derive the constant-tenor annualized yields displayed in the Futures section of this report.
Options prices are used for Block Scholes’s implied volatility calculation services in order to calibrate volatility surfaces, from which all derivatives volatility analytics displayed in the BTC Options and ETH Options sections of this report are calculated. Volatility smiles are constructed by calibrating to mid-market prices observed in Bybit options markets. As part of the calibration process, prices go through rigorous filtration and cleaning steps, which ensures that the resulting volatility surface is arbitrage-free and has exceptional fit to the market observables.

.jpg)
.jpg)