Thahbib Rahman
Research Analyst
Risk-on sentiment in both US equities and bond markets has vanished over the past week. US equities fell lower after an extended holiday, amidst a global bond market rout that has seen long-dated bond yields across G7 nations soar to record highs. BTC’s spot price has mostly declined after Federal Reserve Chair Jerome Powell’s Jackson Hole speech, reaching a local bottom of $107K earlier last week, while ETH’s spot price is down 5% over the past seven days. Some altcoins have, however, fared stronger, with SOL a particular case in point.

Risk-on sentiment in both US equities and bond markets has vanished over the past week. US equities fell lower after an extended holiday, amidst a global bond market rout that has seen long-dated bond yields across G7 nations soar to record highs. BTC’s spot price has mostly declined after Federal Reserve Chair Jerome Powell’s Jackson Hole speech, reaching a local bottom of $107K earlier last week, while ETH’s spot price is down 5% over the past seven days. Some altcoins have, however, fared stronger, with SOL a particular case in point.
Sentiment in derivatives markets is mixed: funding rates remain positive across most assets, while options markets are assigning a significant premium toward OTM puts for BTC and ETH. Implied volatility levels have increased over the past week, too, perhaps a reflection of markets expecting volatility in the weeks ahead. There’s no shortage of events to provide that volatility: the upcoming two weeks will see an NFP report, a CPI report and the Fed’s September meeting, with market-implied odds currently at 97% in favor of a rate cut.
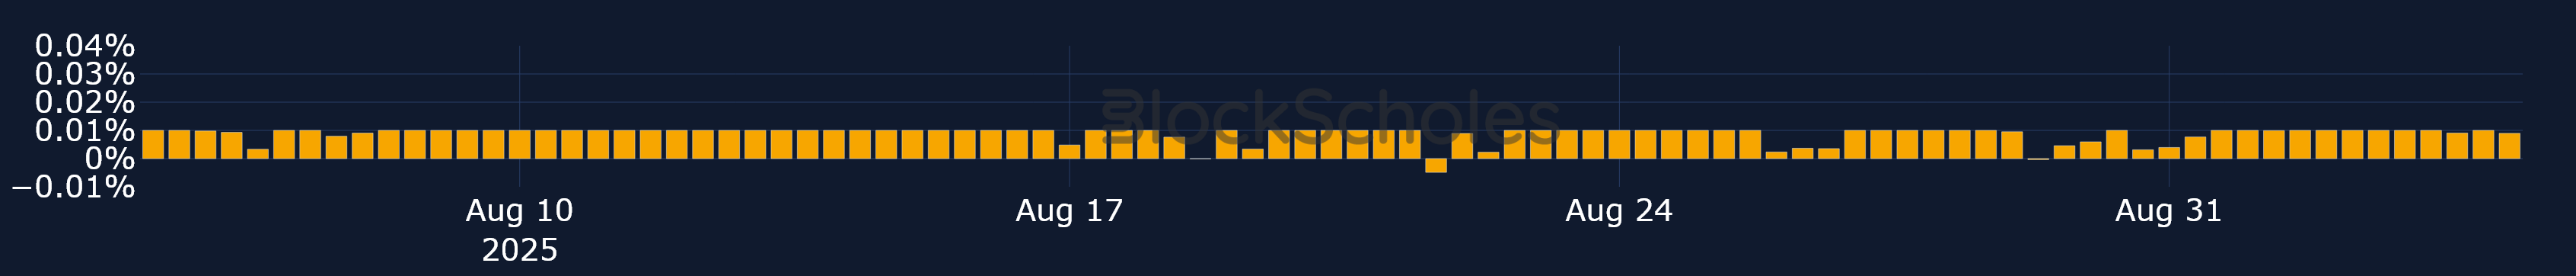
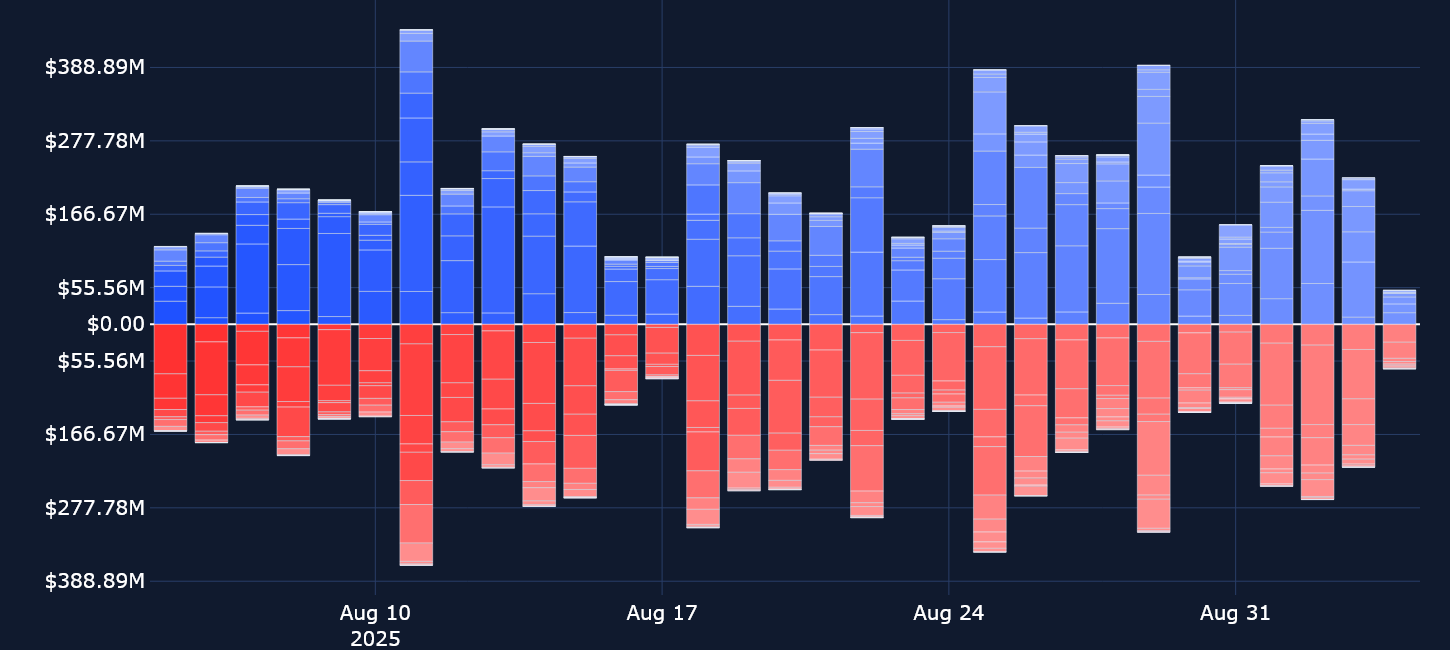
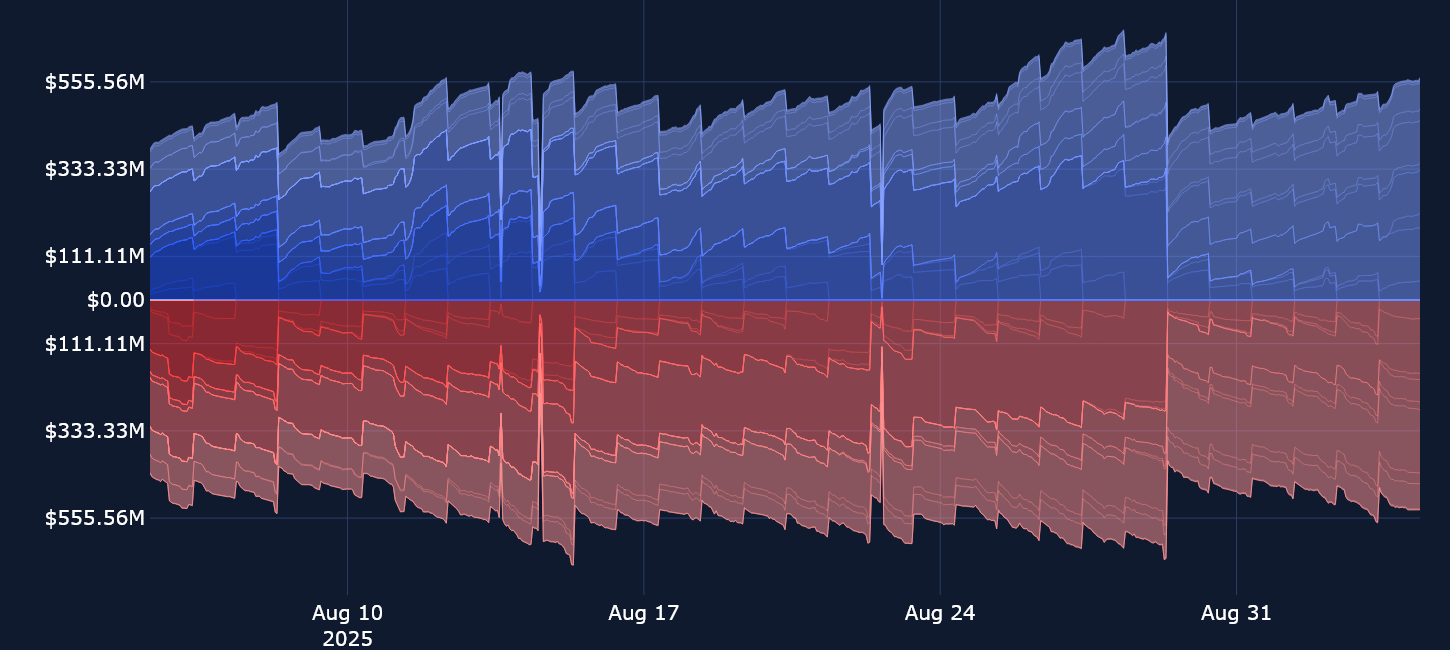
Perpetuals: Open interest in perpetuals has been flat at $15B, while funding rates for BTC have maintained a nearly straight run of positive values over most of August and into September.
Options: Positioning in options markets is more bearish, as skew is tilted toward puts for both BTC and ETH. While ETH initially had resisted that pessimistic sentiment, skew is now catching up to levels seen for BTC.
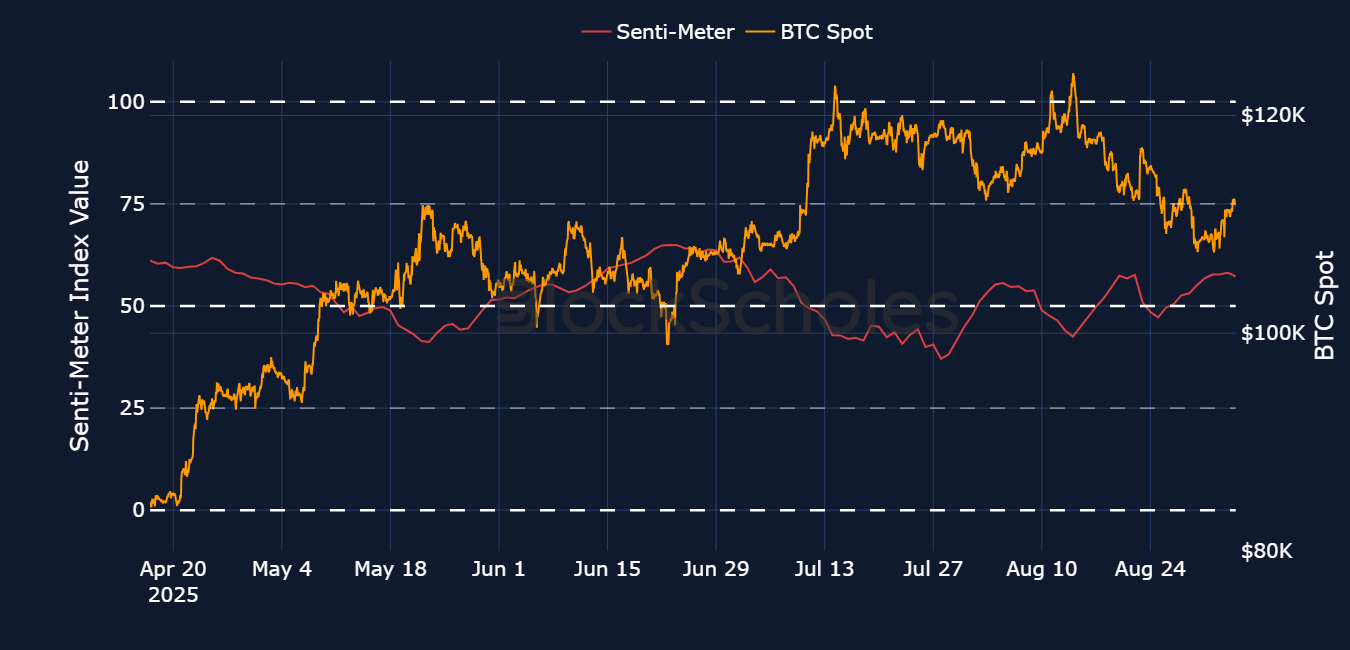

Block Scholes’s Senti-Meter Index aggregates the funding rate, future-implied yield and volatility smile skew into a single expression of sentiment in derivatives markets. See more in the methodology article here.
On Aug 28, 2025, both Chainlink’s native LINK token and Pyth Network’s PYTH token surged higher to outperform the rest of the crypto market. The US Department of Commerce announced that it had begun distributing macroeconomic data on public blockchains via the use of Chainlink and Pyth’s decentralized oracle networks, which are designed to bring real-world data on-chain. Chainlink announced that macro data (including GDP and PCE inflation) will be delivered on-chain to ten different blockchains.
Separately, Pyth Network announced that, through its collaboration with the Department of Commerce, it will “initially offer quarterly releases of the GDP going back 5 years, and Pyth Contributors anticipate expanding this initiative to support a broader range of economic datasets.”
While LINK’s token surged from just under $24 to $25.80, a 7.7% gain within an hour of the announcement, the PYTH token made a significantly stronger move. It initially rose from $0.12 to $0.18, a surge of over 50% in under an hour, markedly outperforming LINK’s gains. However, while LINK sold off following its rally (along with the rest of the crypto market), PYTH continued to trade higher, eventually touching $0.24 — a gain of over 100%. The move also sparked a short rally across other oracle network tokens that weren’t in collaboration with the US government, such as UMA and XYO, although that rally quickly fizzled out.
Despite the moves in spot price, funding rates didn’t show much exuberance. Funding rates for LINK remained unchanged at 0.01% through the rally, and for PYTH, funding rates actually turned negative (as low as −0.017%), suggesting that traders may have believed the rally in the token had become overstretched.

SOL spot outperformance — Over the past month, SOL has taken a lead against ETH (which we previously noted as highly outperforming BTC). Bitcoin has delivered negative returns over the past month at around −2.7%.

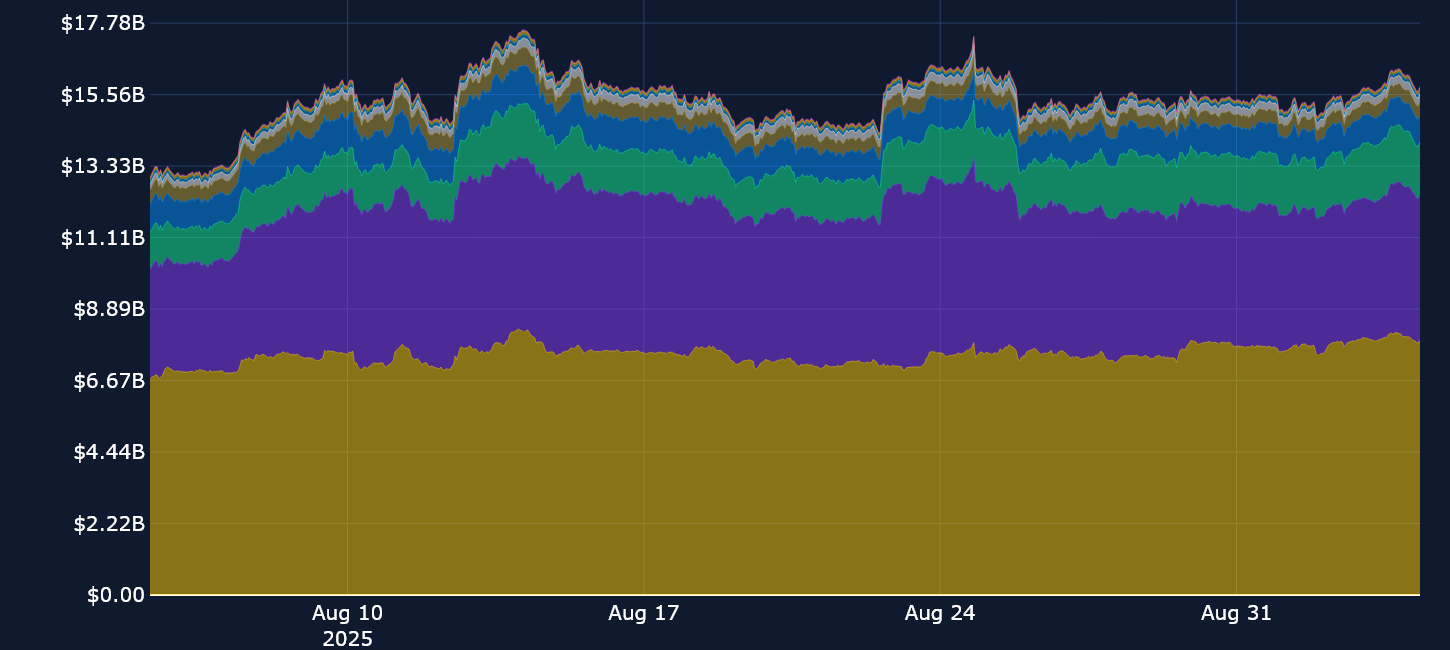
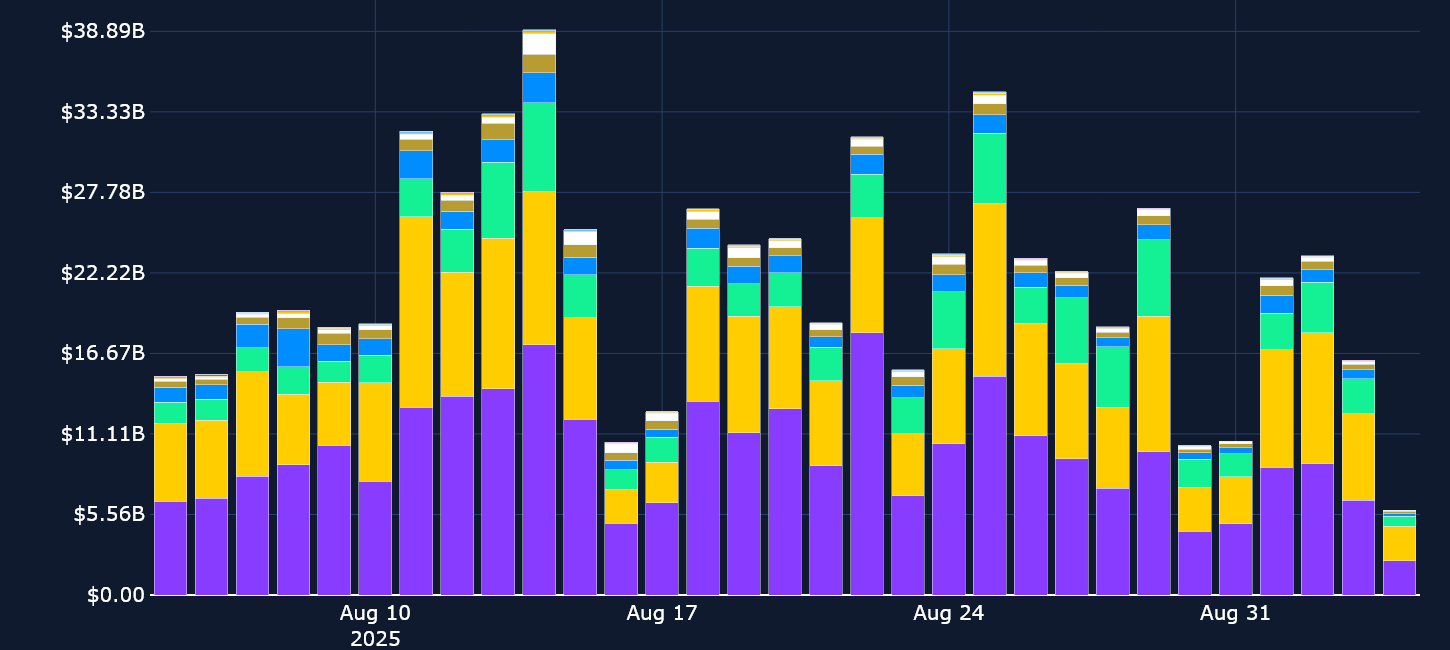
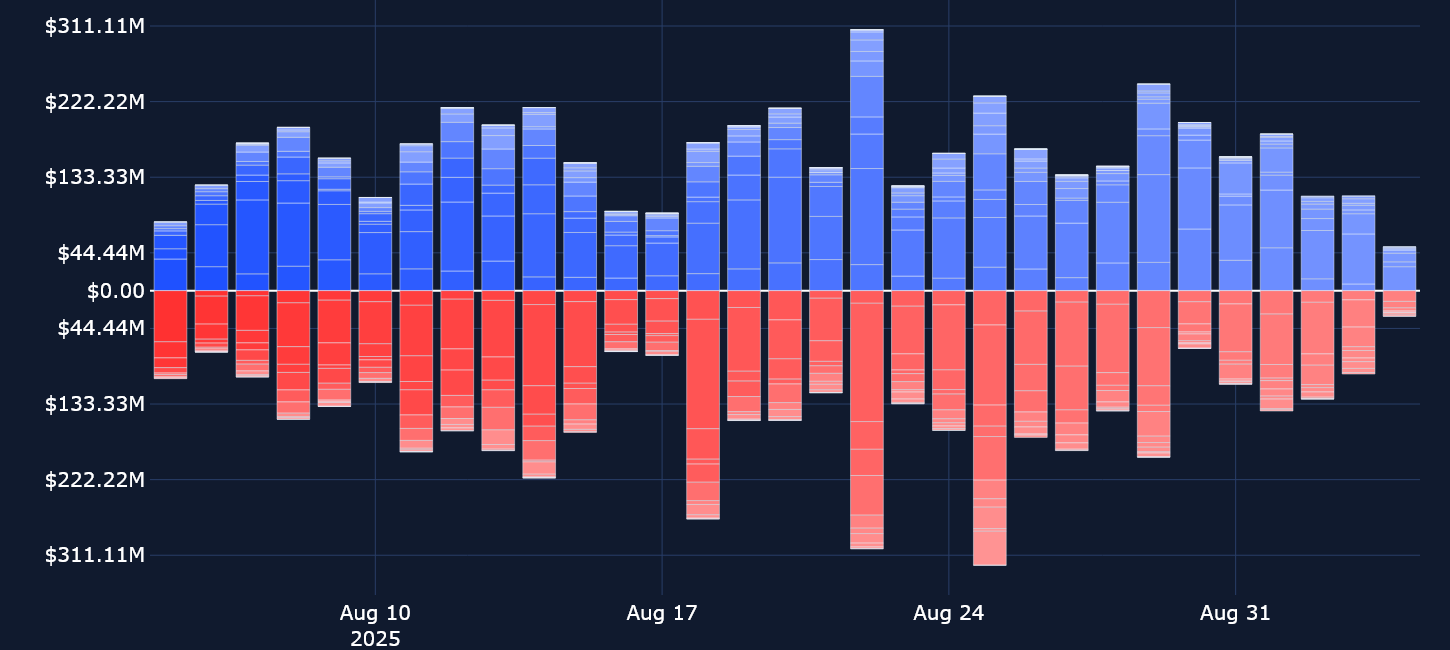
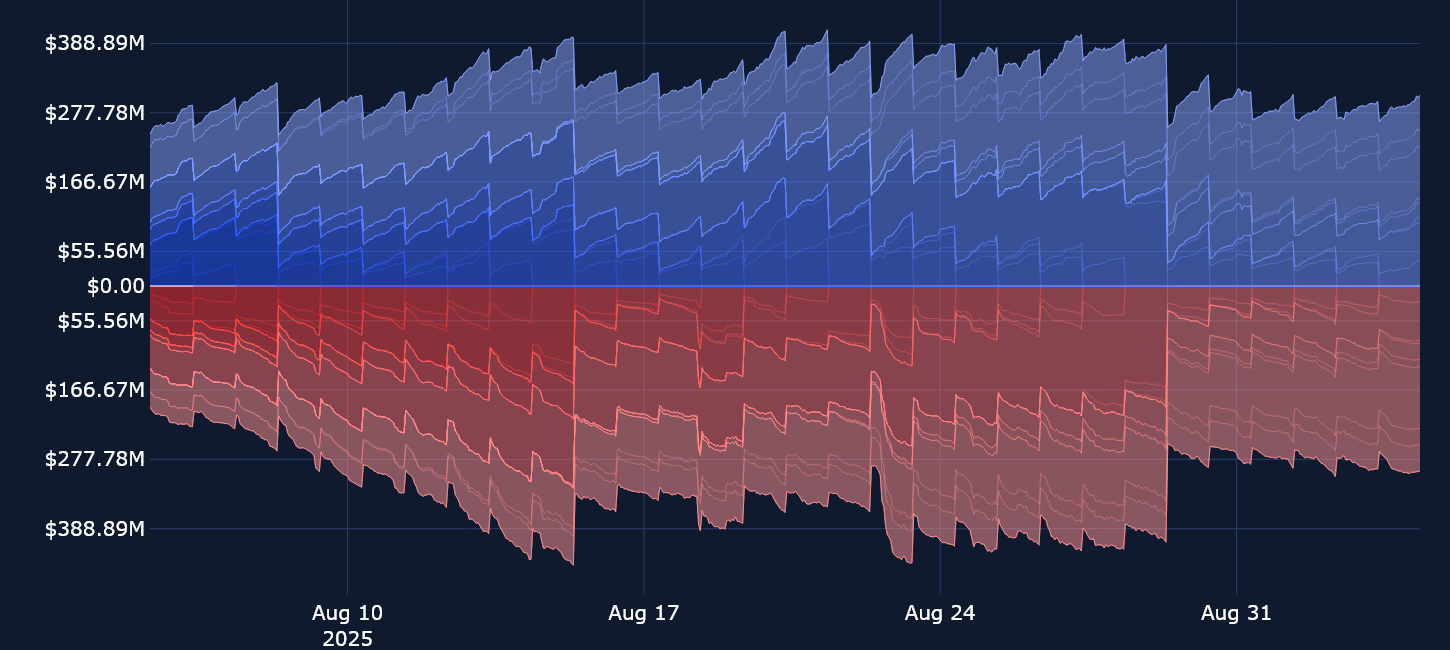
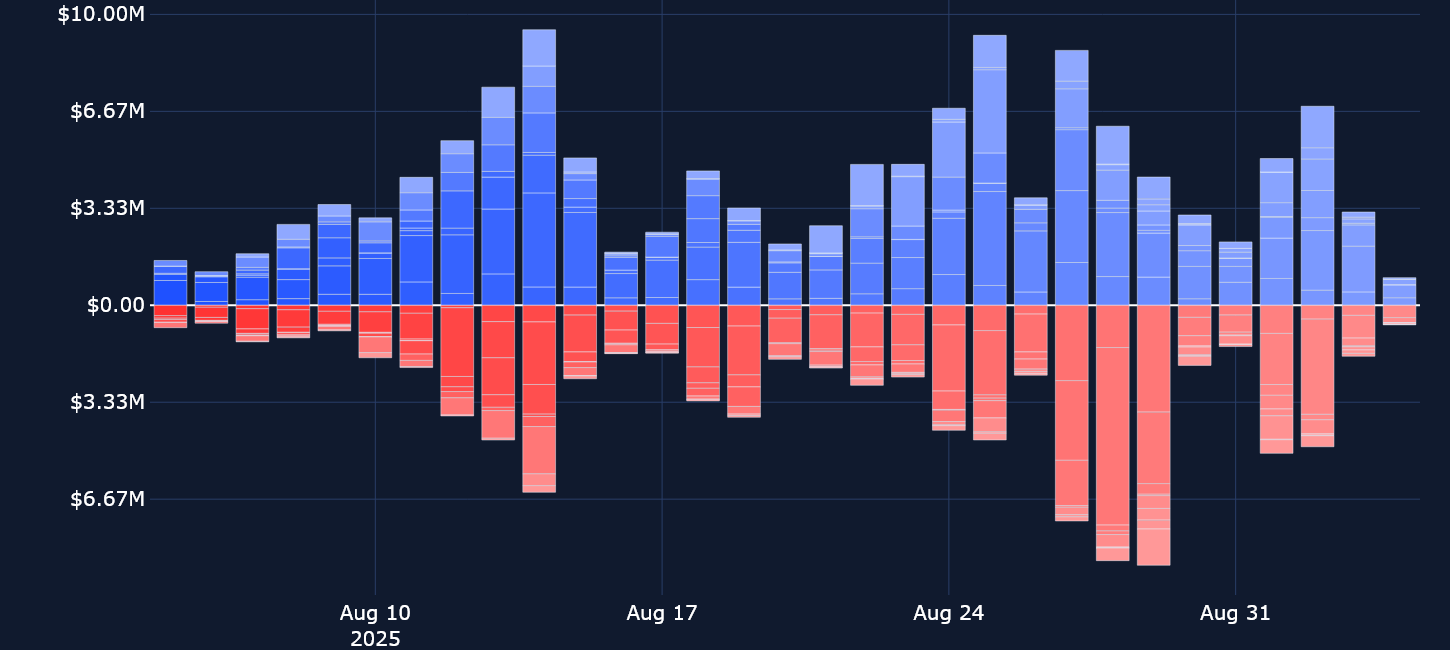
Unlike previous weeks, which have been marked by record highs in open interest, perpetual OI has been flat at $15B. This is perhaps a reflection of uncertainty in the macro environment — and an indication that traders are unwilling to make any outsized bets. Positioning in perpetual swap funding rates is backing that theory — they remain below 0.01% across most tokens, suggesting neutral positioning. Indeed, traditional financial markets have begun the month of September on a sour note, with US equities falling lower and government bond yields across major world economies soaring higher.
Trade volumes in perpetual futures contracts have also been subdued, similar to the unmoved open interest in perp contracts. Daily trade volumes are currently more than $15B below their August highs, when BTC rallied to an ATH of $123K.
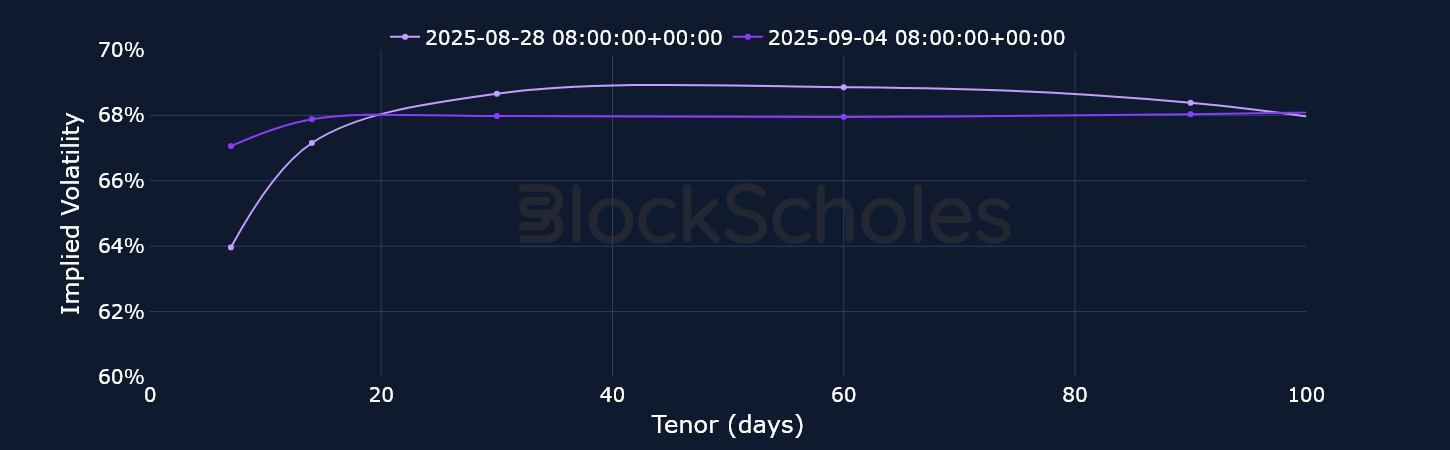
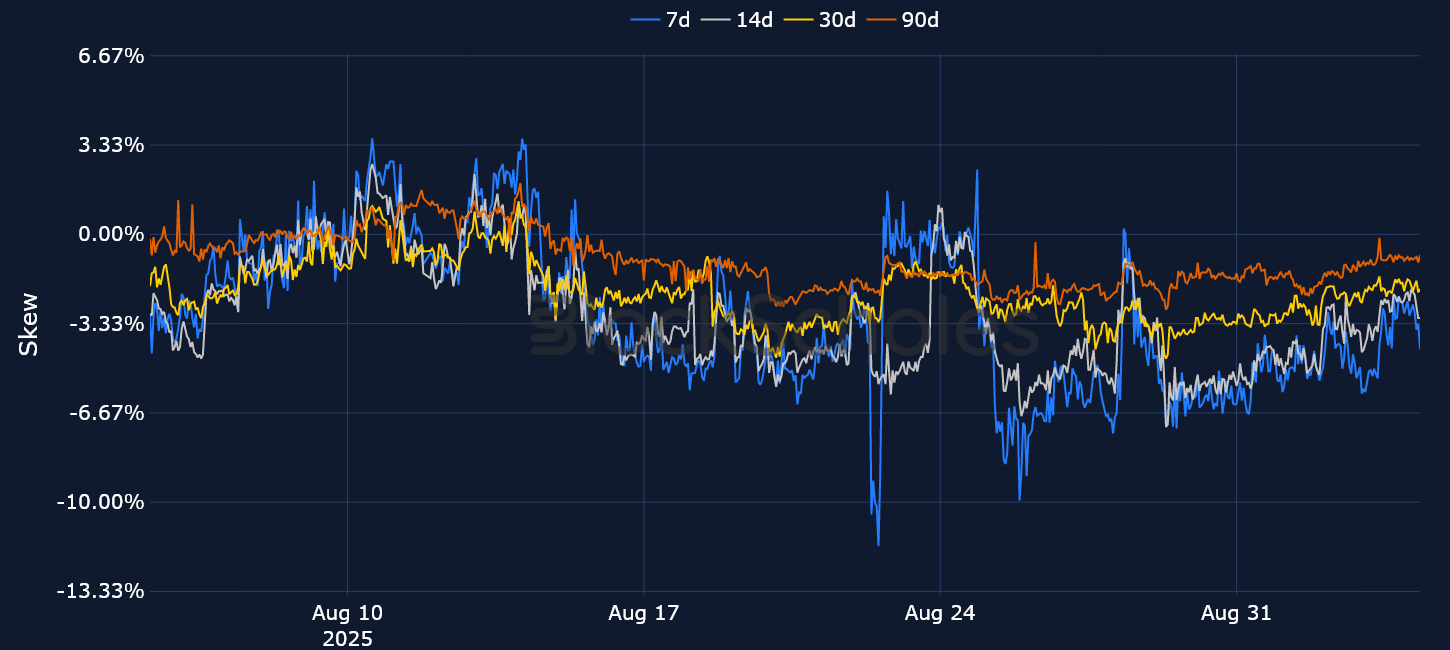
BTC funding rates have maintained a nearly perfect record of positive values through most of August and into September, though they’re not showing signs of any overwhelmingly bearish or bullish sentiment. This is in stark contrast to positioning in options markets, where the 25-delta put-call skew for 7-day BTC options is currently trading close to −4.3%.
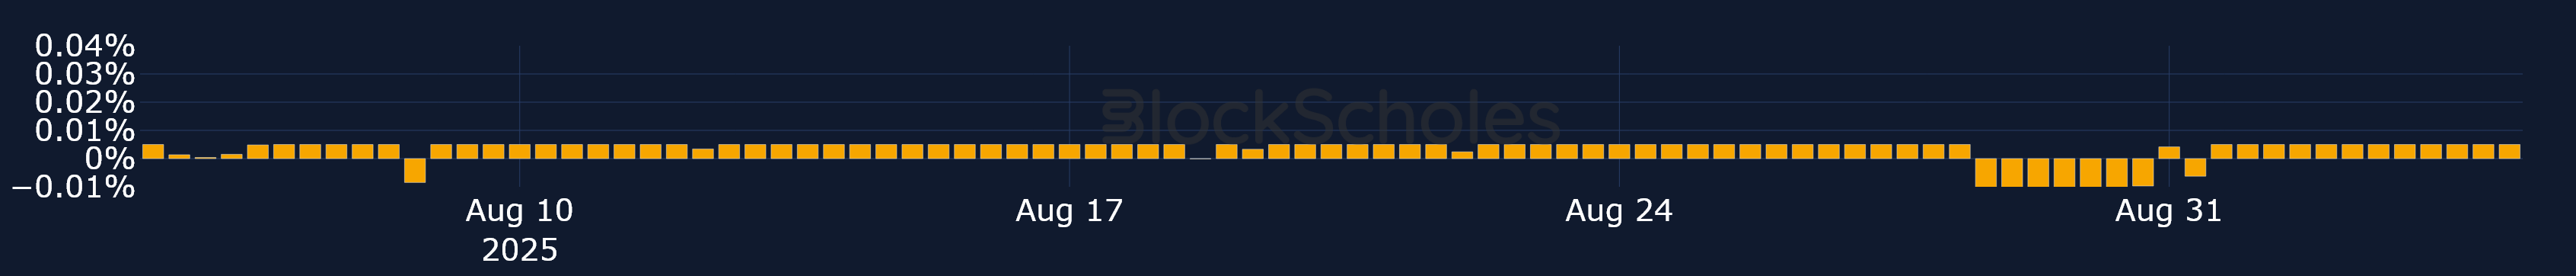
ETH funding rates have been positive in September, though they’ve shown signs of some shakiness relative to the BTC instrument in the aftermath of ETH’s spot price reaching a record high. Following its ATH on Aug 24, 2025, ETH sold off sharply as traders took profits. That move saw its spot price drop from $4,900 to $4,300, a level around which ETH has since consolidated. This drop in spot price was followed by a temporary decline to negative funding rates as traders braced for further downside. However, since the drop in price to $4,300, ETH has mainly been trading sideways, and funding rates shortly returned to positive levels.
Interestingly, despite ETH’s break to record highs in August (levels that it had last seen back in November 2021), funding rates have failed to break past 0.02%.
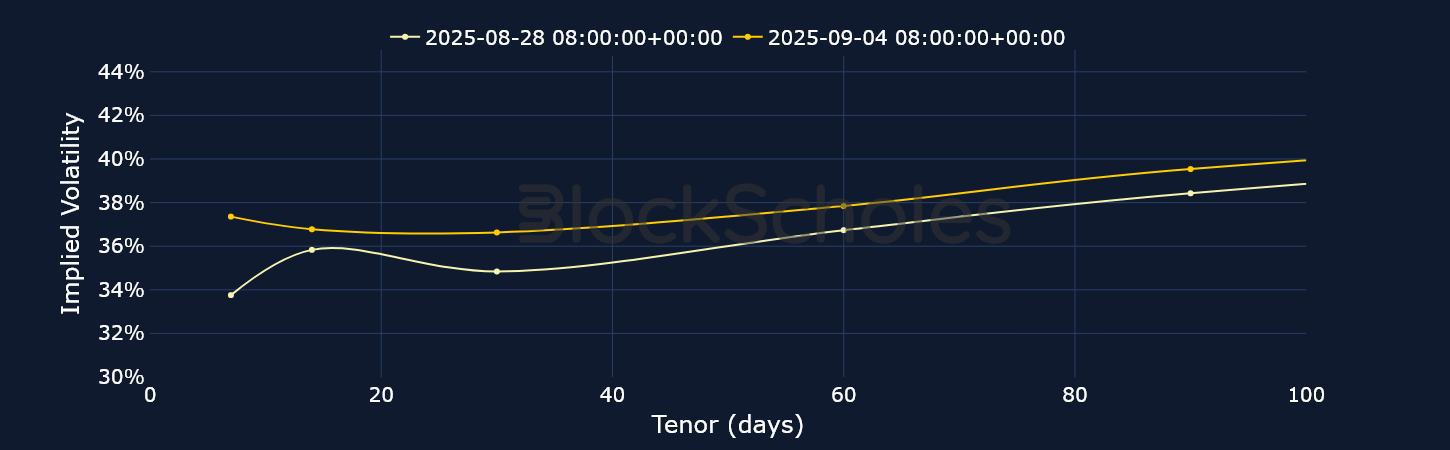
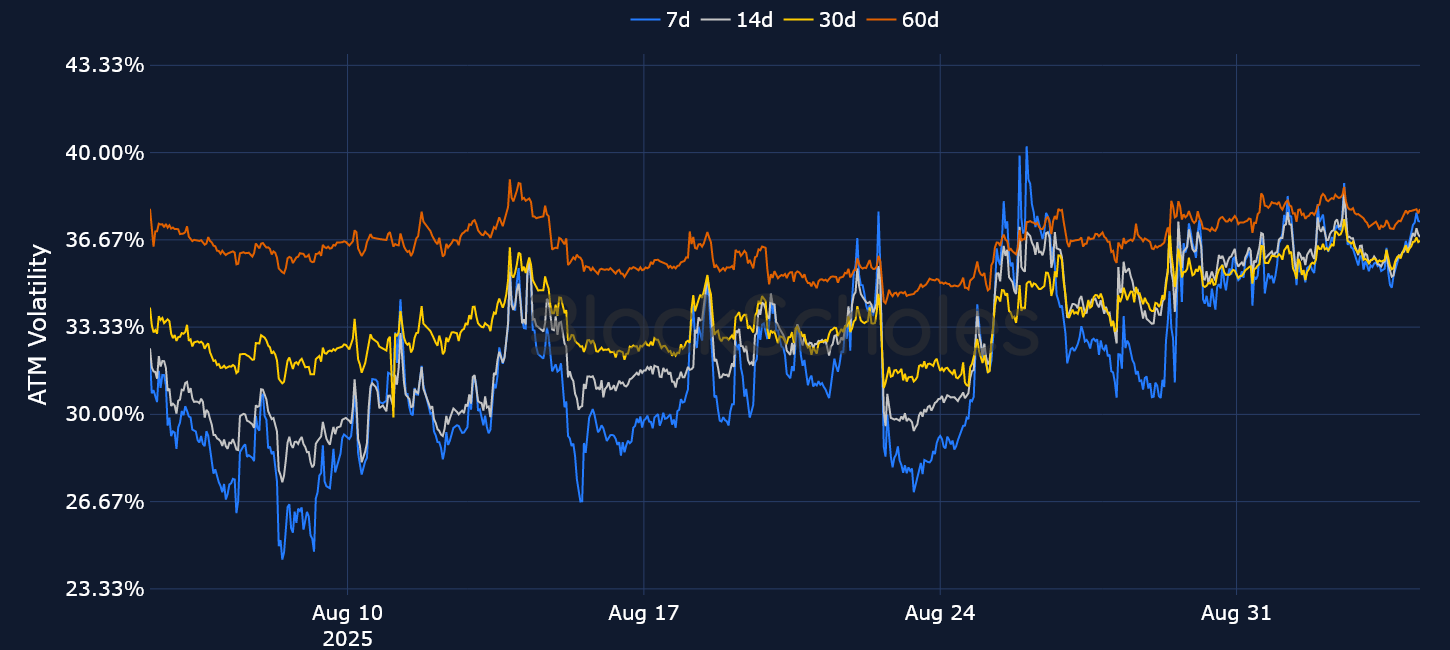
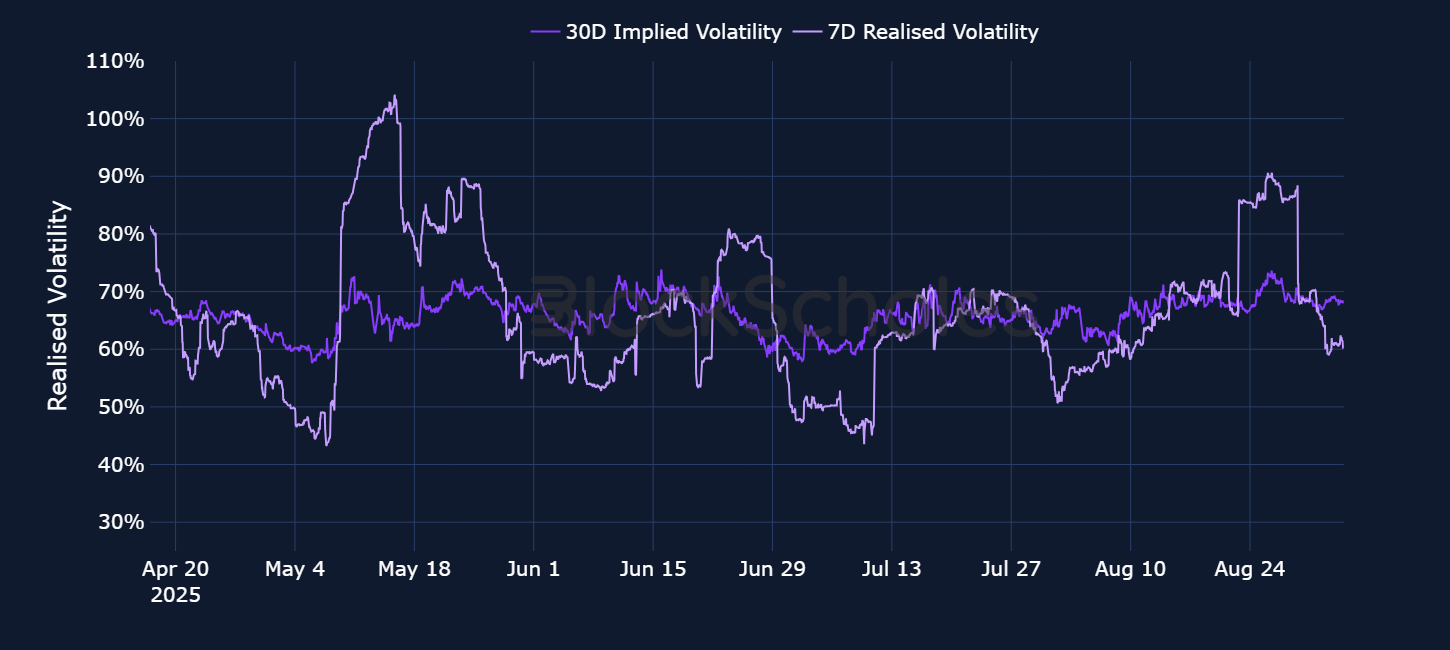
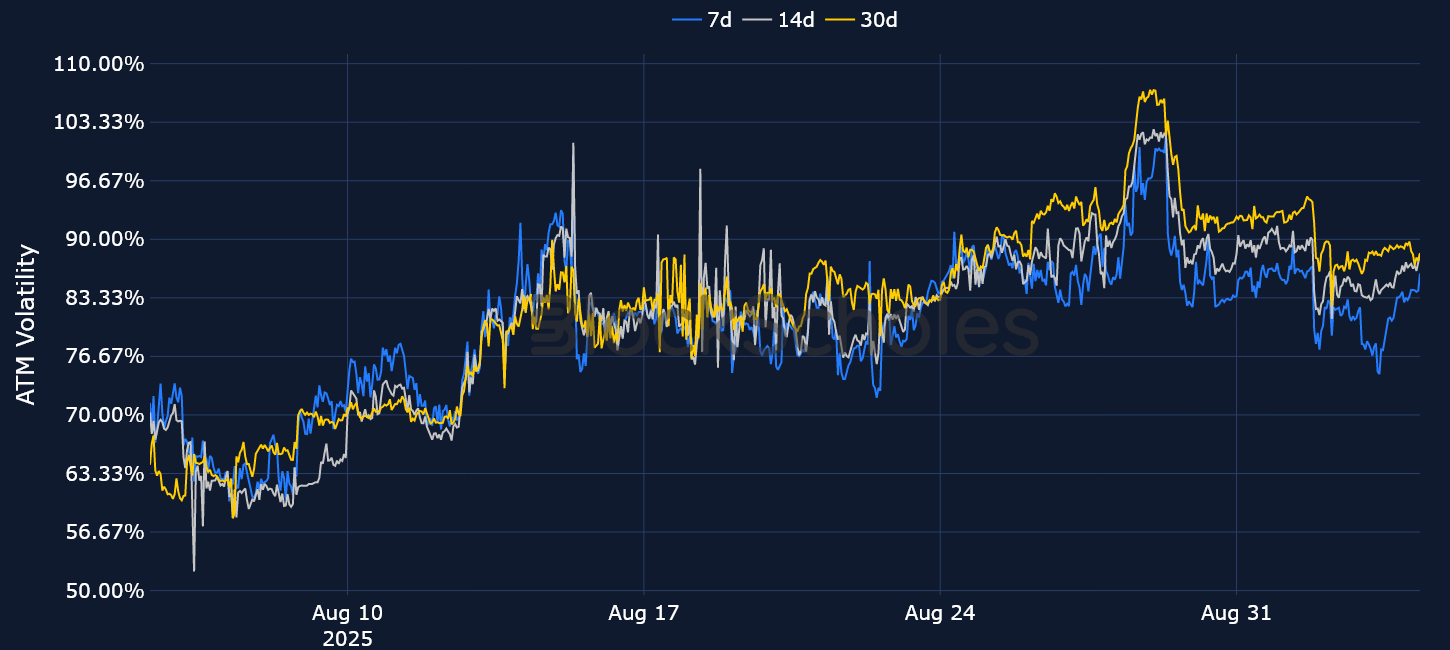
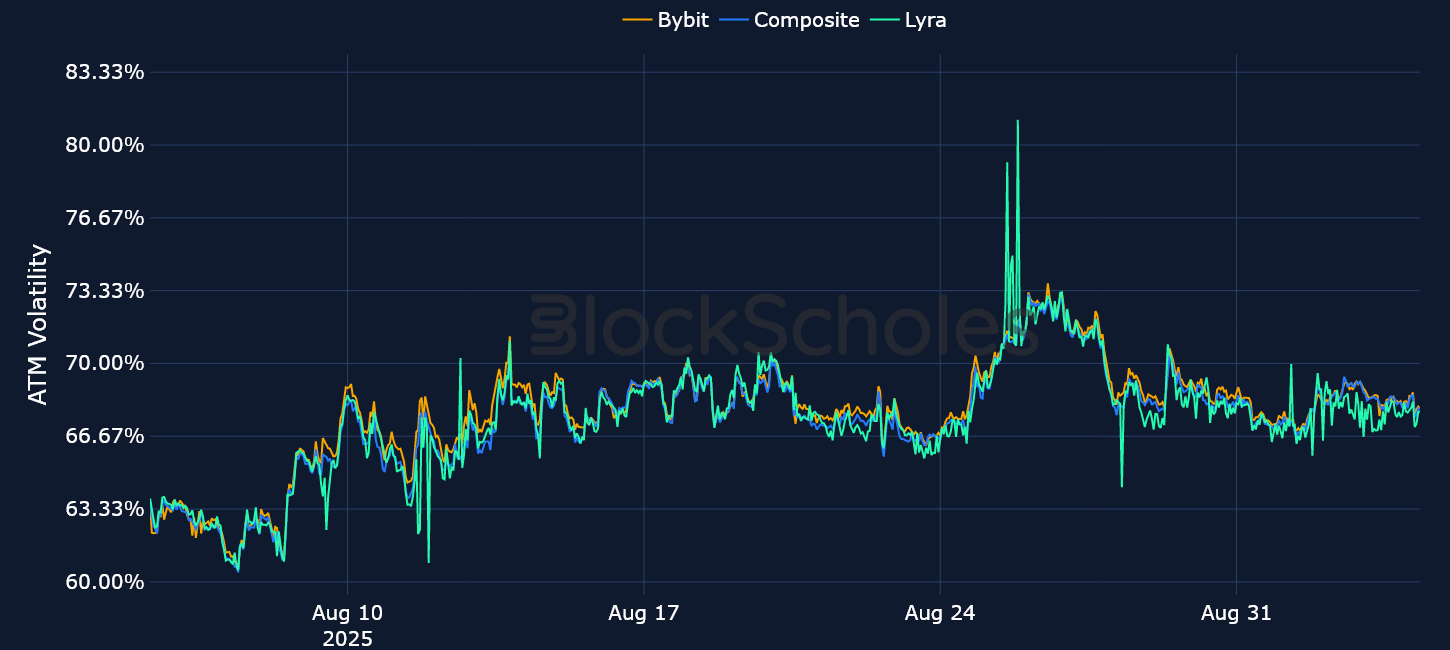
Since Chair Powell’s Jackson Hole speech, we’ve seen a number of developments in BTC volatility. Initially following his speech, ATM IV levels dropped to 27% — a sign that markets had priced in some volatility ahead of his keynote speech, which was resolved shortly after. Volatility levels then creeped higher, peaking at 40% on Aug 26, 2025, as BTC’s spot price began to sell off from its post–Jackson Hole highs of $117K. Now, short-tenor (7- and 14-day options) at-the-money implied volatility levels are trading at 36%, in line with a move higher in realized volatility. The increase in 14-day IV suggests that, once more, markets are pricing in some volatility ahead of the FOMC’s September 17 meeting, despite market-implied odds currently sitting at 97% in favor of a 25 bps rate cut.
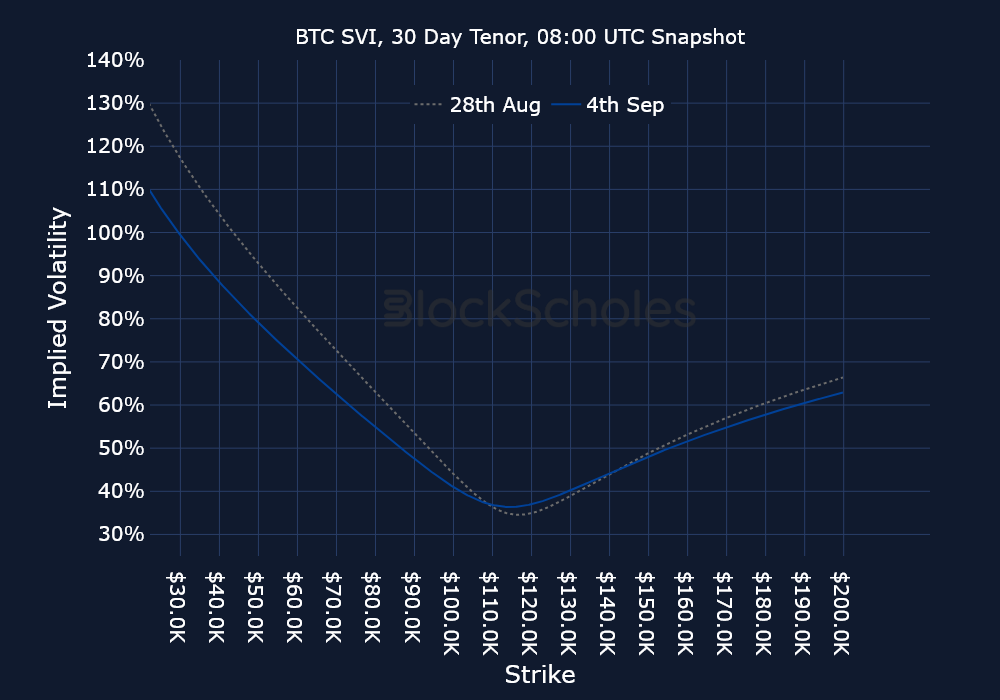
With BTC currently trading 10.1% below its ATH, we continue to see bearish positioning in options markets. The skew toward OTM puts predated Powell’s Jackson Hole speech, but was amplified by the sell-off from $117K to $107K after the event, and for most of the past week and a half, BTC skew has been more bearish than positioning in ETH options.
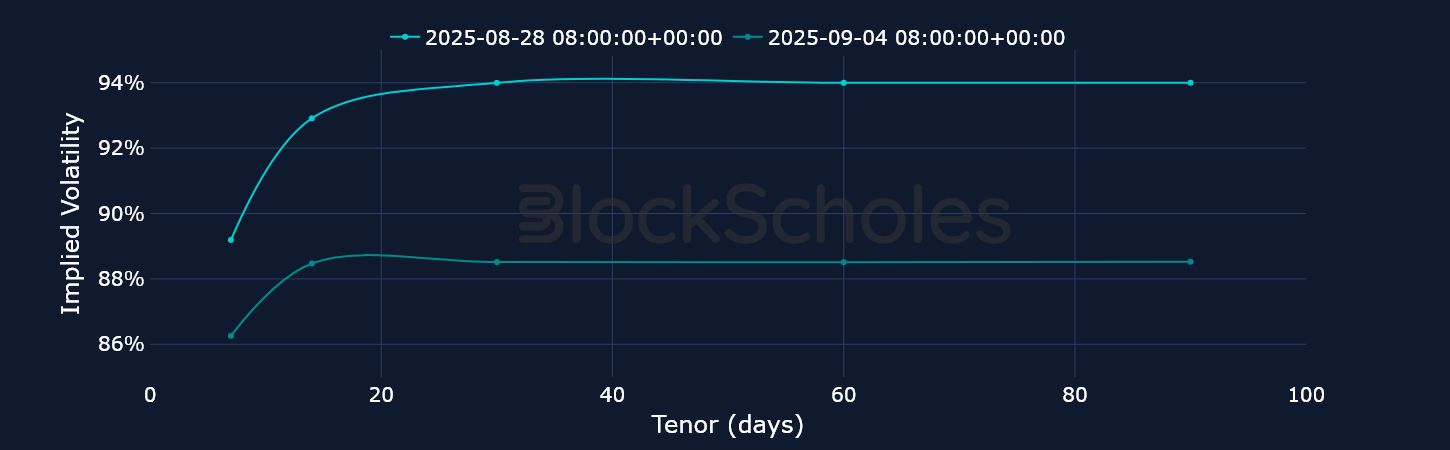
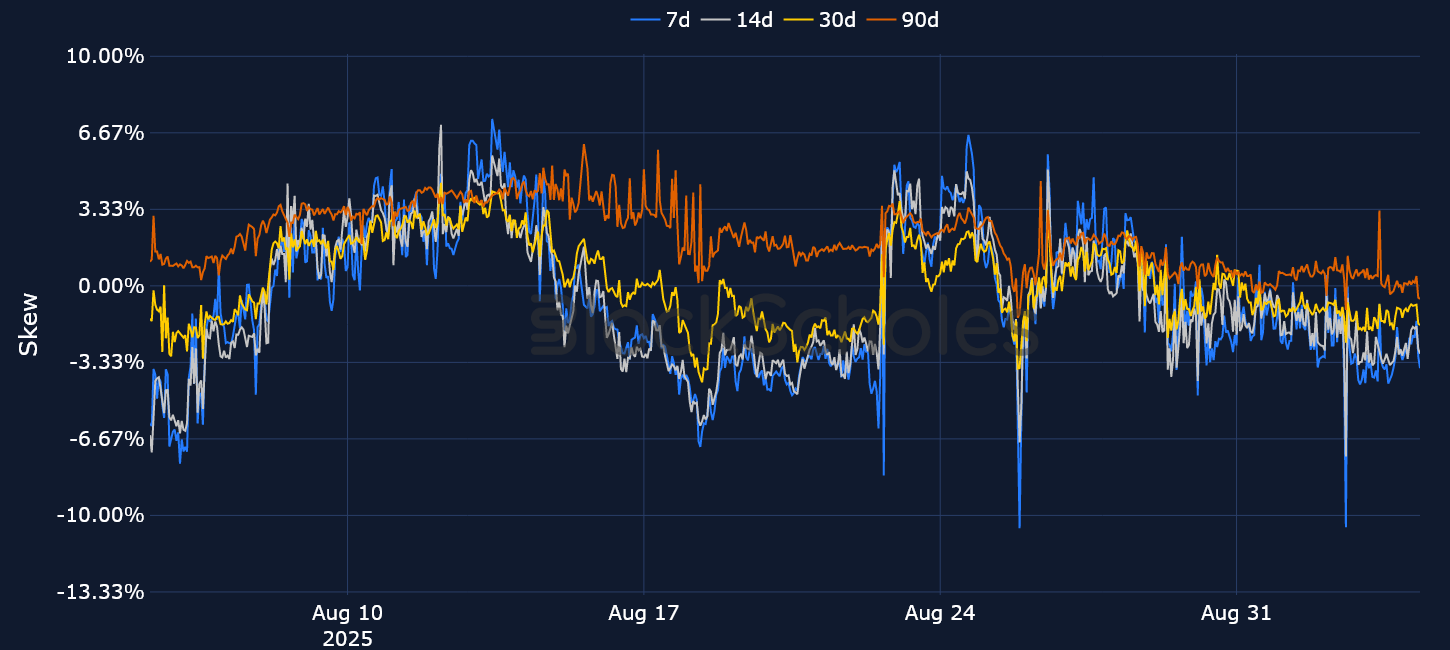
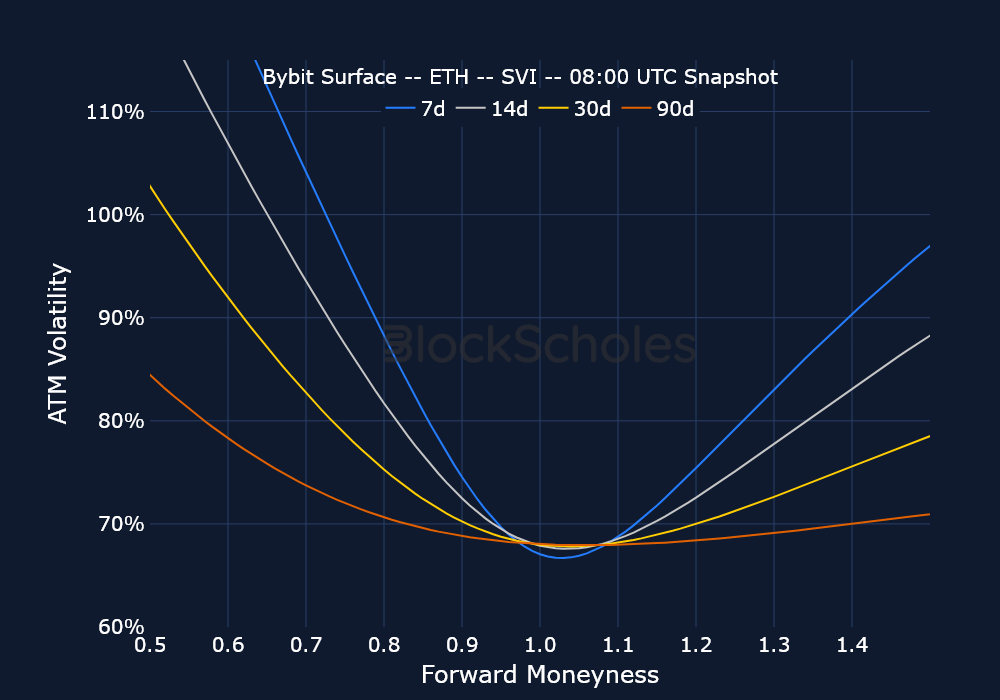
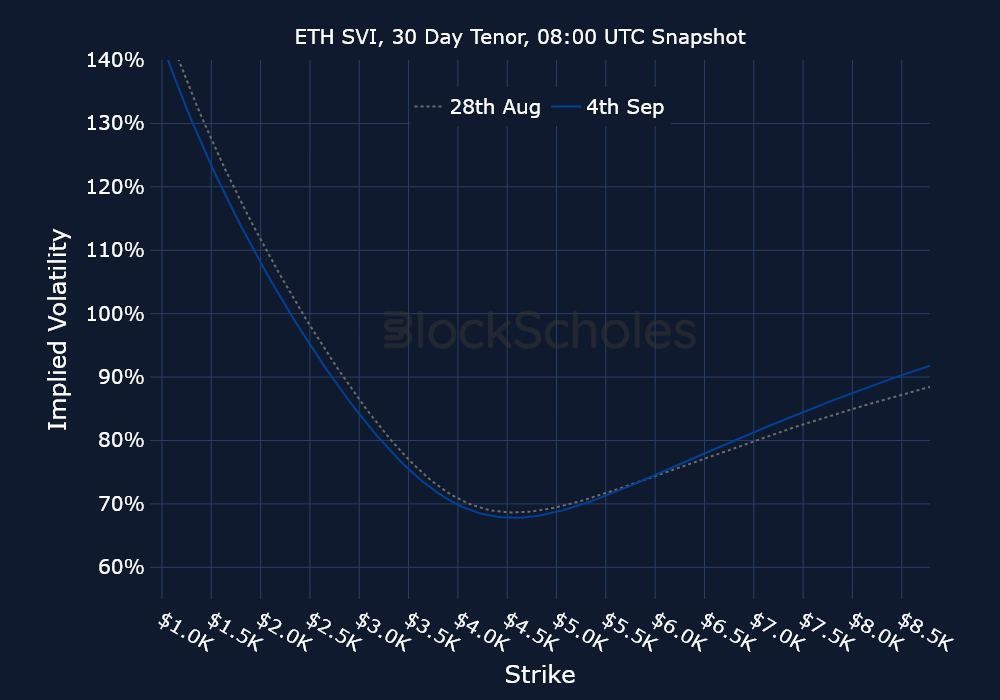
August began on a high for ETH, registering a recent high of $4,946 on Aug 24, 2025. Since then, however, ETH’s spot price has retreated. While the initial move down was aggressive (from $4,900 to $4,300), its spot price has since consolidated within a band of $4,200 to $4,400. Interestingly, ETH options markets have held up far stronger than BTC’s since Jackson Hole. ETH skew was tilted toward OTM call options for a few days following the speech, and over the past week, ETH options have carried a smaller premium toward OTM puts than that seen in BTC markets. However, this divergence from BTC is now showing signs of diminishing.
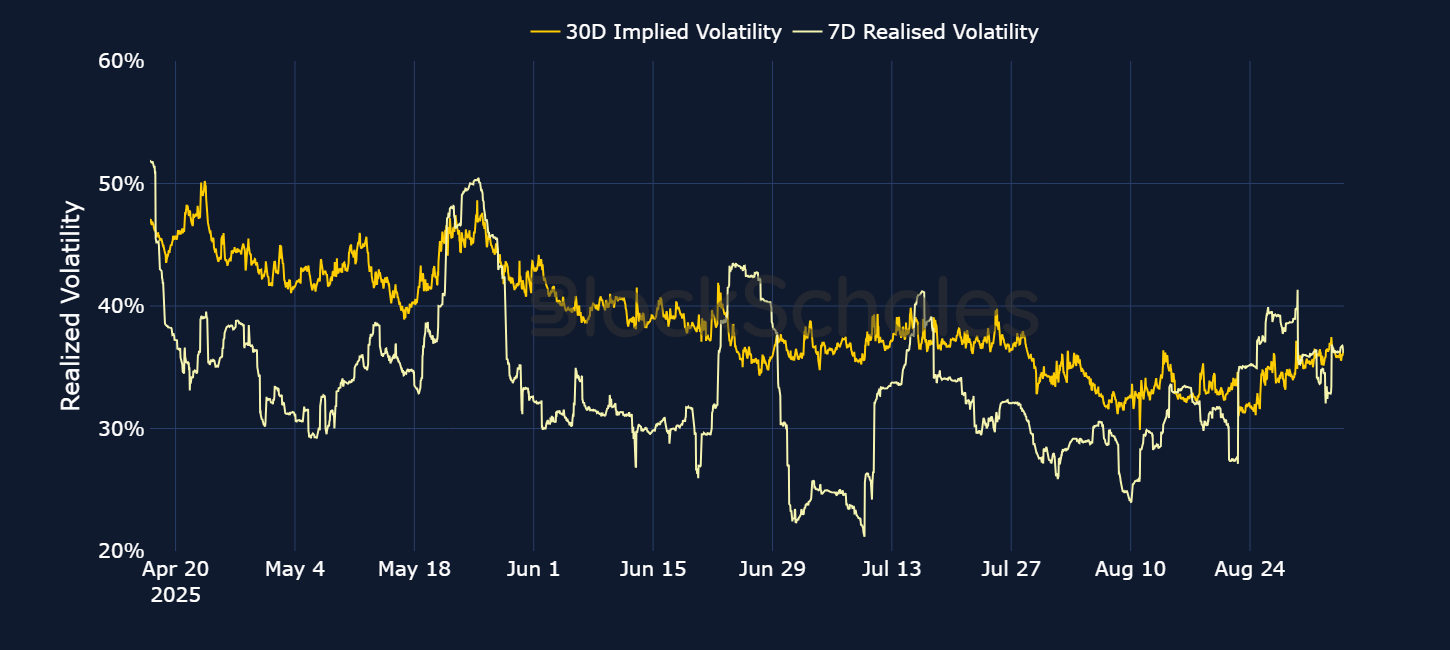
Realized volatility has collapsed since Aug 26, 2025, falling from over 90% to 61%, marking a divergence from the increase in at-the-money IV levels across the term structure over the same period of time. Ethereum Spot ETF purchases have also slowed down recently, with the past two trading days characterized by net selling from institutional and retail investors alike.

The notional size of call contracts for SOL hasn’t nearly recovered since the Aug 29, 2025 expiration, as open interest has dropped more than 50% from $40M to below $20M. However, calls continue to dominate in both volumes and open interest. Among the three majors (BTC, ETH and SOL), SOL held up the best over the past week. However, a drop in its spot price yesterday brings its weekly performance in line with the rest of the majors. It is down 2%, compared to a 5% drop in Ether and a 2% drop in BTC.
SOL was bolstered by recent news last week that three crypto firms — Galaxy Digital, Multicoin Capital and Jump Crypto — are in talks to raise $1B to accumulate Solana, which would form the largest treasury reserve dedicated to the token yet. Unlike BTC and ETH, which now have digital asset treasuries buying significant portions of their supplies, SOL has yet to find a single company buying on similar scales relative to its token’s supply.


BTC and ETH options have both seen a notable frenzy of put buying, particularly in short-dated options. This has had a clear impact on volatility smiles for both assets, as OTM puts trade with a far higher implied volatility than call options — suggesting that traders are expecting more risk-off sentiment and bearishness in the coming few weeks. Initially, ETH traders resisted bidding up put option IV at the same time as BTC’s, which meant the bearish sentiment in BTC wasn’t apparent in ETH — or was at least less pessimistic. However, over the past day, ETH skew has caught up with BTC 25-delta skew, which is currently trading at −4.29%.
However, sentiment in options markets is in contrast to that of perpetual swaps. Both BTC and ETH funding rates have remained positive over the past week, suggesting some of the bearishness in put options may be a reflection of traders hedging positions. In any case, the market has a number of volatile events to prepare for in the weeks ahead: NFP, CPI and the Fed’s September meeting.

Open interest and trading volume data are sourced “as is” from the Bybit exchange platform API exclusively, and as such do not represent a comprehensive picture of the sum of trading activity across all derivatives markets or exchanges. The data visualized in this report consists of hourly and daily snapshots, recorded over the previous 30 days. Daily (hourly) snapshots of trade volume record the total sum of the notional value of trades recorded in the 24H (1 hour) period, beginning with the snapshot timestamp.
If not explicitly labeled as derived from another exchange, the input instrument prices to all derivatives analytics metrics in this report are sourced from the appropriate endpoints of Bybit’s public exchange platform API. In the event that data is labeled or referred to as representing the market on another exchange source, that data is sourced from the appropriate endpoint of each respective exchange’s public API.
Macroeconomic charts and data are sourced “as is” from the Bloomberg Terminal. Exchange data is sourced “as is” from publicly available exchange APIs. Block Scholes makes no claims about the veracity of public third-party data.
After acquisition of underlying-denominated raw data for open interest and trading volume on the Bybit exchange platform from Bybit’s API endpoint, equivalent dollar-denominated figures are calculated using the concurrent value of Block Scholes’s Spot Index for the relevant underlying asset.
Block Scholes’s Spot Index represents the aggregate Spot mid-price for a given currency across the top five CEXs by volume (with USD-quoted markets). It considers the proportion of total volume in the instrument on the exchange, as well as the deviation of a data point from those on other exchanges.
Futures prices are used for Block Scholes’s futures-implied yields calculation services in order to derive the constant-tenor annualized yields displayed in the Futures section of this report.
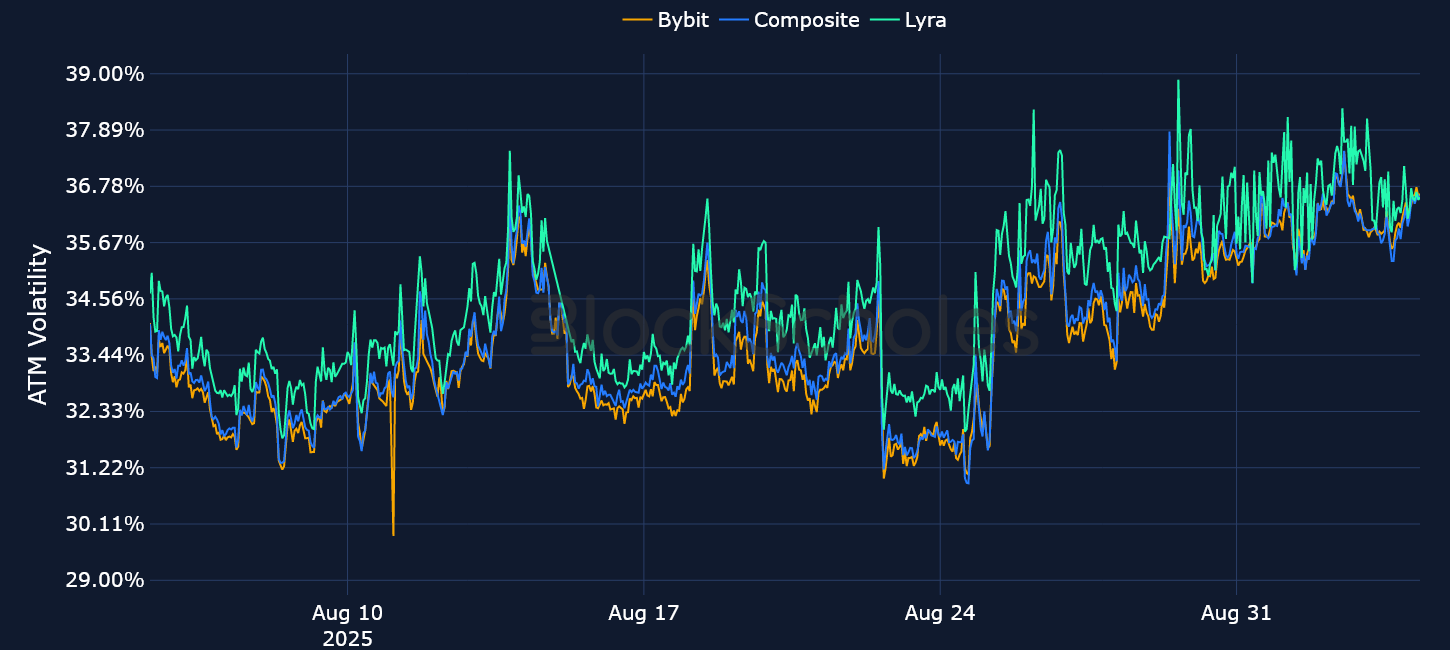
Options prices are used for Block Scholes’s implied volatility calculation services in order to calibrate volatility surfaces, from which all derivatives volatility analytics displayed in the BTC Options and ETH Options sections of this report are calculated. Volatility smiles are constructed by calibrating to mid-market prices observed in Bybit options markets. As part of the calibration process, prices go through rigorous filtration and cleaning steps, which ensures that the resulting volatility surface is arbitrage-free and has exceptional fit to the market observables.


.jpg)
.jpg)