Thahbib Rahman
Research Analyst
Chair Jerome Powell of the Federal Reserve delivered his highly anticipated Jackson Hole speech on Aug 22, 2025. In it, he caught markets offside with a more-dovish-than-expected signal that the Fed is preparing to cut interest rates as soon as September. The Fed’s shifting policy stance has become apparent in BTC’s reaction function to various macroeconomic data releases — and, in fact, slightly predates the pivot from Powell.

Chair Jerome Powell of the Federal Reserve delivered his highly anticipated Jackson Hole speech on Aug 22, 2025. In it, he caught markets offside with a more-dovish-than-expected signal that the Fed is preparing to cut interest rates as soon as September.
The Fed’s dual mandate requires it to maximize full employment and ensure price stability for US consumers. For most of 2025, the Fed has been squarely focused on the latter part of this mandate over fears of tariff-induced inflation, as US President Trump has upended decades of US trade policy. However, in late August, Powell outlined his reasoning for a pivot away from inflation: “GDP growth has slowed notably in the first half of this year,” and “with policy in restrictive territory, the baseline outlook and the shifting balance of risks may warrant adjusting our policy stance.” In other words, according to Powell, signs of weakness in the labor market may be cause for a change in the Fed’s priorities.
The Fed’s shifting policy stance has become apparent in BTC’s reaction function to various macroeconomic data releases — and, in fact, slightly predates the pivot from Powell. We can see this in the reaction of BTC’s spot price in the hours after a key macro data release, moving up or down depending upon whether the economic data is more concerning or less concerning. The chart below plots the relationship between surprises (how much above or below expectations the final number was) in the headline year-on-year CPI figure, a key macro data release, and same-day returns of the S&P 500 index and BTC’s price.
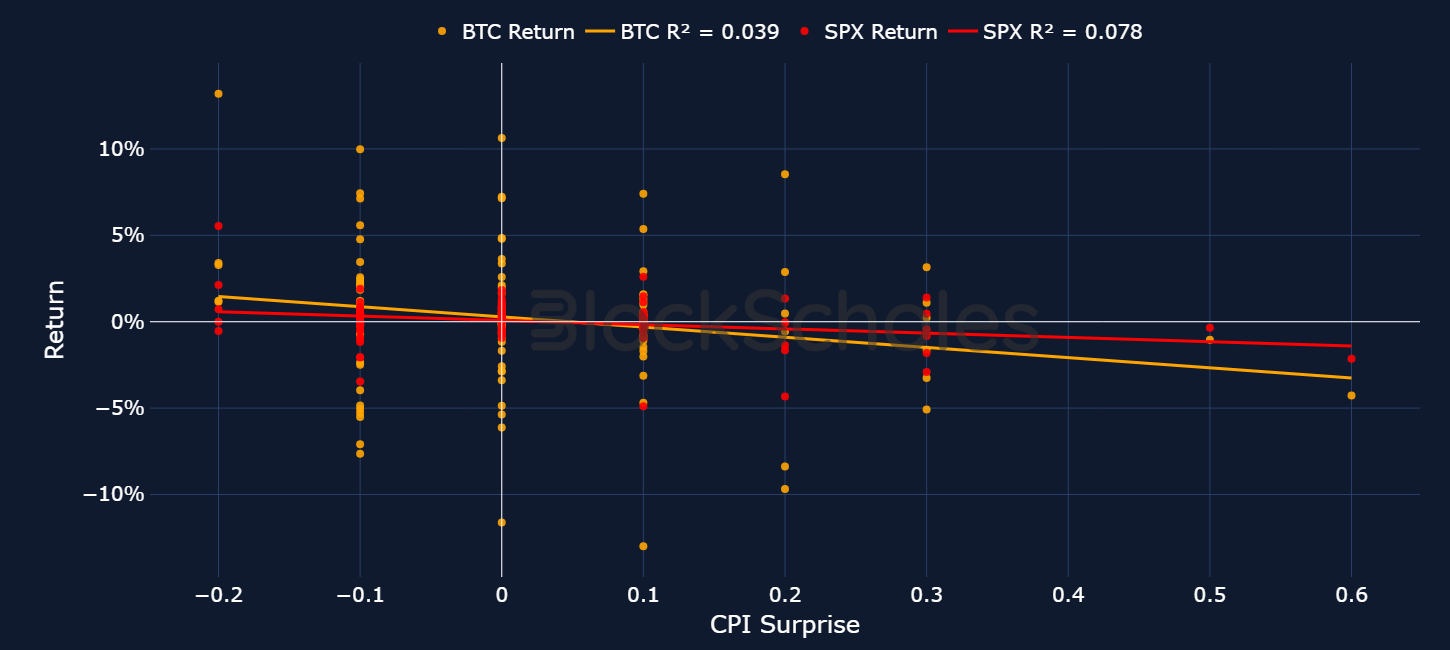
The negative downward slope suggests a correspondingly negative relationship: when CPI surprises to the upside (that is, when the headline figure is higher than expected), BTC’s same-day close price tends to be lower than that of the previous trading day before the release. This partly reflects the fact that a higher-than-expected inflation figure raises the forecast for how long restrictive monetary policy will last, which acts as a headwind for risk-on sentiment (due to tighter financial conditions). The S&P 500 has a less volatile reaction function than BTC does, but a stronger statistical relationship.
This static regression is useful for understanding the relationship between these two variables over the entire period of the collected data. However, it ignores changing market dynamics or regimes. We can capture these changes by performing a regression on a rolling window of 24 months of CPI surprises and their impact on BTC returns over the same day.
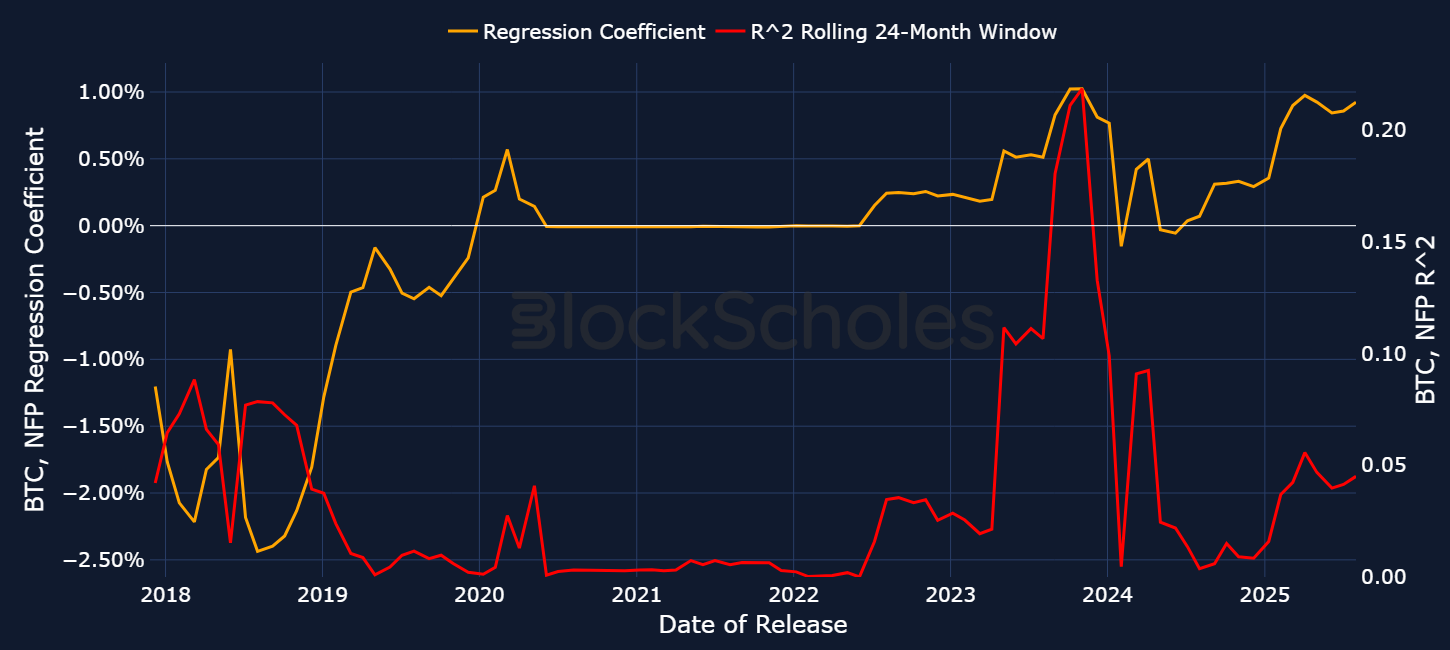
Interestingly, what we find is that BTC is now reacting less to surprises in inflation, and exhibiting a stronger reaction to surprises in another macro data release — employment. Based on the last 24 months of employment releases, a positive surprise of 100,000 jobs on the headline figure would imply an increase in BTC returns by 0.9%.
However, the rolling regression on daily returns does slightly mask the reality of BTC’s reaction function to employment data. In fact, even on hourly data, BTC’s reaction function from the regression is slightly misleading: that’s because BTC tends to exhibit volatile whipsaw movements in the minutes immediately following such announcements — and then a different reaction following the initial move. We showcase this phenomenon in the charts below.
The most recent employment data report has shown that the US economy created only 73,000 jobs in July 2025, far below the consensus of 104,000. Additionally, the prior two months of jobs data were revised down by 260,000, the biggest downward revision since the Covid pandemic.
What immediately stands out is that the surprise weakness in the US economy resulted in a sell-off across risk-on assets: BTC’s price fell from $116K to $113K, while the S&P 500 fell more than 1%. However, we also note that the immediate response from BTC traders was in the opposite direction. In fact, in the first 30 minutes after the release, BTC actually rallied before selling off once US equity markets had opened. Depending upon the time horizon in question, BTC’s response lacks any clear direction.

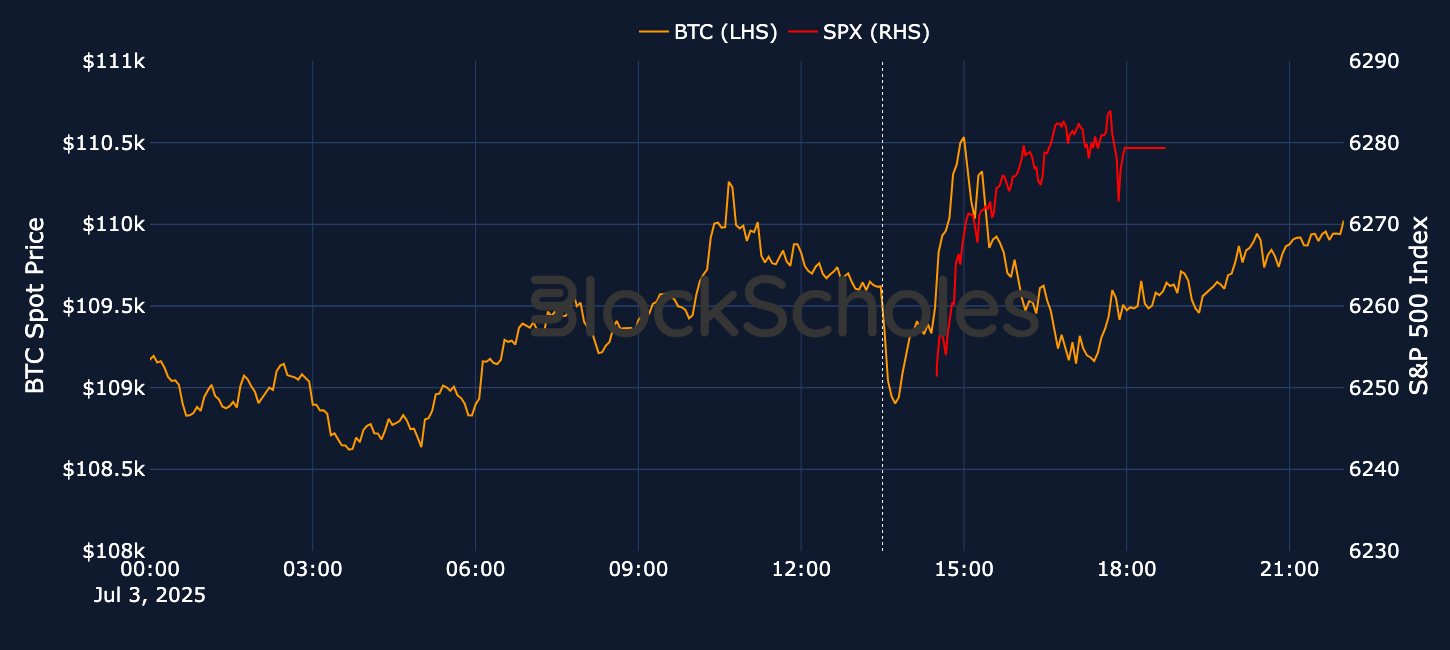
Below, we once more plot BTC and SPX’s reaction, this time to the June jobs data report (released on Jul 3, 2025). Once again, we find BTC’s response changing direction. The June jobs report (at the time) poured cold water on the odds of a July rate cut, as it fell from 28.5% to a mere 4.7%. In the initial aftermath of the release, BTC sold off — perhaps as traders rethought their expectations for a rate cut. However, not long after, both BTC and the SPX went on to rally significantly higher.
Ultimately, what this suggests is that the response to jobs data is not clearly directional — and it’s difficult to predict which way BTC may turn, following surprises in employment data. However, it’s clear that BTC is reacting more to the jobs side of the Fed’s dual mandate than it is to inflation, at least in regard to surprises in inflation data.
Positioning in the US bond market and — in particular — the shape of the US Treasury yield curve can be good signals of how market participants are parsing different macro data releases, and how those releases are shaping the market’s view on the US economy and the future path of interest rates.
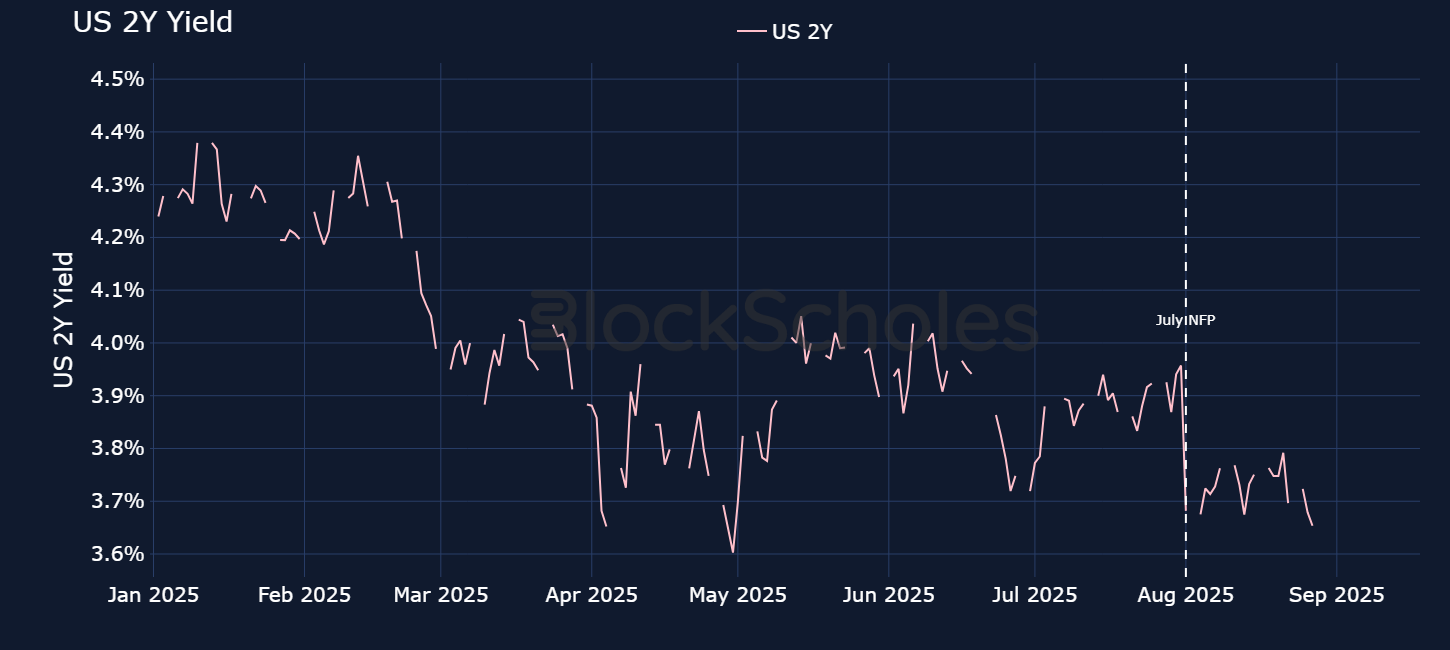
In the immediate aftermath of the softer-than-expected July jobs report, short-tenor Treasury yields fell sharply lower. The two-year Treasury bond yield — most sensitive to changes to monetary policy — fell from 3.94% to 3.69%, a 25 bps move and a strong indicator of the repositioning in bond markets. That repositioning was due to the fact that the US labor market was clearly not as “resilient” as Fed Chair Powell had emphasized in the July FOMC meeting, only days before the employment report, which had suggested that the Fed may need to lower short-term interest rates.
Market-implied odds from federal funds futures support this idea. On Jul 31, 2025, the probability of a September rate cut sat at just 37.66%. However, by Aug 6, 2025, a cut in September was all but locked in — and odds shot up to 94.28%.
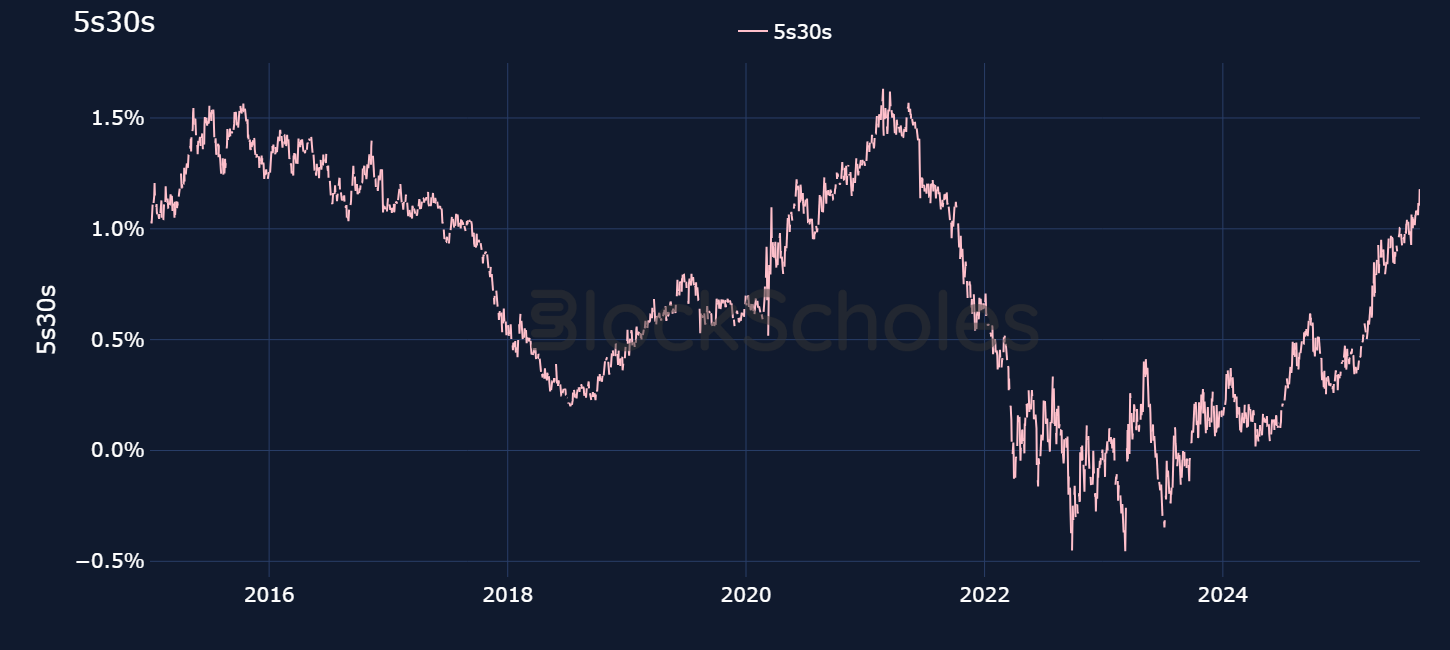
Nevertheless, the two-year Treasury yield only tells part of the story in US bond markets. While short-dated bond yields have been falling, long-tenor yields have been surging higher at the back end of the yield curve. This has resulted in a significant steepening of the Treasury curve.
We can look at the yield spread between different maturity Treasury bonds to visualize this steepening. For example, the 5s30s curve, defined as the 30-year Treasury yield minus the five-year Treasury yield, has steepened to its highest level since August 2021.
We can make sense of this steepening and the move higher in longer-dated US Treasury yields from Chair Powell’s Jackson Hole speech. The Fed Chair opened the door to a September rate cut, while acknowledging that the effects of tariffs on US inflation were “now clearly visible.” What Powell indicated, therefore, is that the Fed is willing to cut rates in the short term, even if inflation remains significantly sticky, and above its 2% target. Indeed, measures of expected inflation over the next 10 years have risen from a year-to-date low of 2.17% in April 2025 to 2.45%.
Another driver of higher, longer-dated US Treasury yields in 2025 has centered on concerns over the deteriorating fiscal status of the US. Back in May 2025, the 10-year Treasury yield jumped more than 10 bps to top 4.6%, on the back of the decision of credit agency Moody’s Ratings to strip the US of its top credit score. The company stated that “this one-notch downgrade on our 21-notch rating scale reflects the increase over more than a decade in government debt and interest payment ratios to levels that are significantly higher than similarly rated sovereigns.”
We’ve established the drivers that are contributing to the current steepening in the US yield curve. Short-dated yields are dropping, as markets once more price in rate cuts, and at the back end, longer-dated yields are rising over fears of interest rate cuts, despite sticky inflation, continued expectations for higher inflation from tariffs and concerns over the path of US borrowing costs.
So what is the likely impact of both drivers of this steepening on BTC and crypto asset prices?
The drop in short-maturity Treasury yields, such as the two-year yield, bodes well for risk-on sentiment. In the past, we’ve discussed why interest rate cuts favor risk-on assets. Lowering the federal funds rate means that it’s cheaper for banks to borrow from each other, resulting in lower costs of borrowing for businesses and consumers and effectively increasing liquidity in the financial system. These lower rates encourage spending, and the lower cost of credit can result in more liquidity flowing into risk-on assets.
Since BTC’s inception, the Fed has embarked on three rate-cutting cycles. The 2024 cycle began in September 2024, when the Fed cut by an outsized 50 bps, followed by two 25 bps cuts in November and December of that year. Since then, the Fed has been on hold. In 2020, the cutting cycle began in March, when the Fed lowered rates by 150 bps over the month, bringing the federal funds rate (FFR) to a range of 0% to 0.25%.
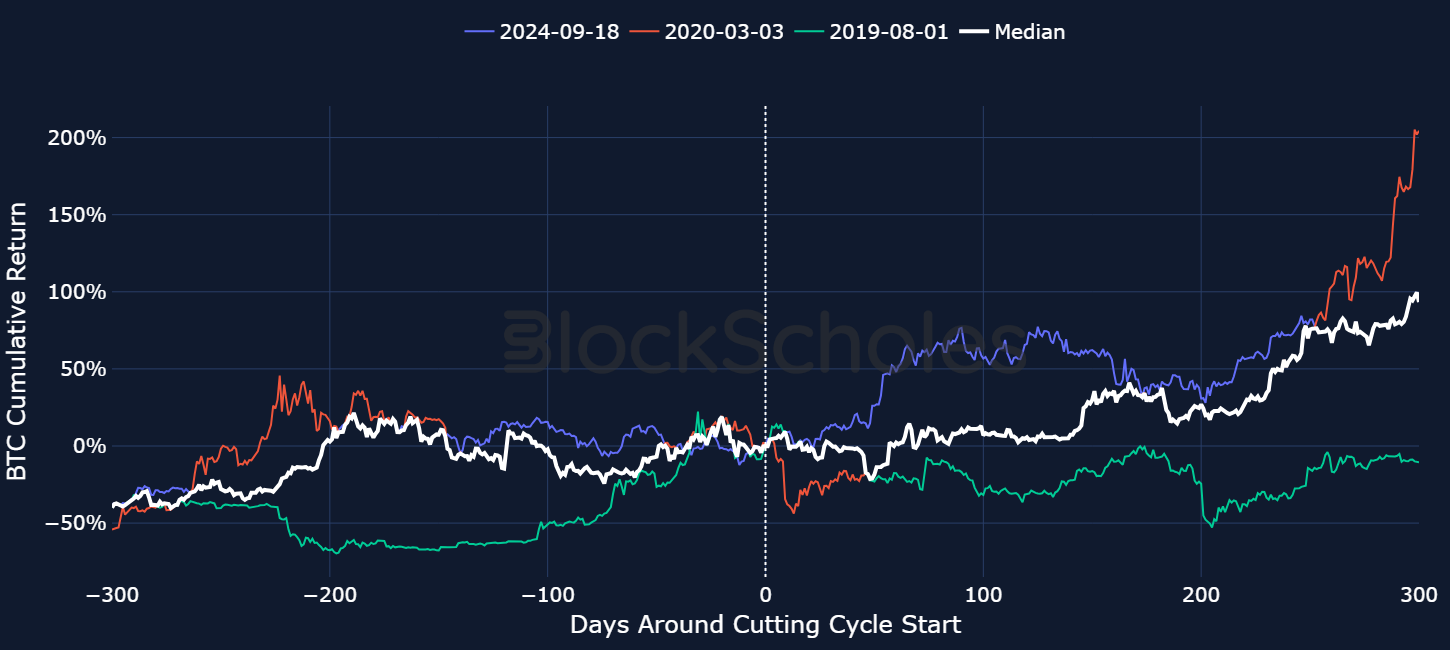
If we consider a potential September 2025 interest rate cut as the beginning of a new cutting cycle (given that the Fed had been on pause for more than half a year since the last cut), it’s difficult to immediately identify what BTC’s exact response may be, based purely on this data alone. All three cutting cycles have had a materially different impact. In the case of Covid, when risk-on sentiment in general had been crushed as the US economy contracted sharply, BTC fell 40%. However, for those who rode that storm out, almost a year after the cutting cycle began, BTC had rallied over 200%.
In the case of September 2024, BTC’s price didn’t see a similar dip down as it had in 2020. In fact, BTC fell going into the event, but rallied higher after the rate cut without many pullbacks, this time due to President Trump’s election victory. The most bearish case was the 2019 cutting cycle, when weak US growth prompted the Fed to cut rates by 75 bps over the course of three meetings. While BTC initially rallied following the first cut, it subsequently traded lower for most of the following year.
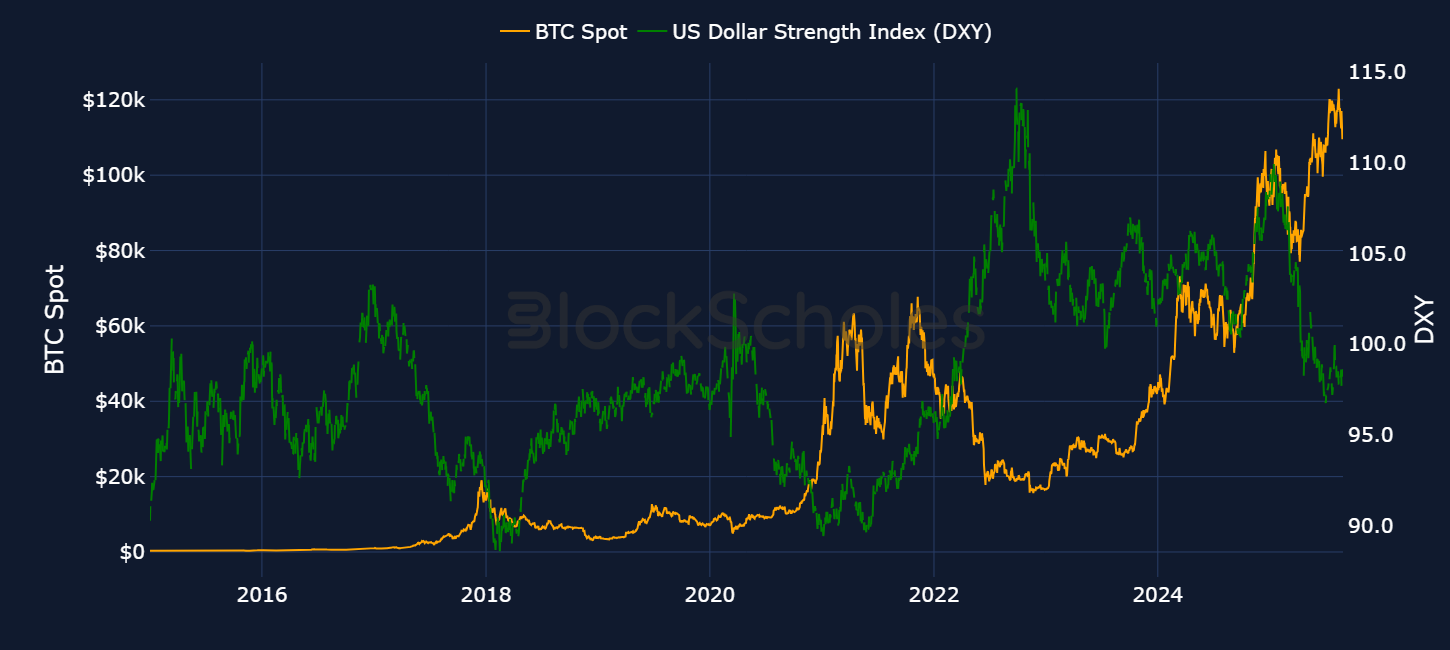
As for the two drivers contributing to the rise in the long end of the yield curve, both provide support for BTC. The growing concern around the fiscal deficit of the US, which has been exacerbated further by President Trump’s “Big Beautiful Bill,” has been a major factor in the sell-off in dollar-denominated assets earlier this year. For example, the US dollar (as measured by the US Dollar Index, or DXY) is down 9% year-to-date, which partially explains BTC’s outperformance.
Unusually, long-term Treasury yields have rallied alongside a sell-off in the US dollar earlier this year. Typically, the 10-year Treasury yield tracks the US dollar. However, we earlier reported comments made by Minneapolis Federal Reserve president Neel Kashkari that the combination of bond yields rising and the dollar weakening “lends some more credibility to the story of investor preferences shifting” — that is, investors adjusting away from US dollar–denominated assets.
That diversification away from dollar-denominated assets and fears of higher-for-longer inflation also bode well for BTC: its fixed supply nature, coupled with an increasingly growing sticky marginal buyer in the form of Spot ETF buyers or corporate treasuries (which we cover later in this report), strengthen the case for continued support in BTC’s spot price against the dollar.
If the macro environment still appears conducive to a rally in BTC and risk-on sentiment, implied volatility in BTC and across financial markets doesn’t seem to have priced it in just yet.
Following Jackson Hole, we’ve seen a drop in volatility levels in US equity markets, bond markets and BTC’s price. Our recent monthly volatility reports have provided some reasons for why BTC implied volatility has been declining to historically low levels. One major driver is the demand from Spot ETF buyers, who are suppressing the realized volatility of BTC returns by acting as a marginal buyer in market sell-offs and a “stickier” source of buying demand.
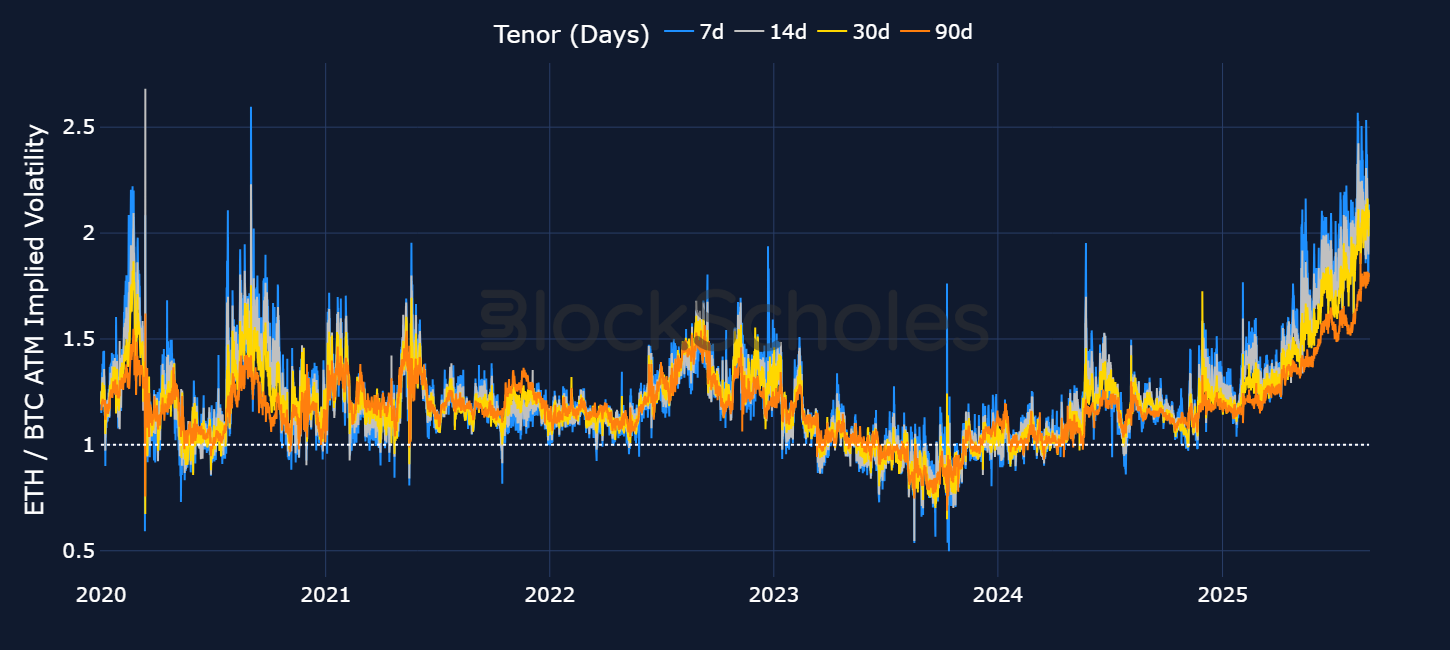
We see this uniquely affecting BTC. Options traders for ETH have shown a far higher willingness to bid up short-term options which has meant that ETH’s term structure of volatility has inverted far more often than that for BTC over the past year. In turn, this means that the ratio of ETH to BTC at-the-money implied volatility has risen to levels not seen in almost five years — largely due to a declining IV for BTC options.
However, volatility is also significantly low in US equities. For instance, the VIX is a metric that measures market sentiment in the S&P 500, where higher readings indicate expectations of higher volatility over the upcoming 30 days. We can see historically that big jumps in volatility across equity markets have pushed BTC down — BTC sells off alongside the jumps in volatility, which are often a result of big moves down in equity prices.
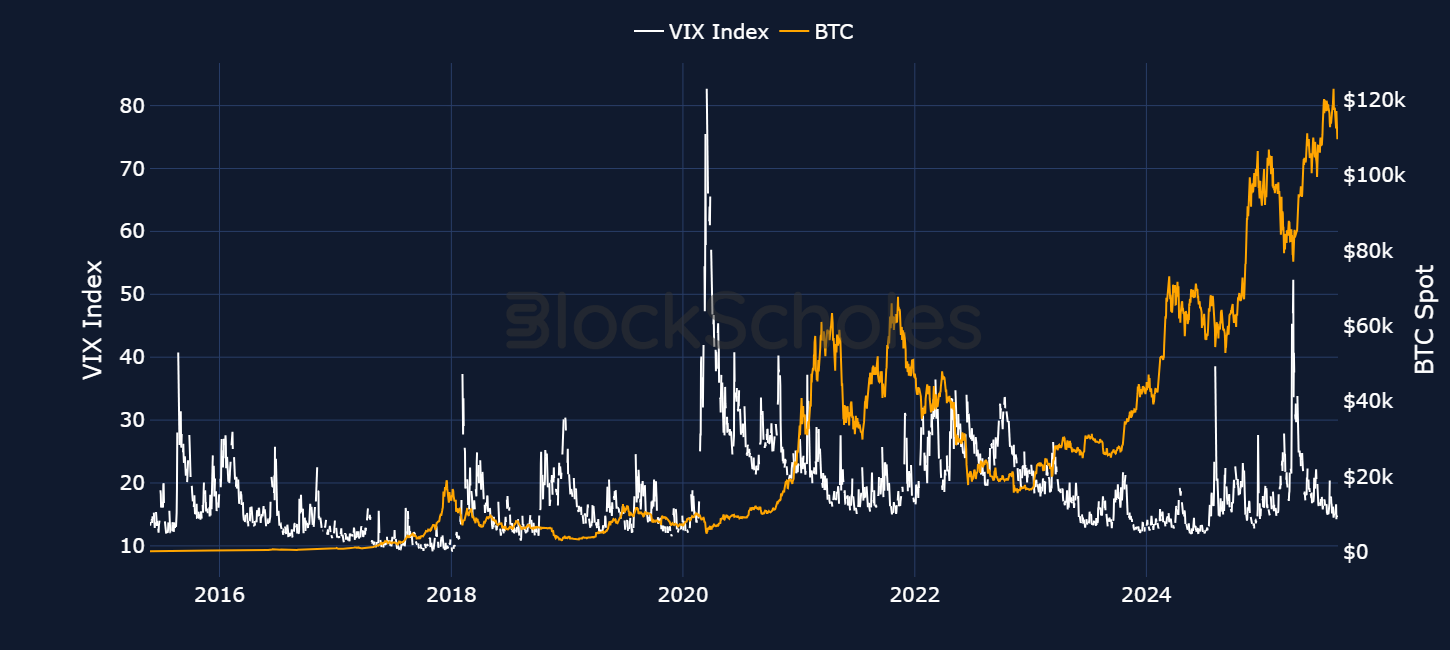
Interestingly, the VIX is currently at its lowest levels all year, despite no lack of market narratives that could have driven volatility higher. In August alone, President Trump fired the head of the BLS, claiming the July jobs report was “RIGGED” to "make the Republicans, and ME, look bad." In late August, he even fired Federal Reserve Governor Lisa Cooks over an alleged mortgage fraud, marking the first time a US president had ever removed a Fed governor. This was occurring alongside another month of continued tariff escalation, the legal status of which is currently being determined by the US Supreme Court.
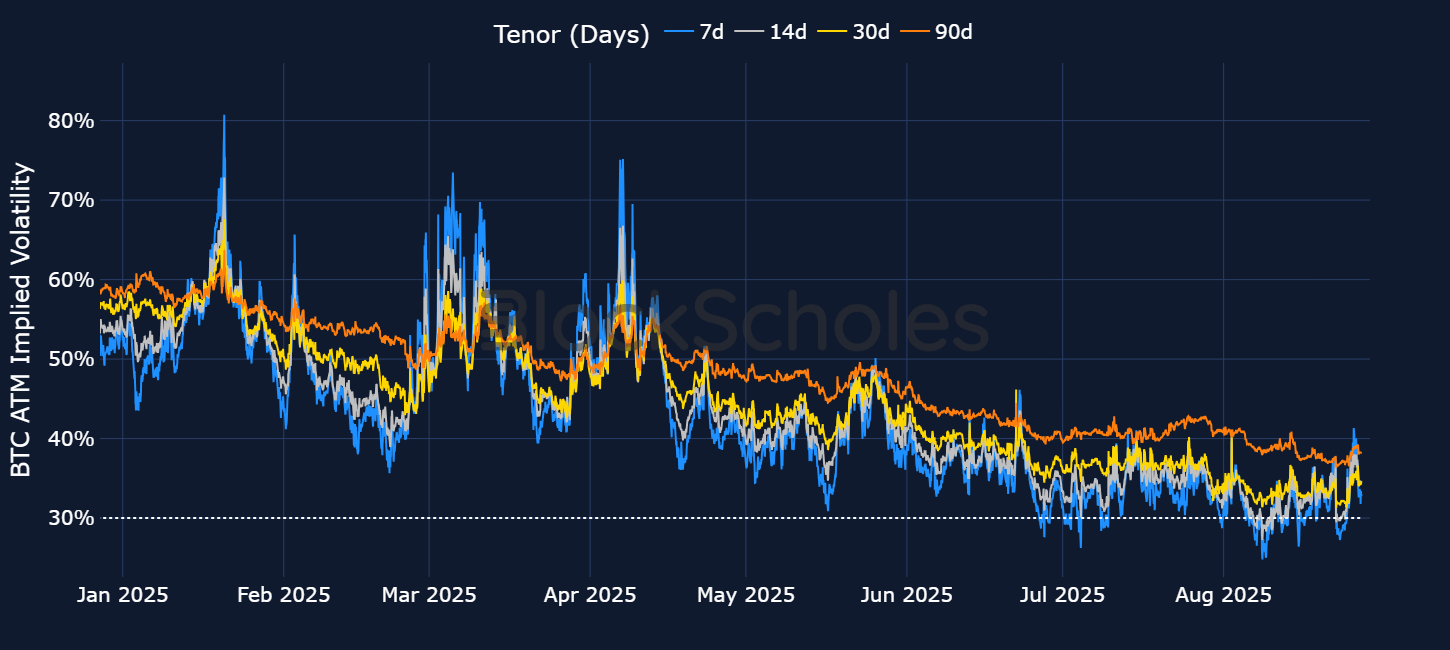
Nonetheless, both US equities and BTC are still close to all-time highs, while volatility remains considerably low for both. Implied volatility on short-tenor BTC options fell to its lowest level so far in 2025 (26% on Aug 7, 2025), at a similar time to the VIX touching its 2025 low. While previous low periods of volatility have often been followed by sharp price swings that caught markets by surprise — for example, the jump in the VIX from 12.03 in early July 2024 to 38.57 at the peak of the yen unwind — we have yet to see the same occurrence this time around.
While macroeconomic factors have shifted from a clear tailwind for risk-on assets to a confusing crosswind, supply-and-demand factors for crypto assets remain structurally sound. However, the nature of that demand has changed — not least because of a knock-on effect from the positive regulatory environment in the US. Instead of a lack of demand for crypto assets, we see a shift in investor appetite, away from BTC and toward ETH.
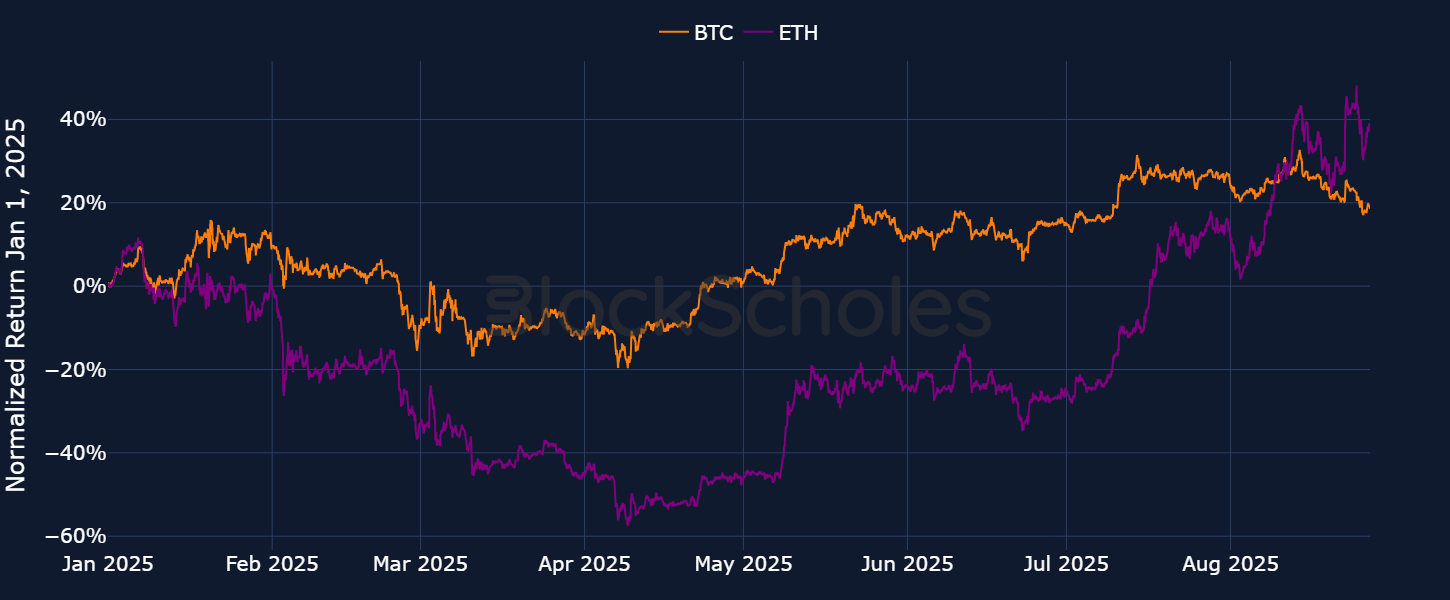
We believe that the divergence between the supply-and-demand dynamics of each major token has been a strong driving factor in ETH’s significant outperformance over Bitcoin (and other altcoin crypto assets).
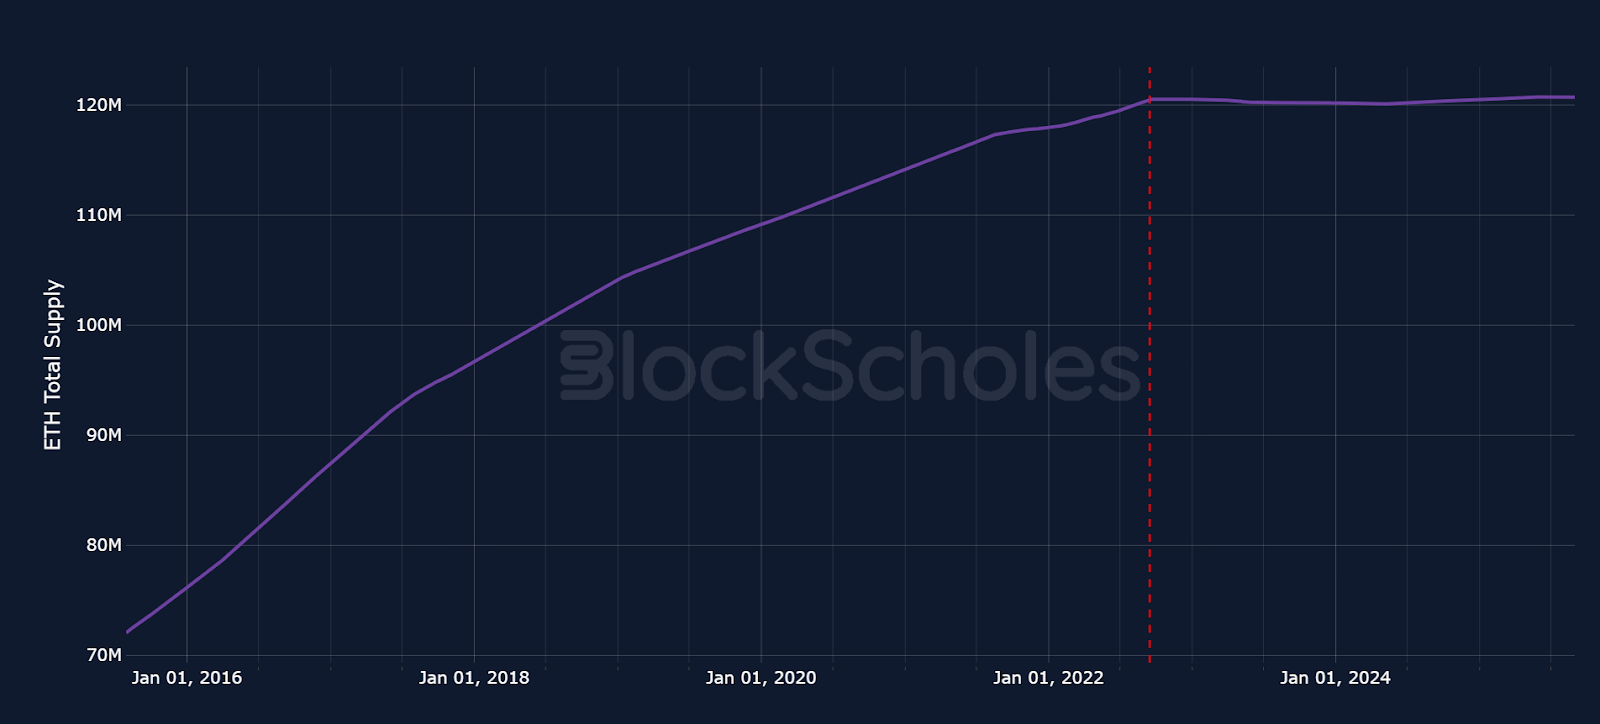
Bitcoin and Ether have markedly different supply models: Bitcoin’s supply is fixed at 21 million, released incrementally through mining, with around 19.9 million already mined. In contrast, Ether’s supply is dynamic, adjusting in response to onchain activity. Tokens are burned and issued as rewards to validators, with the aim of keeping supply broadly constant. Since Q3 2022, Ether’s supply has remained steady at roughly 120 million. At present, it’s not the supply of BTC or ETH that’s driving price action, but rather the structural shift in demand from BTC to ETH that’s fueling price appreciation.
Macroeconomic factors are currently the main drivers of price action for both Bitcoin and Ether. However, an imbalance in demand is leading to Ether’s relative outperformance over Bitcoin. Demand for Bitcoin primarily comes from long-term holders and speculators, including short-term traders active on exchanges and, more recently, investors using regulated ETF vehicles. Ether shares these same demand sources, but also benefits from additional factors, such as holding for yield generation through staking on the Beacon Chain and ETH’s use in decentralized finance (DeFi) protocols built on Ethereum’s Mainnet.
While these use cases are fundamental to Ether and, to some extent, already priced into its spot value, historical developments — such as regulation, and the growth of stablecoin usage — have further supported Ether’s price. That said, we don’t see these factors as the current drivers of Ether’s recent outperformance.
Instead, it’s the introduction of ETFs that has opened Bitcoin and Ether trading to a new market by bringing in significant capital from the traditional finance (TradFi) industry. These products provide a regulated entry point, allowing traders to accumulate and speculate on price movements. As a result, ETFs have created a new and actively participating source of demand that didn’t exist at the same scale before 2024.
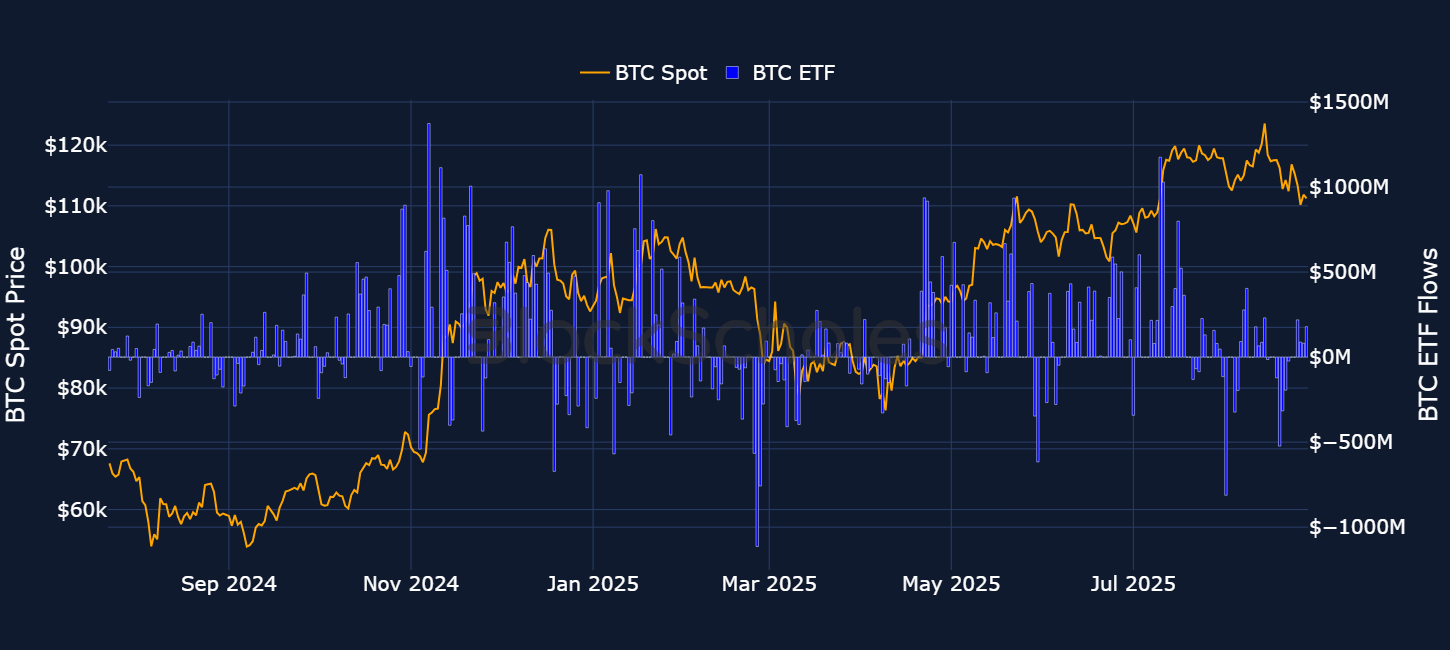
ETFs capture demand for both BTC and ETH, but their impact on Bitcoin has been especially clear. ETF inflows have become a major driver of spot prices, with inflows aligning with rallies such as the July 2025 surge, and outflows coinciding with drawdowns like the April 2025 crash. Over the past year, Bitcoin has seen consistent high-value inflows, at times exceeding $1B in a single day. This sustained demand through ETFs has supported an overall positive trend in Bitcoin, reflected in its rising spot price over the period.
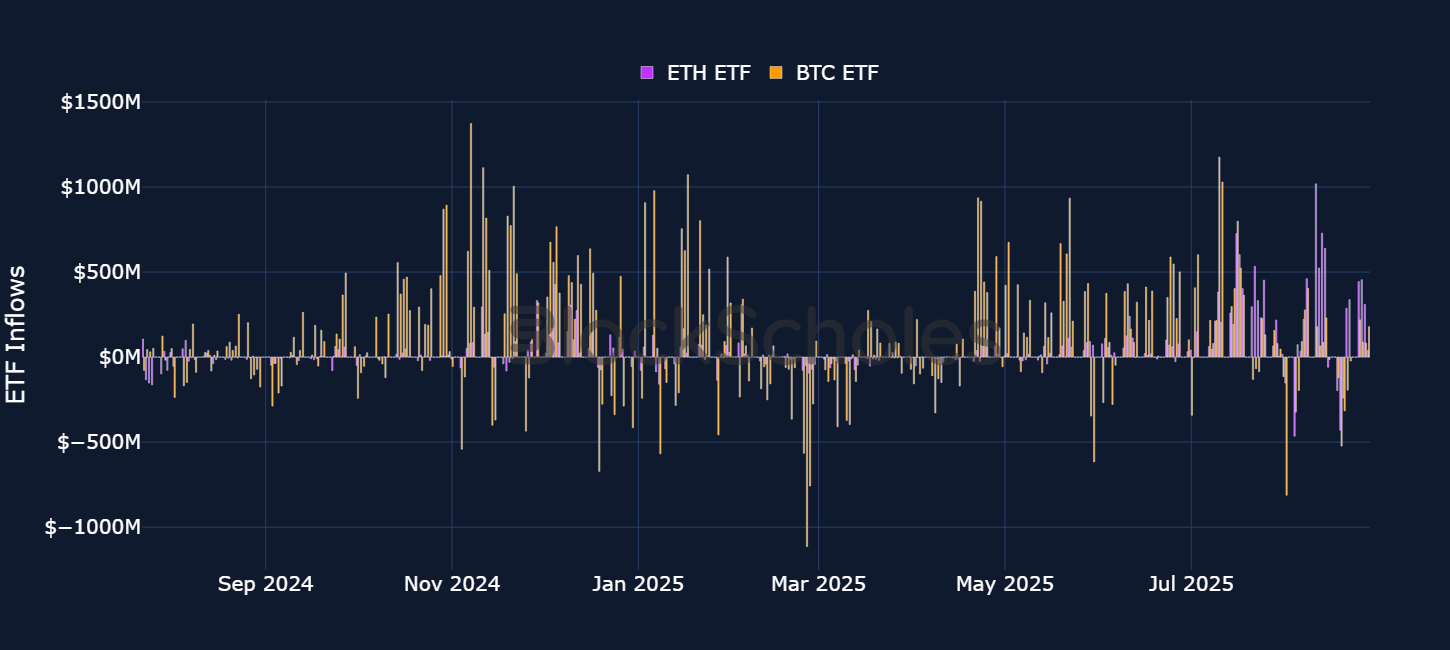
However, whereas Bitcoin’s ETF activity has historically far outweighed that for Ethereum ETFs, with large inflows into Bitcoin contrasted by weak or often nonexistent inflows into Ether, we’re now seeing that dynamic shift. Since July 2025, ETH Spot ETFs have consistently attracted more demand than BTC Spot ETFs, a phenomenon not seen at this scale since ETFs were first launched. In numbers, since July 2025, cumulative net flows show ETH Spot ETFs totaling around $9.463B, compared to BTC Spot ETFs at $5.39B.
This extreme divergence in ETF-driven demand between ETH and BTC is particularly evident since Jul 21, 2025. During this period, ETH recorded net inflows of $6.185MB as compared to BTC’s −$380M. While BTC Spot ETFs did experience brief periods of positive inflows, each wave of buying was followed by even stronger selling, resulting in multiple instances in which outflows erased earlier gains.
That bullish excess demand for ETH in ETFs goes some way toward explaining why its price has rallied strongly — outperforming BTC, which has remained more stable in comparison. In previous reports, we’ve outlined the factors we believe would drive an Ether rally, including regulatory developments and stablecoin adoption on public blockchains. That rally has now materialized, and ETF investors are taking notice.
This marks a new phenomenon. While similar price moves occurred between November 2024 and December 2024, and again between July 2025 and August 2025 (each time rising from around $2,500 to $4,000), the current rally stands out. ETF inflows during this move have nearly doubled those seen previously, signaling a clear shift away from historically muted ETF participation in Ethereum. As Ether’s price has continued to climb, ETF inflows have correspondingly accelerated, reinforcing the momentum.
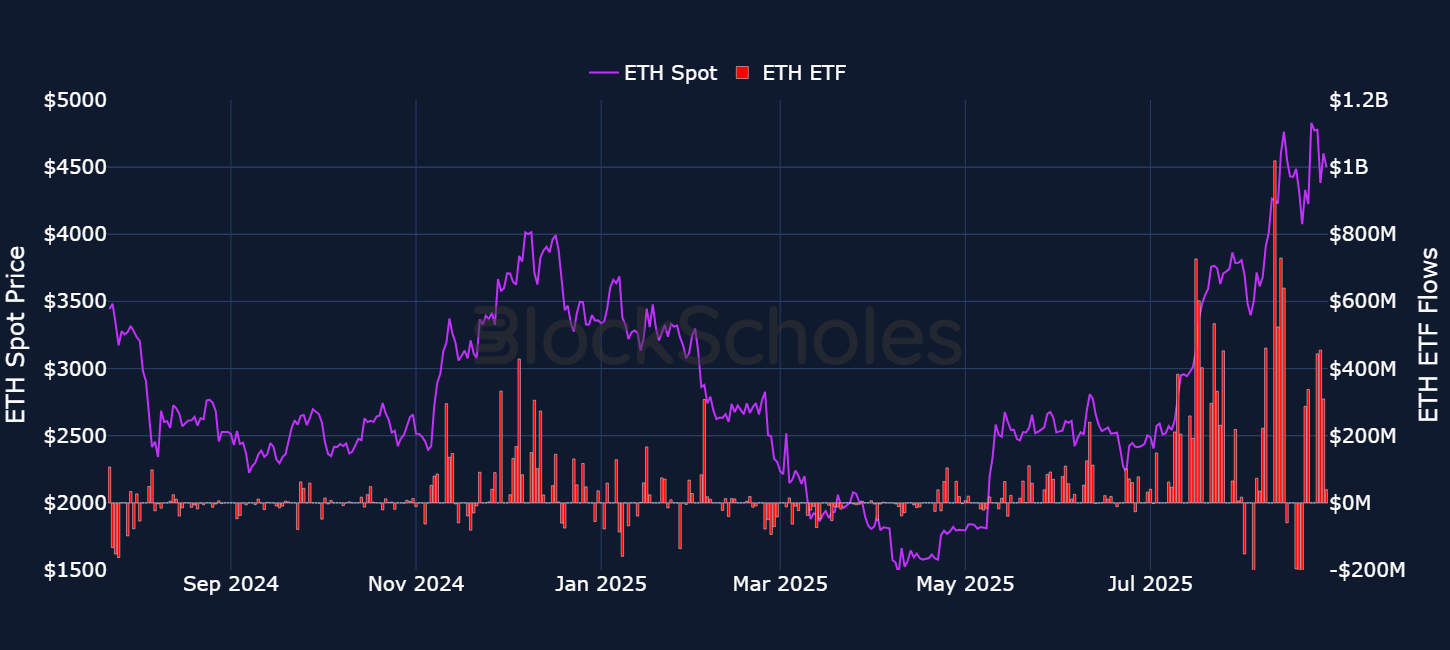
Since mid-July, BTC has fallen by 7.1%, while ETH has continued to rally, gaining 39% and reaching a new all-time high of $4,946.05 on August 24, 2025. This move aligns with the net inflows and outflows observed in ETFs over the same period.
Alongside a shifting demand in ETFs from BTC and ETH, we’re also seeing a similar sentiment shift in the Treasury space. A demand for crypto asset exposure that had for so long been siloed to BTC has now been rolled out across different crypto assets, including ETH and other altcoins such as Solana. However, just as with ETFs, the expansion of ETH treasuries has rapidly accelerated over this period.
A more broad-based, treasury-driven institutional demand across assets has become more apparent, with ETFs and treasury companies driving large-scale accumulation of both BTC and ETH. This buying power not only reduces circulating supply, but also strengthens market demand, creating upward price pressures. Public treasuries currently hold nearly 989,107 BTC (4.97% of its total supply) and 3.37M ETH (2.8% of its total supply), highlighting the growing role of institutions in shaping crypto’s supply-demand dynamics.
Companies like Strategy (formerly MicroStrategy) have continued to expand BTC holdings, regardless of downturns, while BitMine Immersion Technologies has pledged to accumulate 5% of ETH’s supply, ensuring persistent institutional inflows. These strategies are reinforcing a structural shift in markets, whereby institutional accumulation and long-term holding practices are signaling confidence in crypto’s role as a Treasury reserve asset.
Since our June deep-dive into the developments in crypto regulation in the US, President Trump’s administration has continued to maintain a positive regulatory stance. Earlier this year, regulatory advancements were at the forefront of price action drivers. Now, among the three drivers we’ve identified (macro, supply-and-demand and regulations), regulatory advancement remains supportive for crypto adoption in the US, though it isn’t currently the principal driver.
After a late May announcement by the SEC that crypto staking activity doesn’t constitute a securities transaction, deposits of ETH into staking pools increased almost linearly, as did demand for Ethereum Spot ETFs. Less than two months later, the market cap of the entire digital assets space surged past $4T for the first time, following the passing of the GENIUS Act. These moves were led by altcoins such as Ether. Now, regulation is no longer the main driving force behind price activity, but nonetheless remains a relevant factor that’s supportive of crypto asset prices.
One of the most important developments in the regulatory space recently was the announcement of Project Crypto by the US Securities and Exchange Commission (SEC). SEC Chair Paul Atkins announced the project on Jul 31, 2025, defining it as “a Commission-wide initiative to modernize the securities rules and regulations to enable America’s financial markets to move on-chain.”
According to Atkins, the project’s initiative was in direct response to an earlier report published by the White House titled “Strengthening American Leadership in Digital Financial Technology.” That report contained recommendations for the SEC and other federal agencies to build a framework designed to boost the US’s dominance in the digital asset sector.
Some of the key initiatives from Project Crypto include developing “clear guidelines that market participants can use to determine whether a crypto asset is a security or subject to an investment contract,” as well as bringing tokenization back to the US. According to Atkins, “many firms seek to ‘tokenize’ their common stock, bonds and other securities,” but this is being done offshore due to regulatory challenges in the US. “Project Crypto” directs SEC staff to “work with firms seeking to distribute tokenized securities within the United States and to provide relief where appropriate to assure that Americans are not left behind”.
Additionally, Project Crypto also aims to draft clear rules on the custody and trading of crypto: “it is incumbent on the SEC to ensure that market participants have maximum choice when deciding where to custody and trade crypto assets.” Finally, the project aims to help advance the creation of “super apps”: according to Atkins, “[S]ecurities intermediaries should be able to offer a broad range of products and services under one roof with a single license.” To help with this, the SEC is looking to minimize the number of regulators or regulatory regimes to which digital asset companies are subject. That way, an SEC-regulated broker-dealer platform (i.e., an exchange, for example) should be able to offer trading in non-security crypto assets alongside crypto asset securities, as well as other services, such as staking “side-by-side,” without requiring “fifty-plus state licenses or multiple federal licenses.”
While the same three core drivers of crypto spot price action continue to take center stage, the impact of each factor has changed toward the end of what has been a bullish summer. Macro conditions have shifted from a clean tailwind to crosswinds — and while markets have faced at least some uncertainty about the path of monetary policy, the front end of the US Treasury yield curve is falling as the Fed pivots toward growth risks while the long end steepens on sticky inflation and fiscal concerns. We see both moves ultimately supportive of BTC: cheaper short-rate funding buoys risk appetite, and dollar softness reinforces the store-of-value bid. However, BTC's price action sensitivity has rotated from CPI to labor data in a sign of a wider concern for the timing of the resumption of the Fed’s cutting cycle.
Aggregate demand for crypto asset exposure remains strong but has changed flavor: ETF flows and institutions — via large-scale Treasury accumulation strategies — are increasingly expressing it via ETH instead of BTC, which has had a clear impact on spot price performance in July. The policy backdrop is still constructive (the US continues to push ahead, introducing the SEC’s “Project Crypto”), but it isn’t clear where the next major wins for regulatory progress will present themselves. Stablecoin adoption — and its likely corollary in the tokenization of a wealth of offchain, traditional finance assets — is likely to have a long-term impact on any assets that touch decentralized finance.


.jpg)
.jpg)