Thahbib Rahman
Research Analyst
Realized volatility levels have collapsed across crypto assets. The first two weeks of September have seen realized volatility fall to historic lows for BTC, ETH and SOL spot tokens, despite a slew of macroeconomic factors and the resumption of the Fed’s rate-cutting cycle.

Just as with every month so far in President Trump’s second presidential term, August was marked by numerous tariff, macro and crypto-related announcements, including a highly anticipated keynote speech from Federal Reserve Chair Jerome Powell at the Jackson Hole Symposium and a new all-time high (ATH) for BTC’s spot price.
On Jul 31, 2025, President Trump signed an executive order that announced a slew of adjusted tariff rates. While the baseline rate remained at 10%, many nations with a trade surplus with the US were hit with a minimum 15% baseline rate, spurring a sell-off in global equities and crypto. Risk-on assets were also affected by a marked weakening in the US labor market, as the July jobs report showed the largest two-month job revision since the 2020 Covid-19 pandemic.
The resulting sell-off at the outset of August was perhaps expected (given the market response to Trump’s initial April tariff fusillade), but the week that followed was decidedly bullish for crypto assets. Trump had signed an executive order that would allow 401(k) plans (a popular retirement savings account in the US) to invest in cryptocurrencies, and extended his tariff pause with China for another 90 days. July’s CPI inflation report showed a headline figure of 2.7% year-on-year and a tepid passthrough of inflation into goods, cementing a then–market expectation of a 25 bps rate cut for the Fed’s September meeting.
Together, these drivers pushed risk-on sentiment higher. BTC rose to an ATH of $124K, only days after a similar record was reached in the S&P 500.

However, this action-packed month of macroeconomic events and data releases belies the oddly low volatility with which crypto has moved in early September.
Despite the macro events that moved risk-on markets throughout the end of summer in August and into September, crypto volatility levels have been — and continue to be — incredibly low. First, realized volatility (the volatility that assets are actually moving with) is near historic lows across crypto spot markets. See this phenomenon in the chart below, which shows the 7-day rolling realized volatility for BTC, ETH and SOL, respectively.
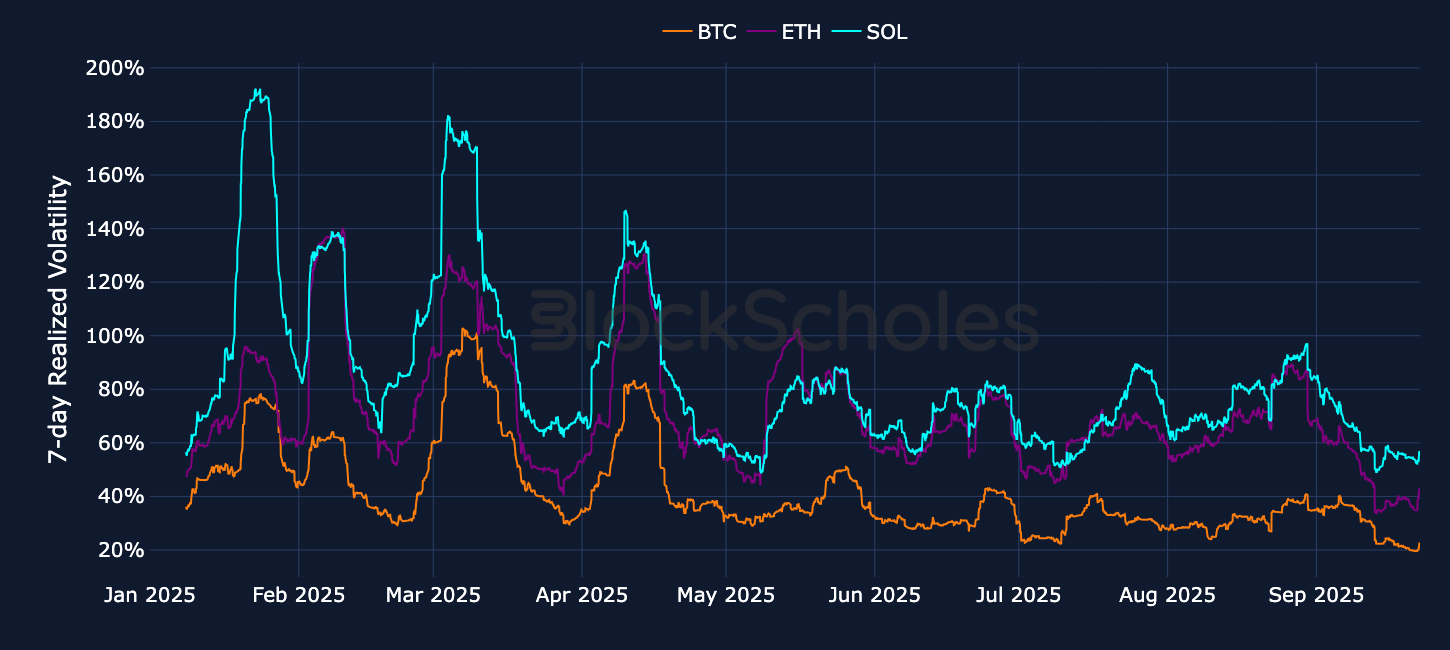
All three spot tokens are at historically low levels — low even when considering the fact that BTC’s volatility has been falling consistently throughout 2025. BTC volatility has printed at just 20% over the past two weeks, despite trading with an average realized volatility of 42% in 2025. The values are just as extreme for ETH and SOL, at 40% and 56% over the last seven days vs. historical averages of 71% and 85% (respectively). This is quite unusual, especially given the bullish sentiment for ETH and SOL over this period (as a result of DAT treasury–inspired catch-up rallies) and multiple macroeconomic surprises.
What’s even more surprising is that implied volatility (the level at which markets expect the spot price to move with in the near future) is low, too — but not as low as we’d expect. Usually, we’d expect implied volatility levels to stay closely anchored to recent levels in relation to realized volatility. But that’s not the case here, as is clear from the next chart — which shows the ratio of implied volatility (expectations) vs. realized volatility (what’s recently been delivered).
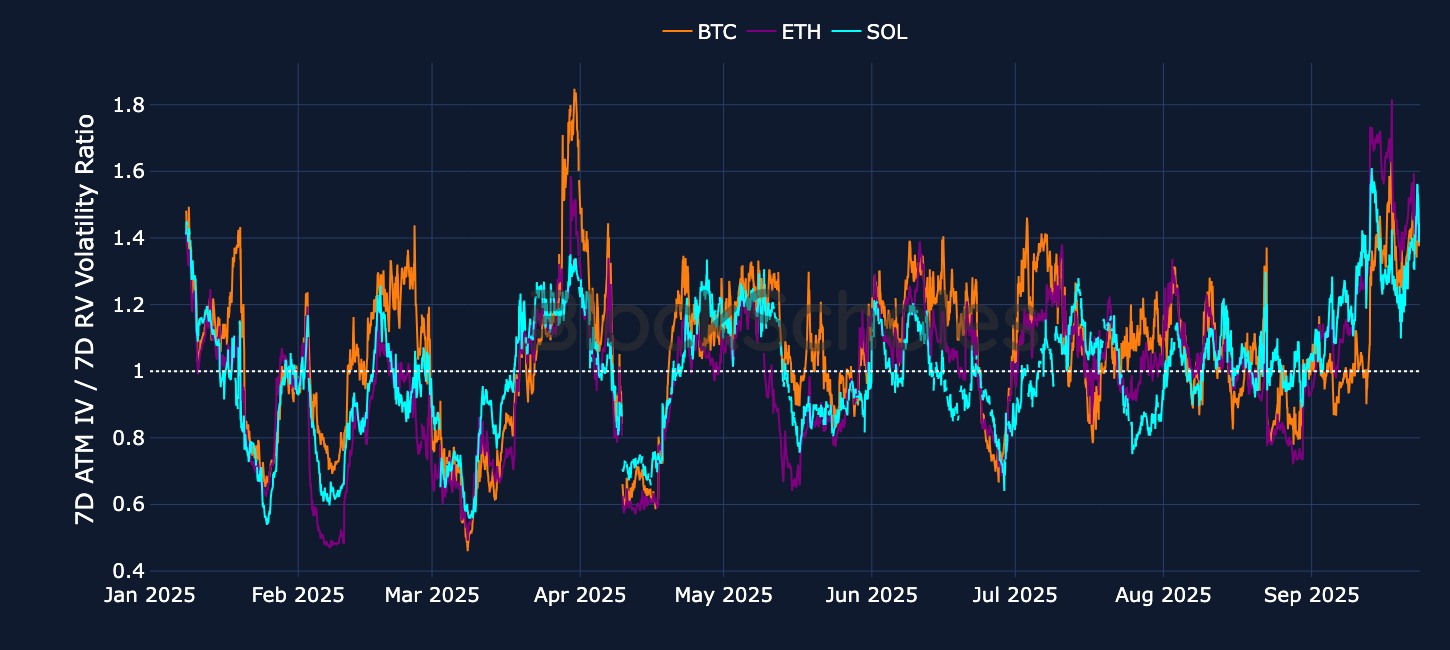
For BTC, ETH and SOL, options markets are pricing in a level of volatility around 1.5 times that at which it’s moving at the moment. One exception to the rule that implied volatility tracks realized levels is when markets expect a higher level of volatility, usually due to a known event in the near future that may cause spot prices to jump more in the future than they have in the recent past.
The Federal Reserve meeting on September 18 was one such event that we would expect to cause such an extra premium to be priced into the level of options, and the event itself certainly did prompt a reaction in crypto asset spot prices. All tokens rallied in response to the event, before soon giving up all of their gains in every case.

However, the premium of implied volatility over and above the level of realized volatility began suddenly on Sep 13, 2025, when realized volatility dropped sharply. Furthermore, the premium assigned to options hasn’t been resolved since the event, indicating that it wasn’t solely attributable to the event itself. In other words, there’s something else at play here.
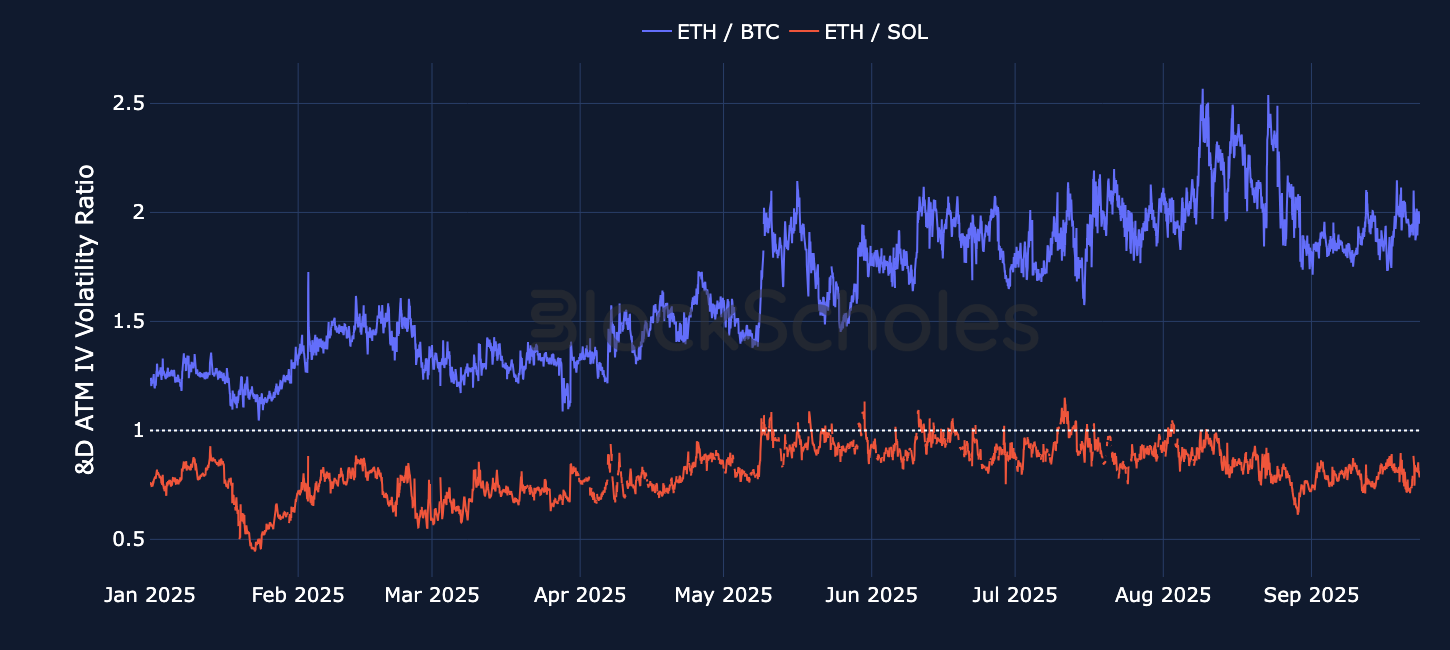
We can’t attribute the dislocation in implied volatility to coin-specific events either, as the dislocation appears to be present across all markets. In addition, we don’t see any change in the levels of implied volatility of one coin relative to another — for example, ETH continues to trade at a distinct premium to BTC (as it has throughout 2025), with only a slight moderation in the magnitude of that premium since early September. We see the same dynamic in ETH and SOL’s relative levels, too: SOL continues to trade at the same slight volatility premium for ETH.
What are we to make of this dislocation? Crypto realized volatility has been markedly low over the past two weeks, after having dropped from relatively normal levels before that. In contrast, implied volatility levels have remained at normal levels, indicating that markets expect the usual volatility level to prevail. This can be resolved in one of two ways: either implied volatility falls to meet the level of realized volatility (making options cheaper in volatility terms), or realized volatility explodes higher once again — vindicating options traders' decision not to lower their pricing of optionality.
Bitcoin’s early-August ATH of $124K (recorded on Aug 14, 2025) didn’t hold for long — as later that same day risk-on sentiment across asset classes took a hit that it apparently still hasn’t recovered from. BTC fell to an intraday low of $117K amidst high inflationary pressures at the wholesale level in the US. The Bureau of Labor Statistics's Producer Price Index (PPI) report, which measures the average change over time in selling prices received by domestic producers of goods and services, rose 3.3% in July as compared to one year before, far exceeding expectations of 2.5%. That caused market participants to worry that producers may pass on some of their costs to consumers, pushing up consumer price inflation at a lag.

At the same time, in options markets we saw sentiment turn decidedly bearish for only the third time this year. The 90-day BTC skew turned negative, indicating a relative preference for bearish protective put options. Despite the recent ATH in BTC’s spot price, options markets positioned themselves with the fear of further spot price meltdowns for most of the rest of the month, as evidenced by a near-consistent skew in the volatility smile toward OTM puts.

That negative skew of longer-dated volatility smiles proved to be a persistent narrative until the present, deepening as the sell-off in BTC and ETH has deepened. Longer-dated ETH options, however, managed to keep their premium toward call options until the end of the month, when the 90-day skew turned negative for a more sustained period. Ahead of Chair Powell’s Jackson Hole speech on Aug 25, 2025, longer-dated BTC options skewed toward puts for only the third time this year (ignoring brief temporary spikes). This marked the beginning of the longest period of time in 2025 in which 90-day options have maintained a preference for downside exposure.
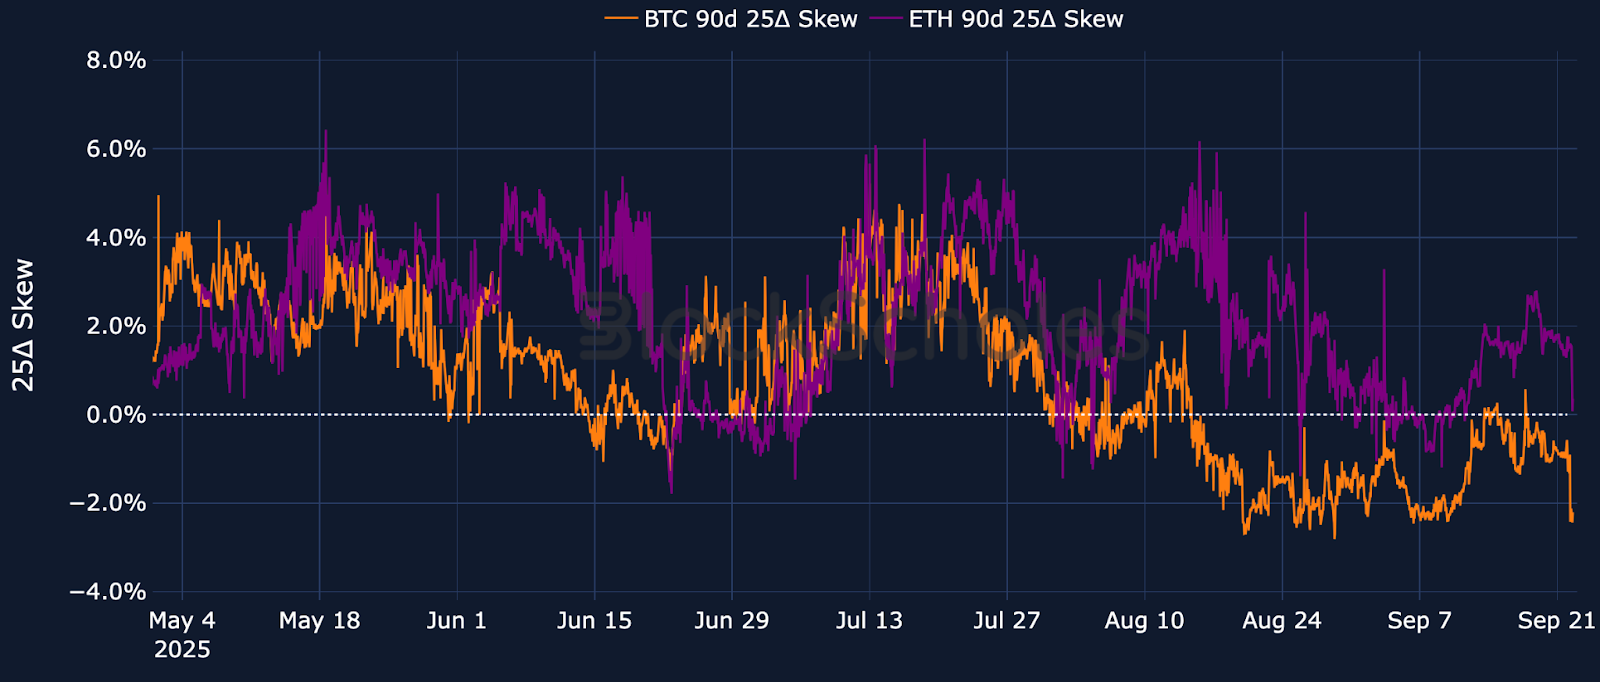
BTC hasn’t yet recovered from its skew toward OTM puts — and downside protection at longer-dated tenors continues to trade with an implied volatility premium over call options at a similar delta. The divergence in BTC and ETH is now even stronger (in mid-September), with 90-day volatility smiles actually skewed bullishly toward OTM calls despite bearish pricing in BTC. After an early-morning sell-off on Monday, Aug 22, 2025, we saw strong bearish positioning in both BTC and ETH options markets.
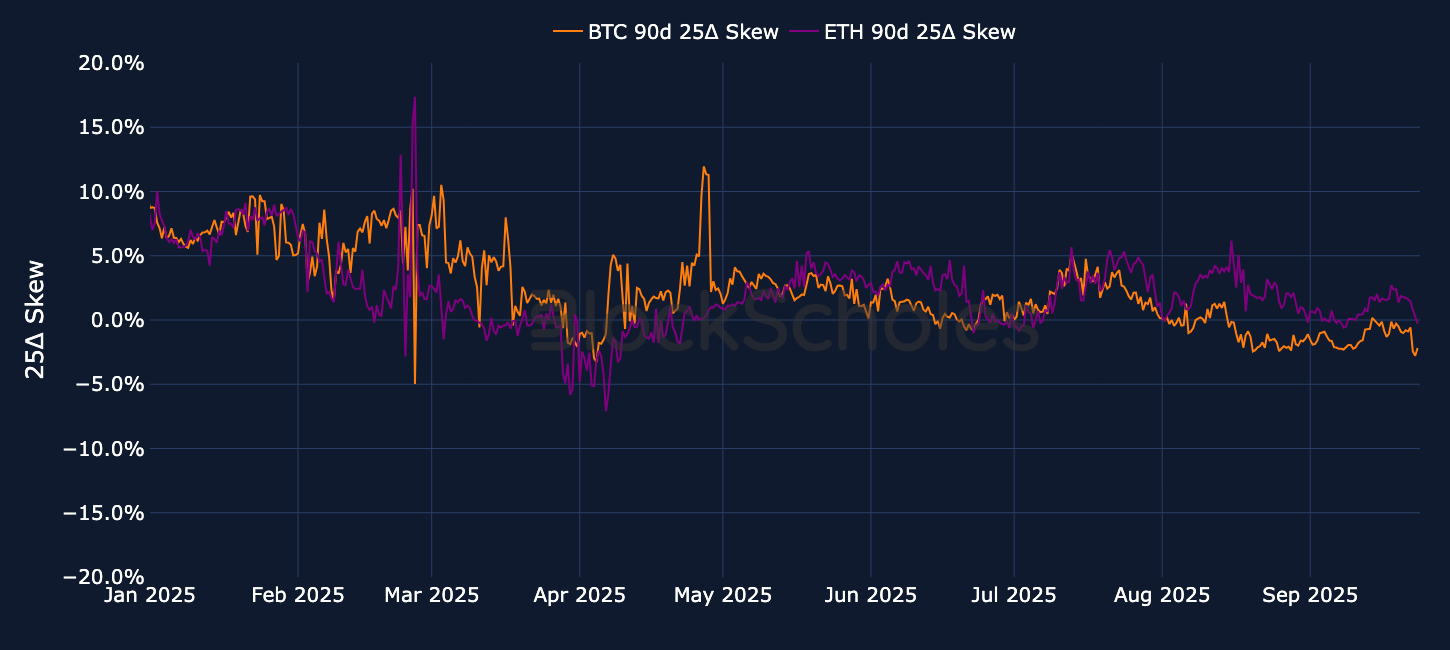
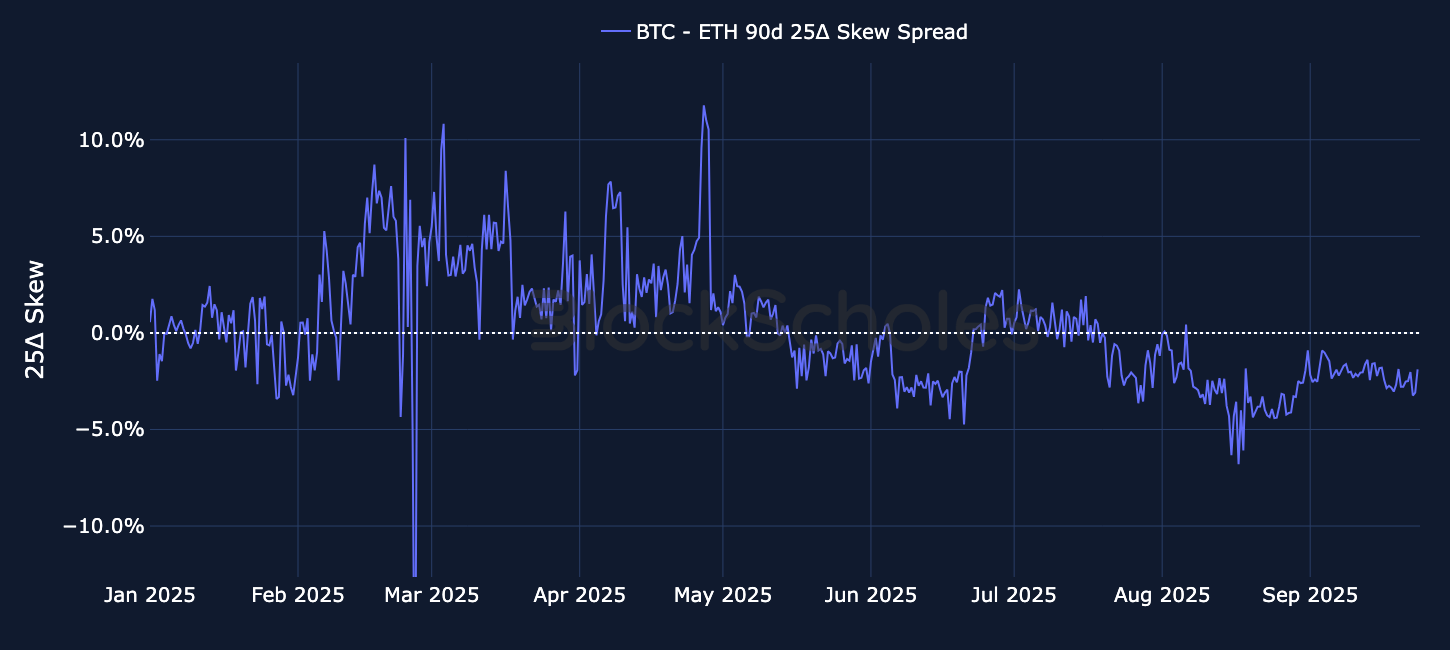
ETH’s implied volatility is still much higher than BTC’s (which we highlighted in the section above), but longer-dated ETH skew is also pricing for a divergence in direction as compared to BTC. While not the strongest dislocation between direction bets in ETH relative to BTC that we’ve seen this year, it’s the first time that the difference has been so large at the same time that the skews of the two tokens are pointing in different directions.
So where is the bearish pricing in BTC options markets coming from? Is it due to a fall in the implied volatility of call options, or instead to an increased demand for OTM put options?
The chart below represents the ratio in the pricing of implied volatility in the wings of the volatility smile relative to the ATM level, positioned in the middle of the smile. For calls, this ratio is plotted in blue, and for puts, in red. When the ratio for either type of option is > 1, traders are expressing a relatively higher demand for calls (or puts) by pricing the 25 delta implied volatility above the level of volatility implied by options struck at-the-money.
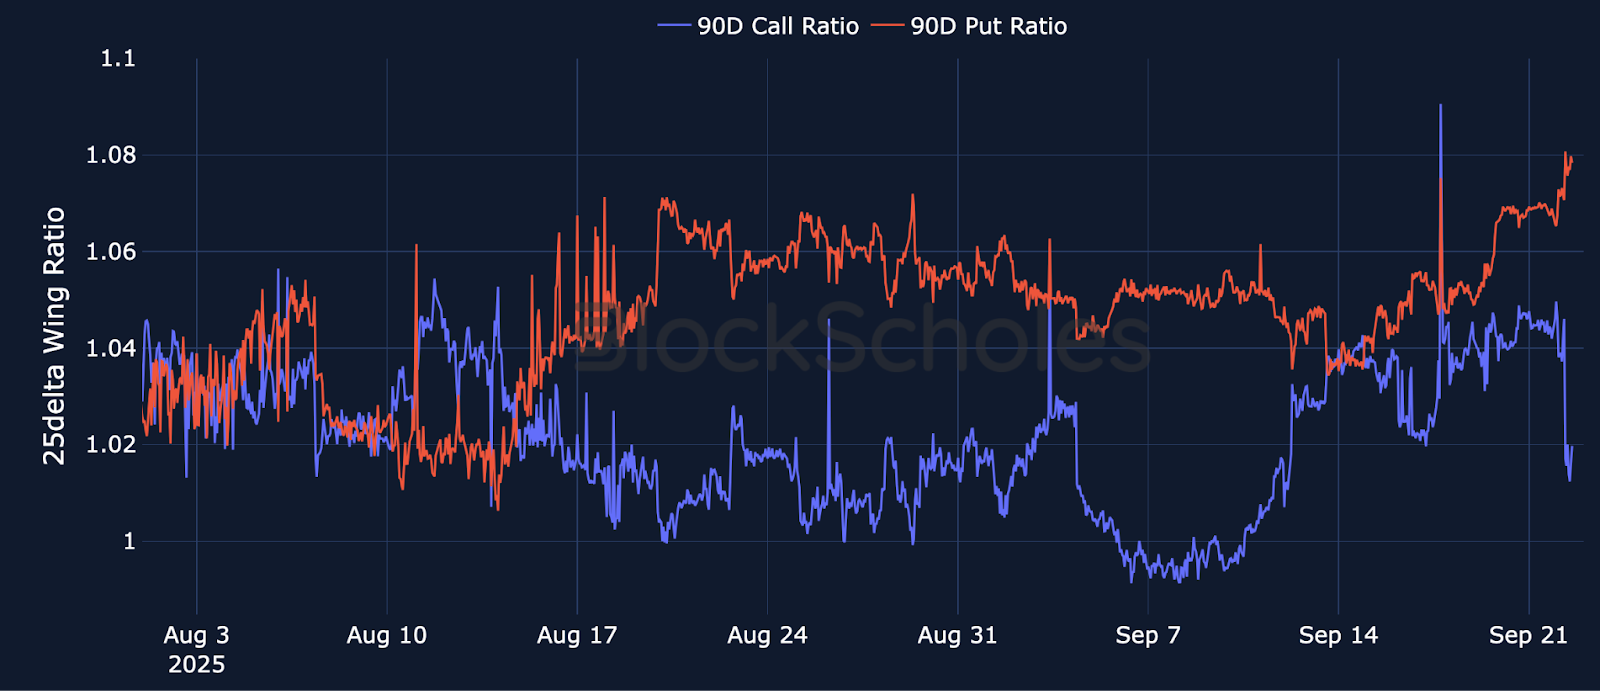
From Aug 14–18, 2025, the period over which BTC skew fell to as low as −12.3%, there was a notable increase in the put wing of the volatility smile, signaling a large demand from BTC traders to buy OTM puts relative to ATM, and driving up the implied volatility — and, therefore, the price of out-the-money put options. Around the same time, we saw a drop in the call wing ratio to near the level of the ATM.
A similar phenomenon is occurring now at a much more extreme level: the implied volatility for a 90-day tenor, 25-delta OTM put is trading at nearly 1.08 times that of the ATM (this is the highest premium assigned to longer-dated optionality since the tariff bearishness still lingering in May 2025). In addition, the premium assigned to upside exposure in similarly OTM call options at the same tenor has taken a sharp, decisive move downward at the beginning of the week.
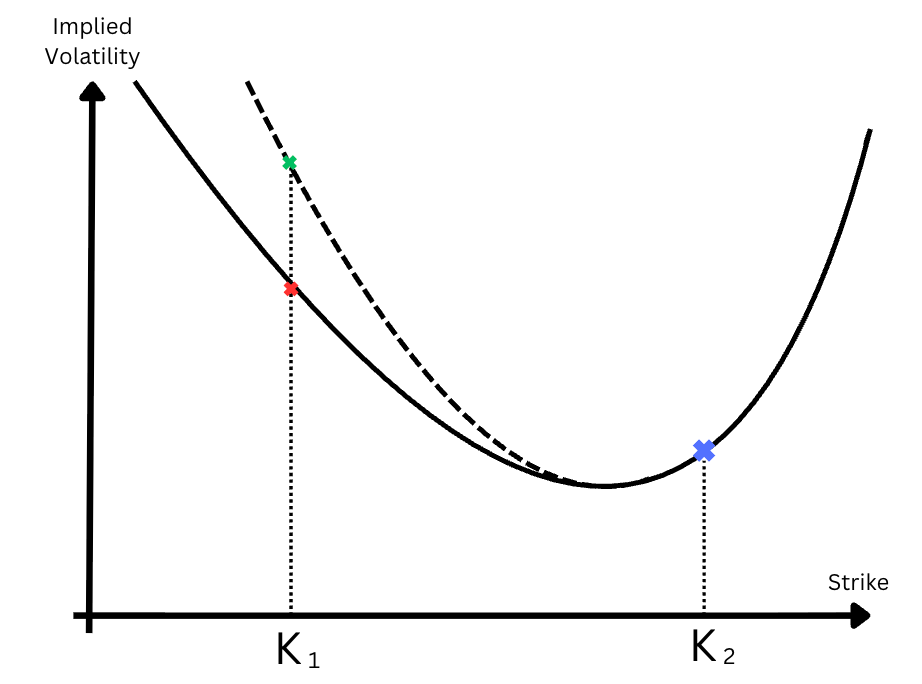
Put options are an obvious method for hedging against downside exposure. They provide a defined payoff in the case of a sell-off, in return for a fixed cost in the premium that's paid. However, downside protection — like put positions — can be made less expensive to enter in certain market conditions by giving up exposure to an even deeper sell-off.
The put spread consists of a long put position at a higher strike (close to the current price spot price of the underlying asset) and a short put position at a lower strike.
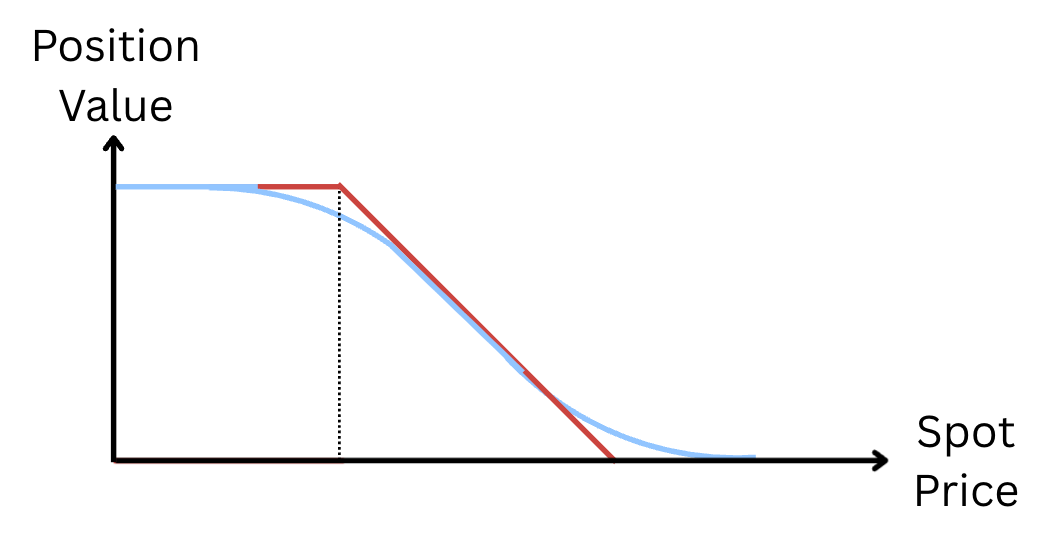
The long put position gives short exposure to the underlying asset, protecting against (or profiting from) a sell-off, while selling the OTM put at the lower strike reduces the cost of the downside exposure — at the expense of giving up protection when spot falls further than the lower strike.
The effect of cheapening the exposure is made stronger when the compensation from selling deep OTM put options is higher; we can read such cases from implied volatility data by tracking when the skew of the volatility smile is strongly toward OTM puts. A smile that skews more toward OTM puts indicates increased demand for downside protection, thereby offering a higher premium for selling options at that part of the smile.
For example, a 7-day tenor put position in ETH, struck at $4.5K and entered into on Sep 15, 2022, would have returned 220%, protecting against the Monday morning sell-off one week later (Sep 22, 2025), when ETH’s price fell as low as $4.15K. However, the premium collected from selling a deeper OTM put option struck at $4K would have cheapened the exposure. With the OTM put at $4K having expired worthless, the put spread would have instead increased the return to 262% of the invested capital.
Had ETH’s spot price instead fallen below $4K — causing the $4K put to expire ITM — the outright put position would have delivered a higher return, as the short put leg of the put spread would have capped the protection beyond the lower strike.
August and early September 2025 were dominated by several macro catalysts (tariff actions, labor softness, the CPI report, the Jackson Hole symposium and the Fed’s September rate decision), and yet crypto’s realized volatility broke to unusually low levels. Options markets priced implied volatility lower, too, but not low enough, as markets continue to assign a sizable premium to optionality that must resolve.
Option markets are also now pricing in stronger bearishness for BTC than ETH, as indicated by the stronger skew toward OTM puts in BTC options than for ETH at similar tenors. This divergence has come at a time when both markets are seeing a significant switch toward bearish positioning, despite BTC recording a new ATH spot price of $124K as recently as August 2025.

.jpg)
.jpg)