Thahbib Rahman
Research Analyst
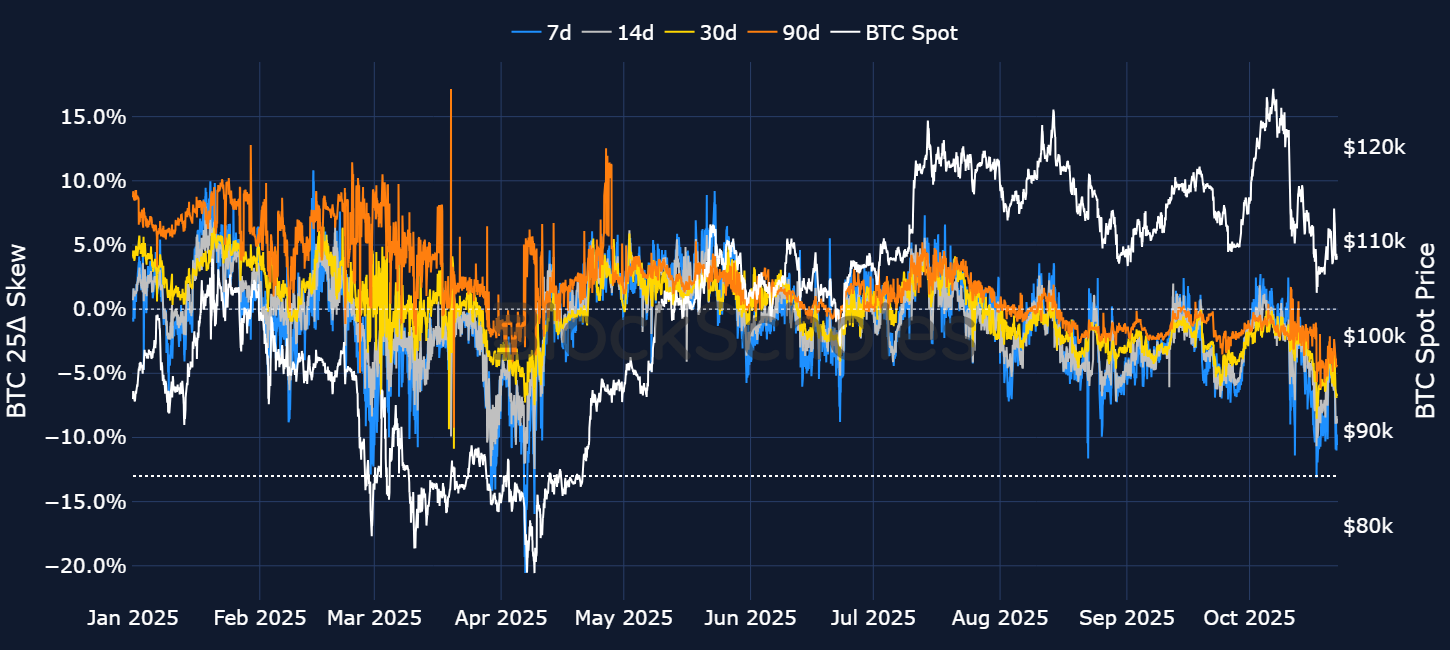
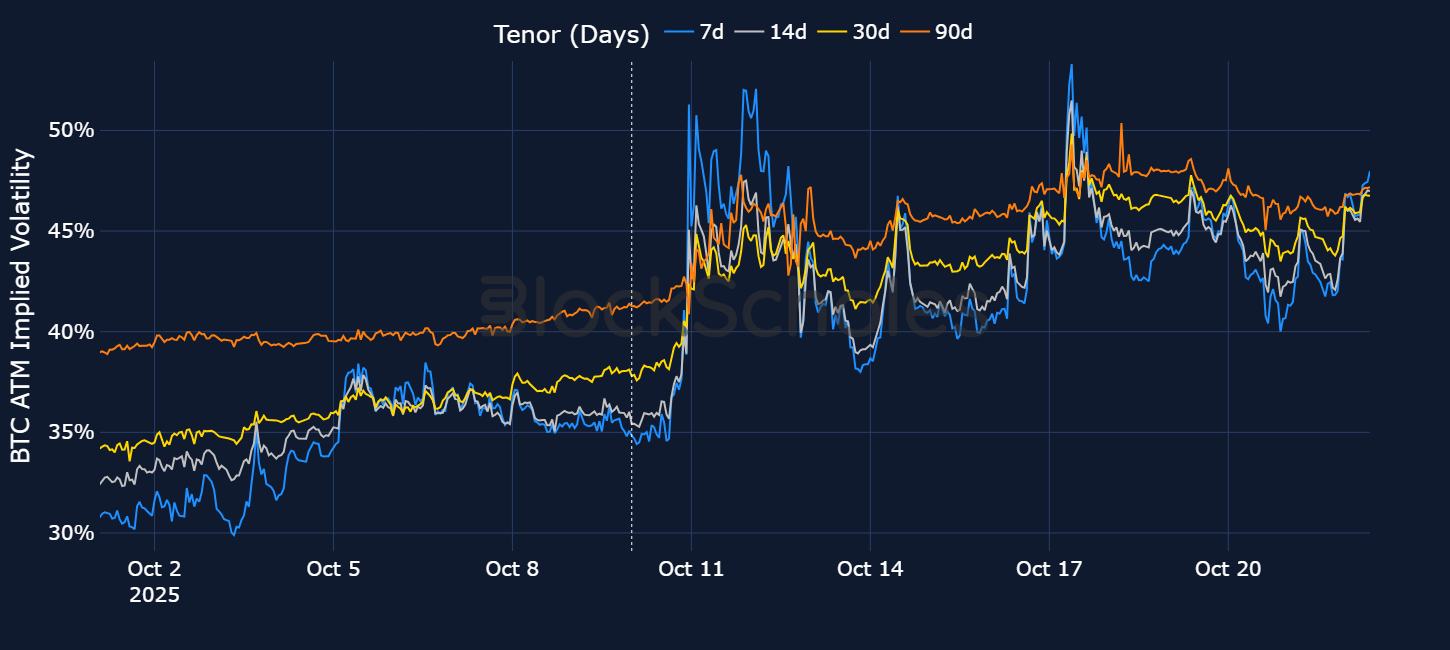
BTC volatility awakens from a long period of dormancy. After steadily declining since April, BTC’s implied volatility broke sharply higher in mid-October, following a $19B liquidation cascade — the largest in crypto’s history.

Since late April this year, our monthly volatility commentaries have highlighted the trend of BTC’s implied volatility falling toward its historical lows. Back in April, we described the state of the market as “Uncertainty high, volatility low.”
Looking back at the April-to-early-October period that has passed since that report, the first part of that comment proved to be an understatement. Macro uncertainty has continued to persist: Whether it's market speculation that US equities (which BTC is strongly correlated to) are overvalued, President Trump’s tariff volleyball or the shutdown of the US government and data blackout, markets have been rife with uncertainty. However, BTC’s implied volatility levels (the market’s expectation of future volatility) continued to eke lower. In fact, on Sep 19, 2025, 7-day ATM IV fell to its second-lowest level all year (25%).
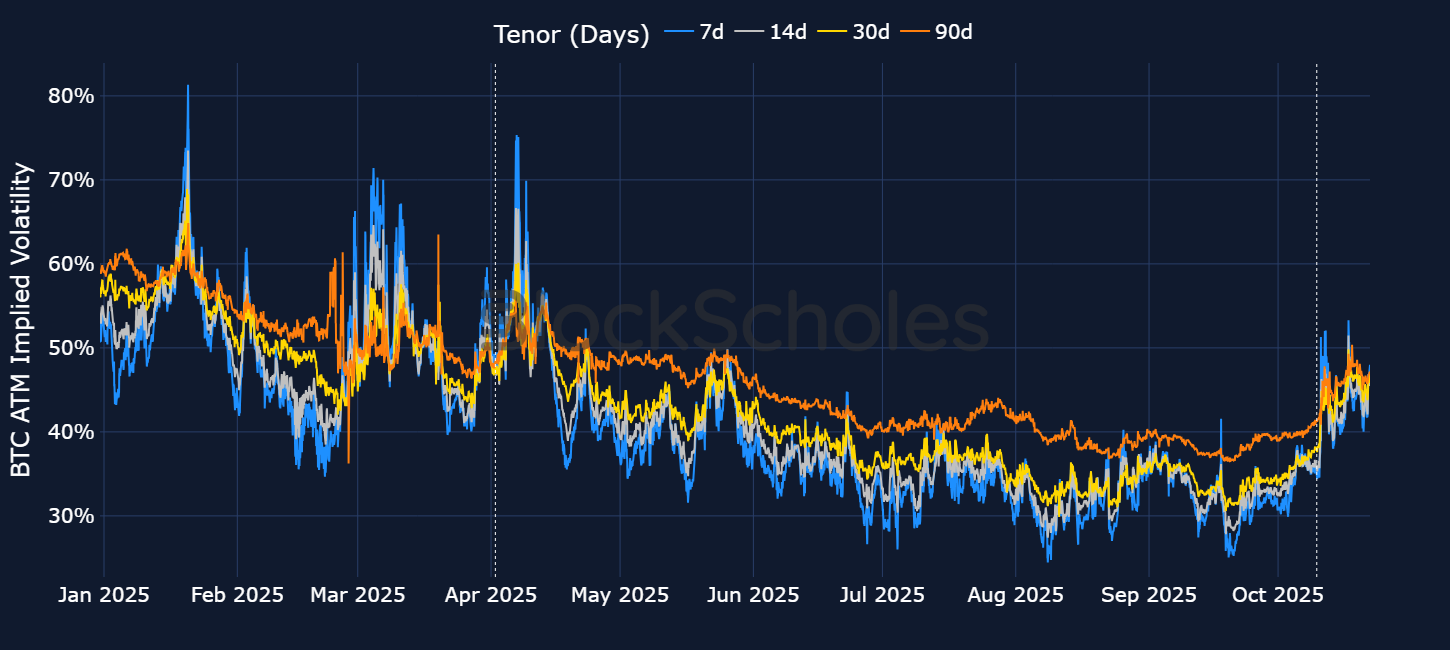
However, the low volatility trend has finally broken out, and aggressively, too. That was a result of a $19B liquidation in leveraged crypto asset positions, the largest in crypto’s still relatively nascent existence. The liquidation cascade occurred as crypto prices tumbled on Friday, Oct 10, 2025, following a reignition of the tit-for-tat trade war between the US and China. In response to new export controls on rare earth minerals from Beijing, President Trump responded that “the United States of America will impose a tariff of 100% on China, over and above any tariff that they are currently paying.” Trump’s message, combined with thinner liquidity as traditional equity markets closed for the weekend, fueled the obliteration of leveraged positions.
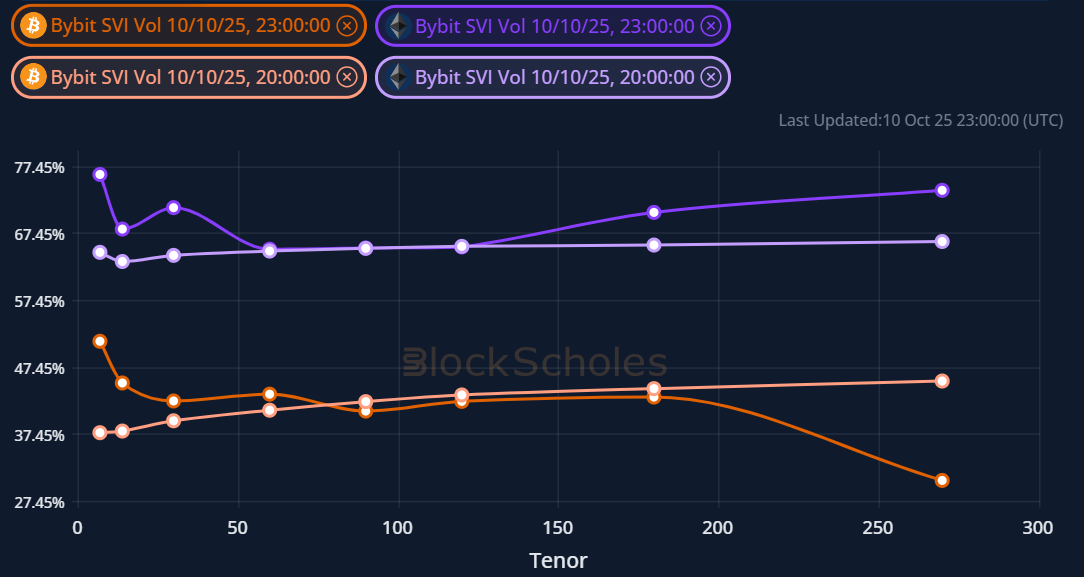
Shortly after the announcement, BTC’s term structure of volatility saw its first significant inversion since April 2025. An inverted term structure of volatility means that long-dated expirations trade at a lower implied volatility than short-tenor options — an indication of heightened uncertainty in the short term from options traders.
However, while the front end of the term structure outperformed, Trump’s announcement did drive ATM IV levels significantly higher across the whole term structure. That’s notable because he has shown a tendency to walk back on large tariff announcements (a phrase referred to as TACO). However, options markets were taking no chances, with volatility spiking even for far longer-dated tenors.
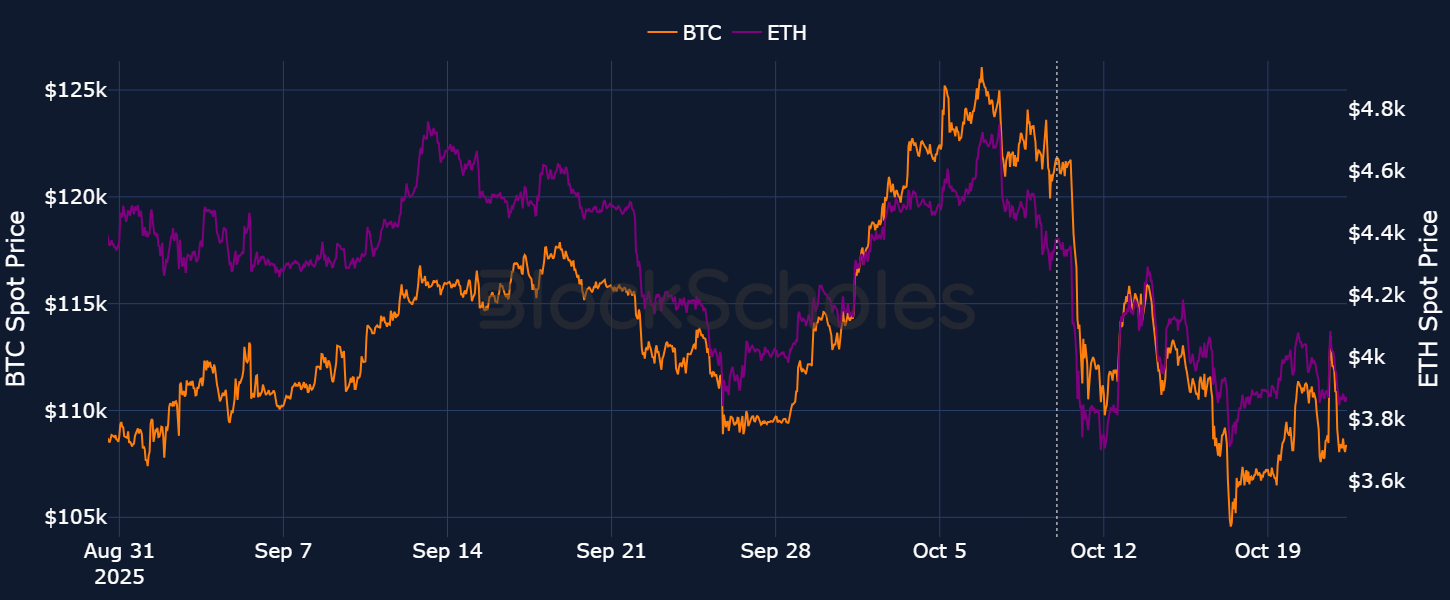
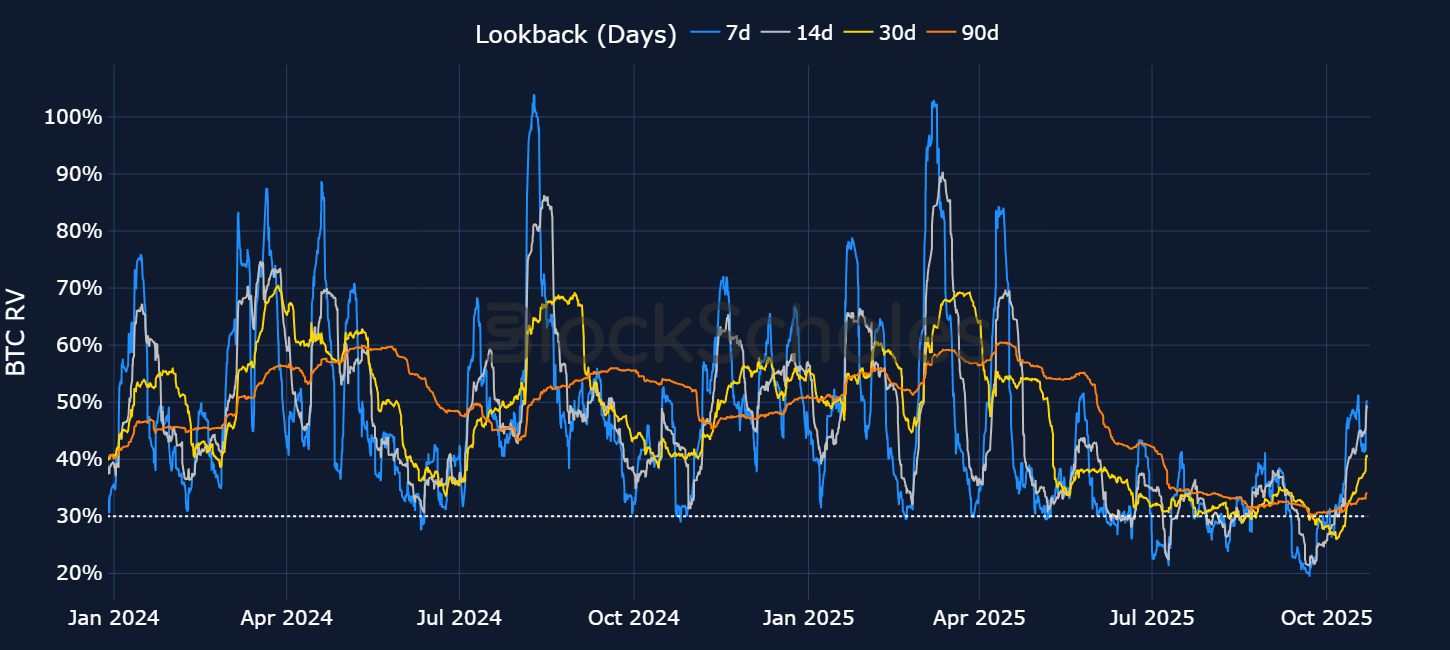
The sharp increase in implied volatility followed a significant spike higher in realized volatility. That jump in delivered volatility reflected the plunge lower in spot prices — BTC had a wick as low as $105K and ETH had one as low as $3,700 — before both majors erratically jumped back up, only to sell off once more through the panic. In turn, 7-day realized volatility rose to its highest level since April 2025.
Also noteworthy is that, despite the fact that realized volatility has (as yet) not sustained its higher level for very long, longer-tenor BTC options are still trading at elevated IV levels. Either longer-dated options traders are correct and realized volatility will remain higher, or options traders will ultimately price out the elevated longer-tenor levels.
Looking deeper into options positioning around the October tariff event reveals the depth and extent of traders’ turn to bearishness. Similar to the extreme levels not seen since April 2025 in realized and implied volatility, the volatility smile for 7-day options commanded the largest premium for out-the-money put optionality (also since April 2025), with OTM puts trading at a 13% volatility premium to calls.
We can compare the drivers of the bearish positioning at different tenors by looking at the wings of the volatility smile, relative to the middle of the smile (the ATM level). Below, we plot the difference in the implied volatility between a 25-delta 7-day call option and the ATM IV (blue), and the implied volatility of a 25-delta 7-day put option and the ATM IV level (red). A value above 1 for the blue or red line indicates 25-delta calls or puts trading richer than options struck at-the-money.

For short-tenor options, we see the put ratio explode upward on Oct 10, 2025, an indication of the immense, outsized demand for protection during the sell-off, accompanied by a major drop in the price of call optionality. Together, the two suggest that traders were very unwilling to purchase upside exposure in the sell-off, and rushed to purchase short-dated puts, resulting in an IV blowout at the front end and a significant deterioration in the put-call skew ratio.
If we compare this to positioning for longer-dated maturities, we find a similar spike in the demand for put options. However, that quickly reverted back to the levels it had jumped from (failing to remain elevated, as was the case at the front end).

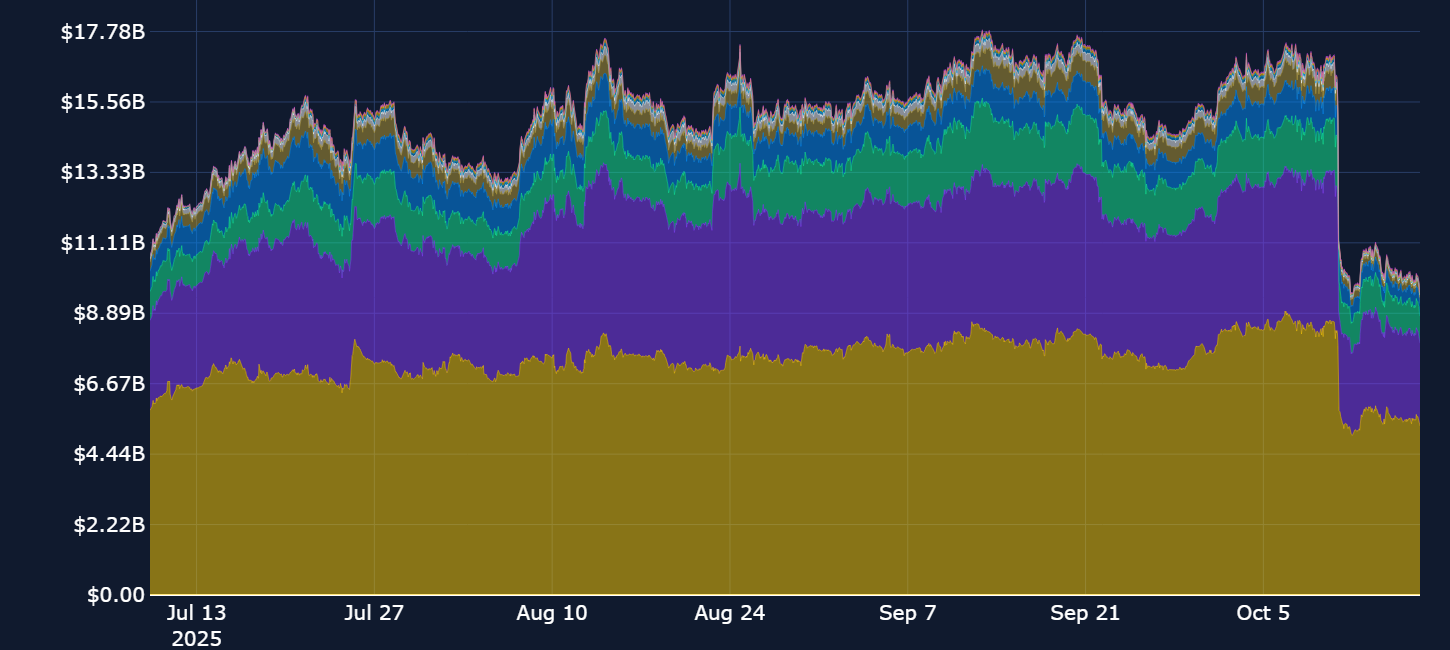
Additionally, perpetual futures markets provide another perspective on the nature and depth of the sell-off. The flushout in leveraged positions following Trump’s reignited trade war with China has resulted in a complete collapse in open interest. Bybit’s perp traders appear unwilling (so far) to re-enter new leveraged positions. Other notable periods of open interest capitulation — such as August 2024, amid the yen carry trade unwind or Aug 17, 2023, when a large leverage wipeout occurred during the Fed hiking cycle — don’t come close to the most recent October liquidation.
Throughout recent history, options traders have almost always priced a higher premium in ETH options than they have in BTC. Over the past year, we’ve seen a steepening of the ratio between ETH at-the-money implied volatility levels, relative to BTC’s levels at the same tenors. In August, that ratio peaked at 2.6 for 7-day options — that is, ETH options traded with an implied volatility 2.6 times higher than for BTC options. That steepening has largely been a result of BTC derivatives traders’ reluctance to push implied volatility levels higher, while ETH options continued to invert through macro events or through idiosyncratic drivers (such as in May and July, when ETH’s spot price majorly outperformed BTC’s).
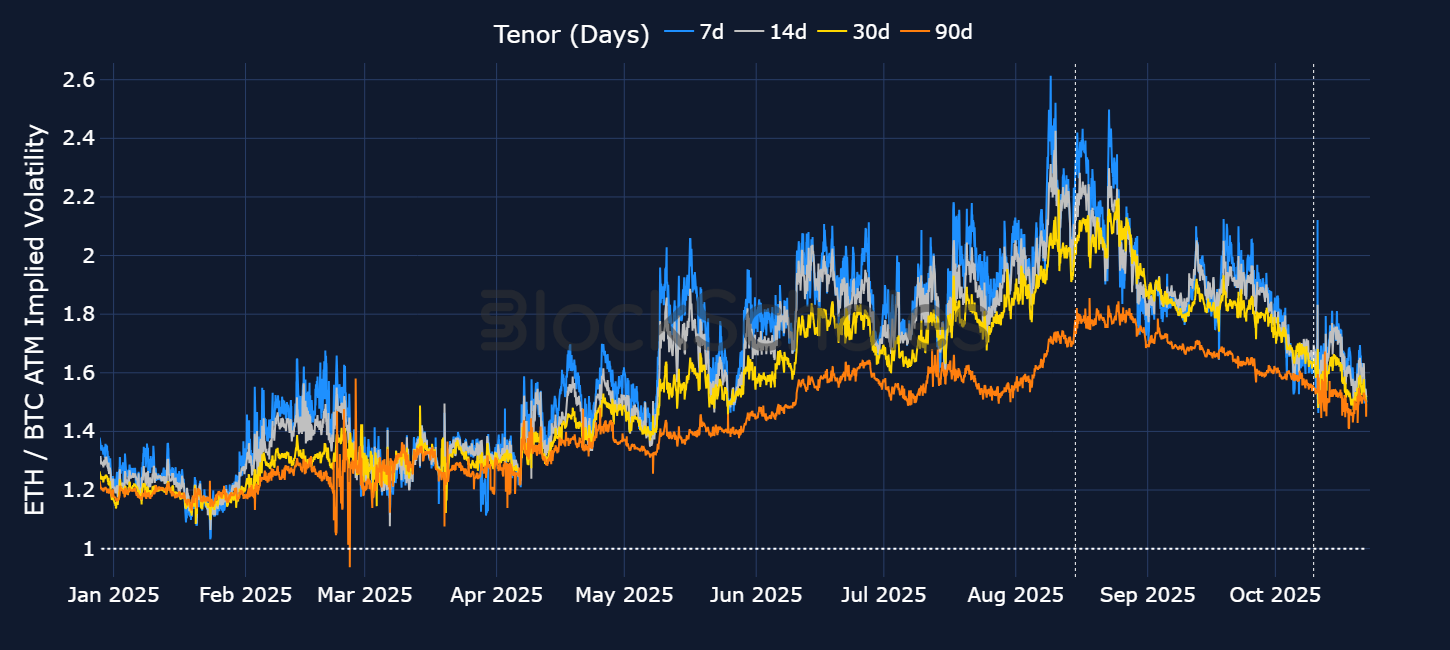
That trend began to partly resolve from mid-August to early October (before the tariff announcement), as ETH’s implied volatility marginally fell lower, while BTC’s implied volatility remained close to its historic lows of 30%.

However, the October tariff turmoil resulted in a temporary increase in the spread of ETH implied volatility above BTC’s level of implied volatility, though not to the same levels as the August highs. That’s because those previous highs were a result of ETH’s volatility jumping up significantly in response to a macro event, with BTC’s volatility largely having a non-reaction, or a reaction not large enough to incite an inversion. However, this time around, we saw a dramatic increase in both ETH’s and BTC’s short-tenor optionality, just at a lower level for BTC than ETH.

The story of a months-long decline in BTC volatility, only for a sudden and violent breakout in Q4 to occur, reminds us of the 2023 volatility lull. The first three quarters of that year were characterized by a sideways slog/modest recovery in spot prices, with BTC trading at around $30K. That followed the major sell-off and bear market of late 2021 into 2022.
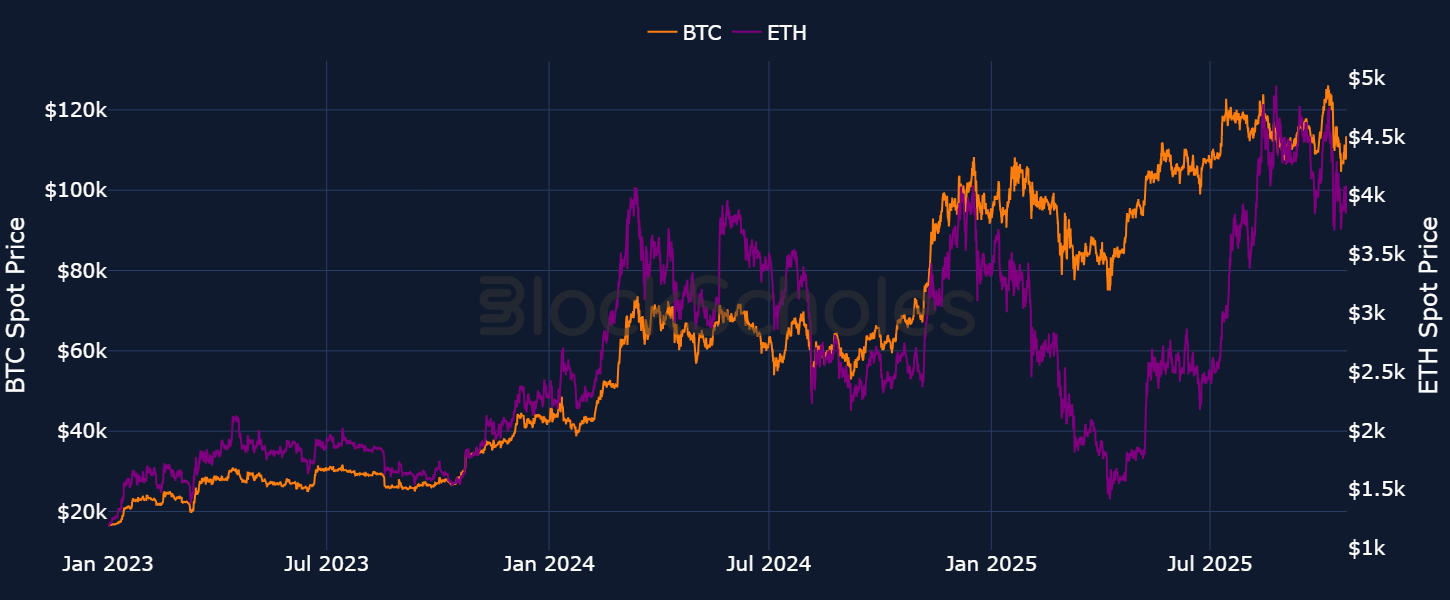
The rangebound price action meant a summer of historically low realized volatility, with the implied volatility of one-week BTC contracts bottoming out at just 20% in August 2023. However, October 2023 marked the turnaround in the fortunes of crypto holders. Speculation of the soon-to-launch Bitcoin Spot ETFs saw many traders attempting to front-run the announcement, and BTC’s price broke out from $25K to $35K. That formed the beginning of a rally which would extend until March 2024, when BTC temporarily peaked above $70K.

The sentiment change in October 2023 resulted in the highest levels of ATM implied volatility across BTC options since May of that same year, a significant recovery in volatility levels from the August and September lows. Therefore, the October 2023 breakout in volatility shares some similar traits with the most recent 2025 October breakout. The cause of the trend reversal, however, is distinctively different, as the slow, sideways drift lower in ATM volatility in 2023 and its sudden spike higher was due to traders pricing in a bullish event for BTC, driving both price and forward-looking volatility expectations higher. The October 2025 volatility reversal, on the other hand, was triggered by a major bearish sell-off in risk-on sentiment and macro uncertainty.

October saw a sharp, sudden sell-off in crypto asset spot prices in response to unexpected macroeconomic uncertainty. This resulted in the largest liquidation event in crypto history as traders found their positions underwater. However, volatility is part-and-parcel of trading, and if harnessed correctly it can be a benefit to traders — instead of something to be feared.
Periods of sharp market repricing can reward traders who are positioned not for direction, but for movement itself. By using a straddle — a combination of a call option and a put option struck at the same strike, with the same expiration date — traders can take a view not on the direction of the underlying, but on its volatility. The position benefits from the spot price moving far enough before expiration (either up or down) in order for the payout to exceed the premia paid for the two options at entry.
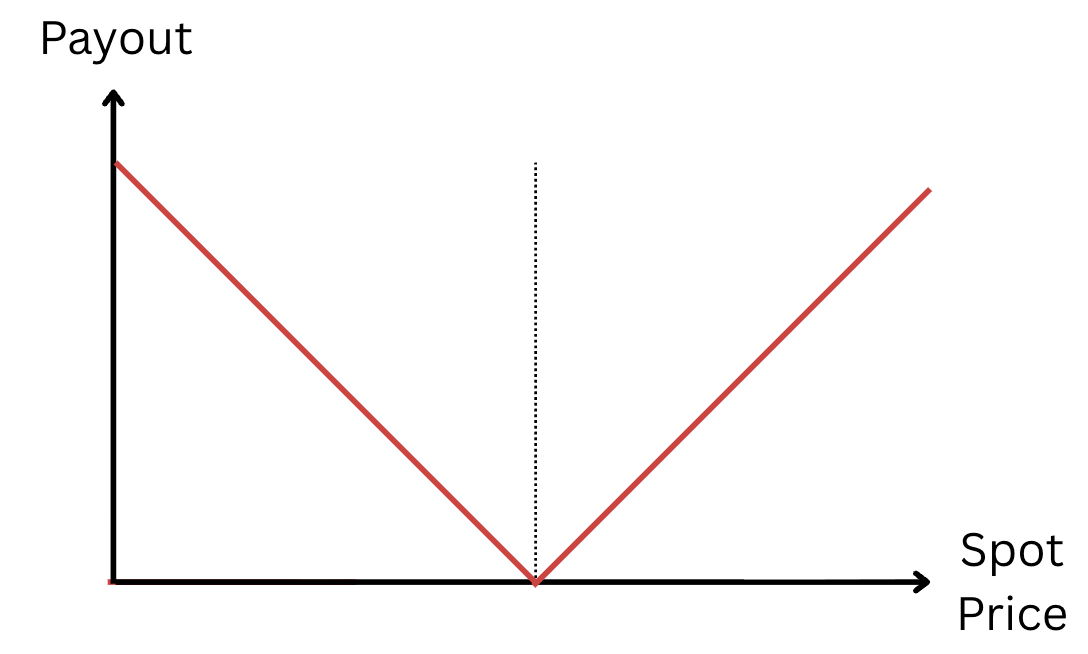
As the position requires taking a long position in both a call and a put option, the strategy is most effective when volatility (the key determinant in an options price) is low and spot prices move far from the strike before expiration. Those are exactly the conditions that preceded the sharp correction lower in spot prices in early October.
For example, a 7-day tenor straddle in BTC, struck at $120K and entered on Oct 5, 2025, would have cost $5,098 in total premium. On Oct 19, 2025, with BTC trading at $110K, the position would have expired with a payout of $9,221 (due to the ITM put and OTM call), resulting in a net profit to the trader. However, had the sharp sell-off instead not materialized, and BTC’s spot price expired within a range of $114.9K–$125K, the short-dated straddle would have expired at a loss to the trader, who would have overpaid for the volatility that was ultimately delivered.
The October 2025 liquidation event not only marked the largest deleveraging event in crypto history, but served as a stark reminder that BTC’s volatility can abruptly awake from a long period of dormancy. Triggered initially by the reignition of US-China trade war tensions, the cascade of liquidations and a major spot market blowup drove 7-day BTC ATM implied volatility upward of 50%. That resulted in the first inversion of the term structure for BTC since April 2025. As traders rushed to hedge against further downside price action, BTC’s put-call skew ratio sharply priced in a 13% volatility premium toward OTM puts over call options.
The last time we saw such a long stretch of subdued volatility was back in 2023 — which, incidentally. saw a breakout from that low volatility regime, also in October. Unlike that case, this month's volatility breakout was sparked by macro risk aversion and not by bullish drivers. Nonetheless, this month’s volatility can be a beneficial driver of gains for options traders if used correctly. A 7-day straddle in BTC, entered into prior to President Trump’s out-of-hours tariff announcement, would have expired with a significant payout for a trader who exited the position the following week. However, long-volatility positions are rarely timed so well, and are beholden to the volatility that’s delivered compared to that implied by the option’s premium.


.jpg)
.jpg)