Thahbib Rahman
Research Analyst
The past week saw far fewer relief rallies in spot price than the week that preceded it. Instead, BTC plunged from $105K all the way down past $82K. Not only did that wipe out all of its year-to-date gains, but it also meant the average ETF investor is now firmly underwater, with the average entry price circa $89K. The move lower in spot price accelerated over the past 24 hours following a stronger-than-expected September jobs report and an announcement from the BLS that there will be no October report – both pieces of news the market has taken as a sign the Fed may not need to cut rates in December. Options markets reacted as expected: short-tenor volatility has exploded higher at the front end of the term structure following a move in realized volatility and traders priced in a significant premium for short-dated bearish put options.

The past week saw far fewer relief rallies in spot price than the week that preceded it. Instead, BTC plunged from $105K all the way down past $82K. Not only did that wipe out all of its year-to-date gains, but it also meant the average ETF investor is now firmly underwater, with the average entry price circa $89K. The move lower in spot price accelerated over the past 24 hours following a stronger-than-expected September jobs report and an announcement from the BLS that there will be no October report – both pieces of news the market has taken as a sign the Fed may not need to cut rates in December. Options markets reacted as expected: short-tenor volatility has exploded higher at the front end of the term structure following a move in realized volatility and traders priced in a significant premium for short-dated bearish put options.
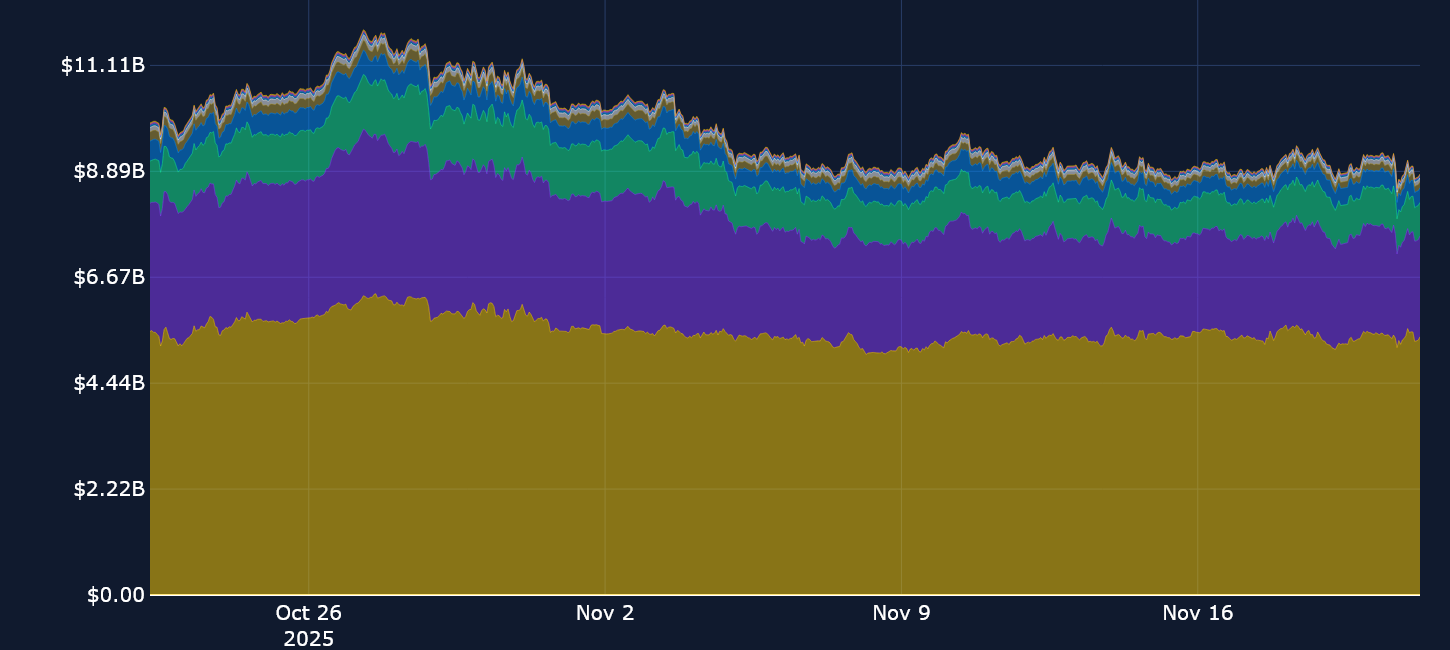
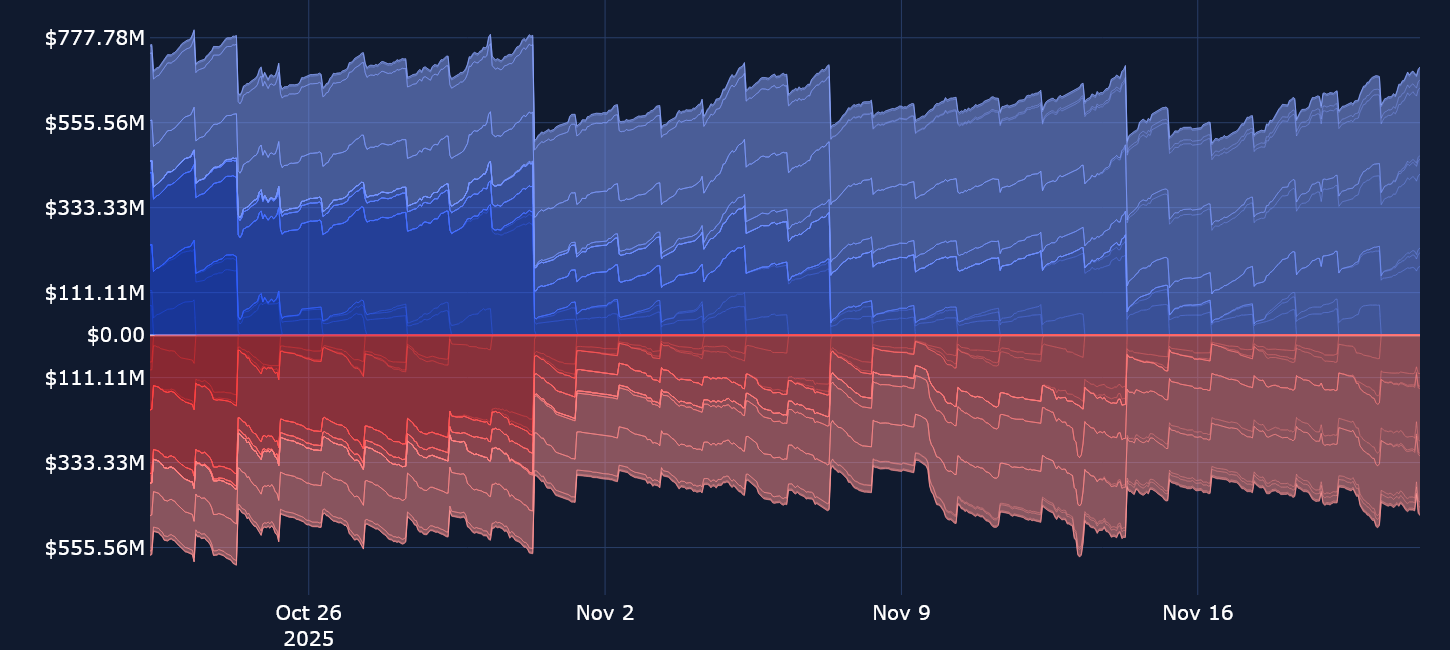
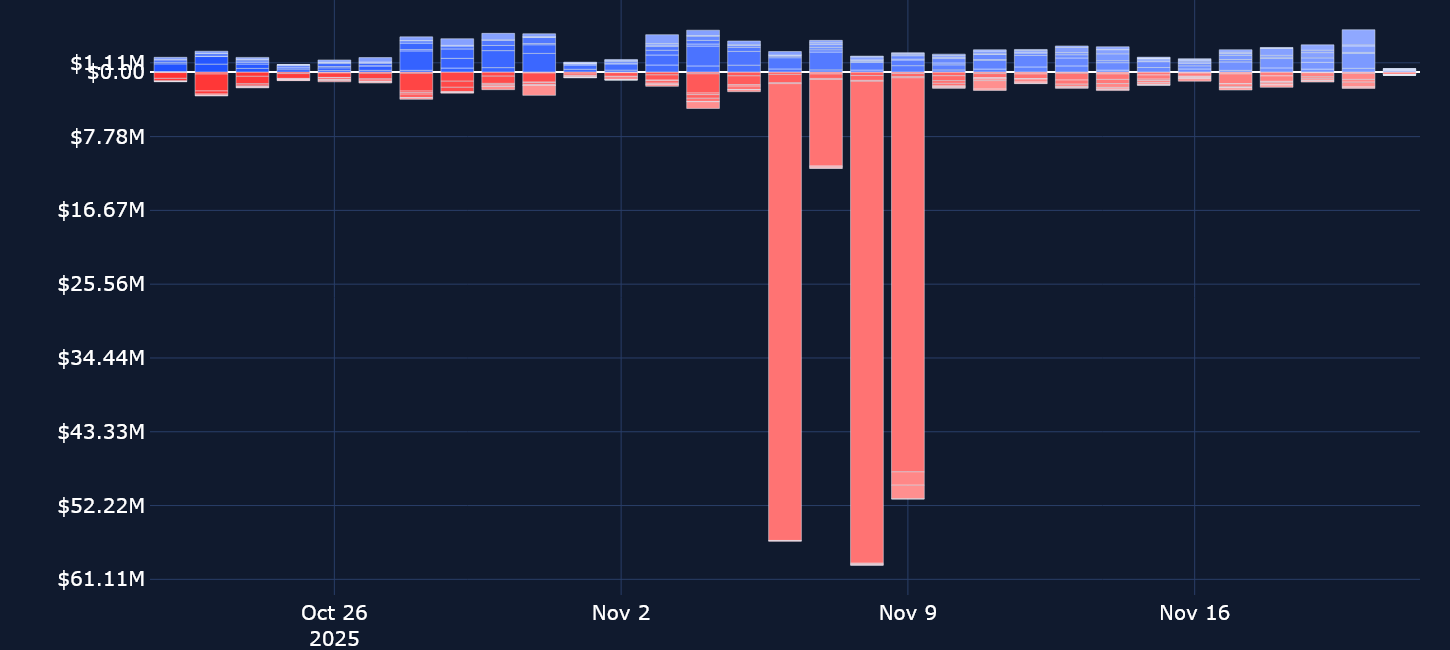
Perpetuals: Open interest in leveraged swap contracts remains far from optimistic, and has moved sideways around $9B for the past week, nearly half the notional value prior to the Oct 10, 2025 leverage unwind.
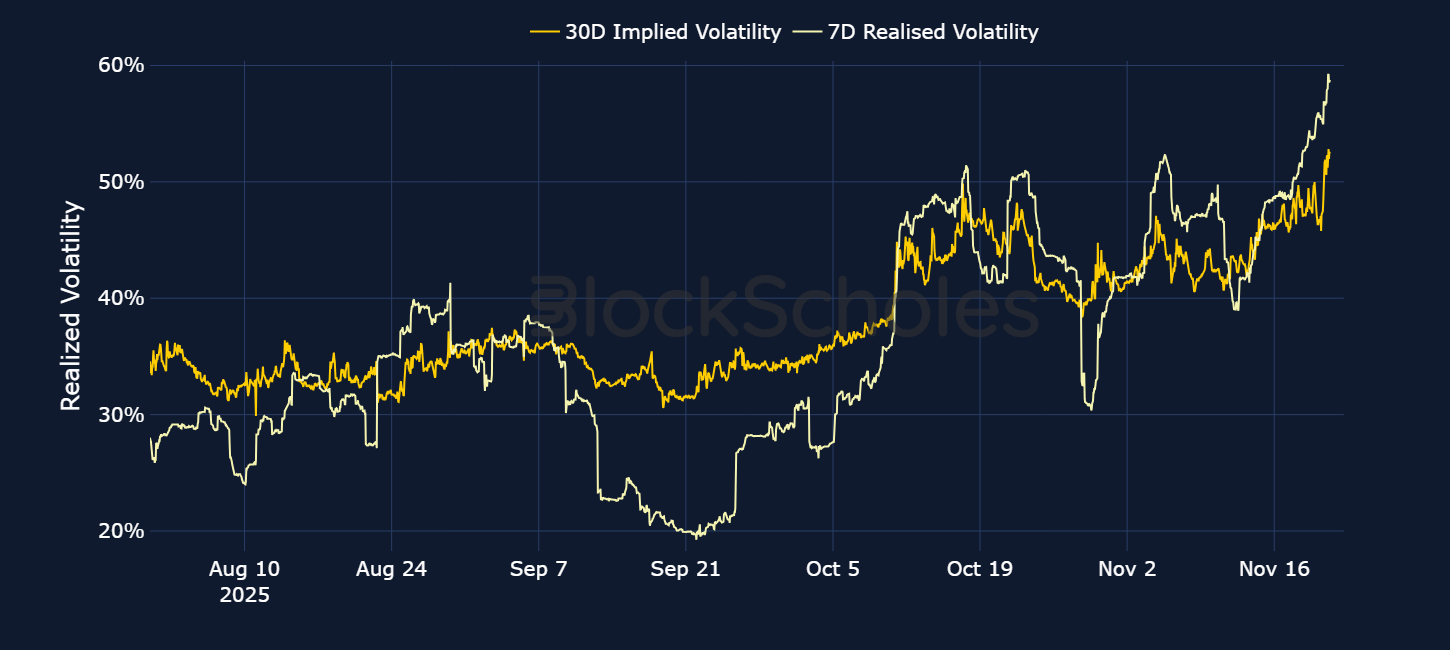
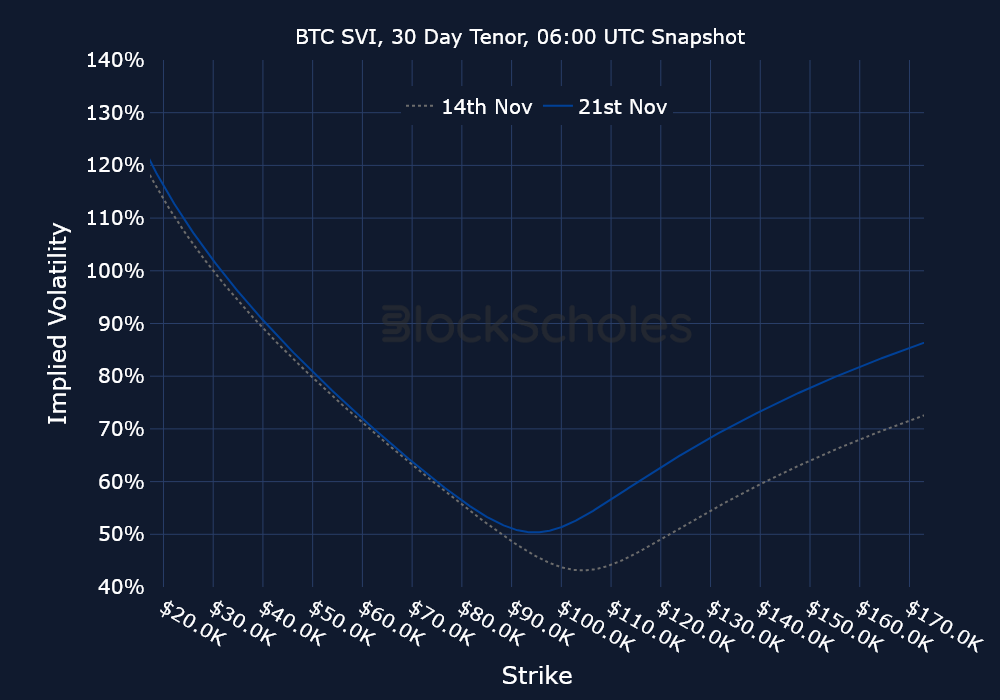
Options: Implied volatility levels for BTC and ETH is now higher than the peak reached following the Oct 10, 2025 meltdown, resulting in a firmly inverted term structure for BTC and ETH.

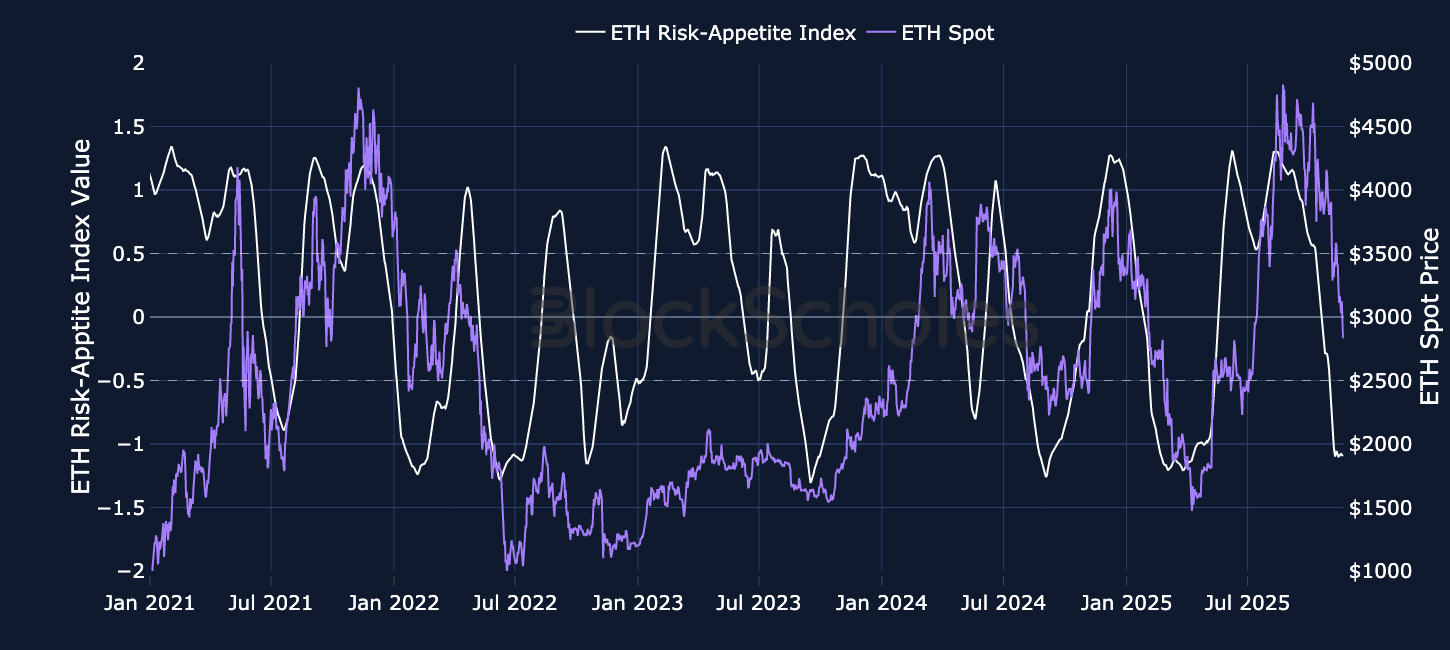
Block Scholes’ Risk Appetite Index measures the level of euphoria (above 1) or panic (below -1) in the spot market. Momentum in this index shows a strong relationship to spot returns.
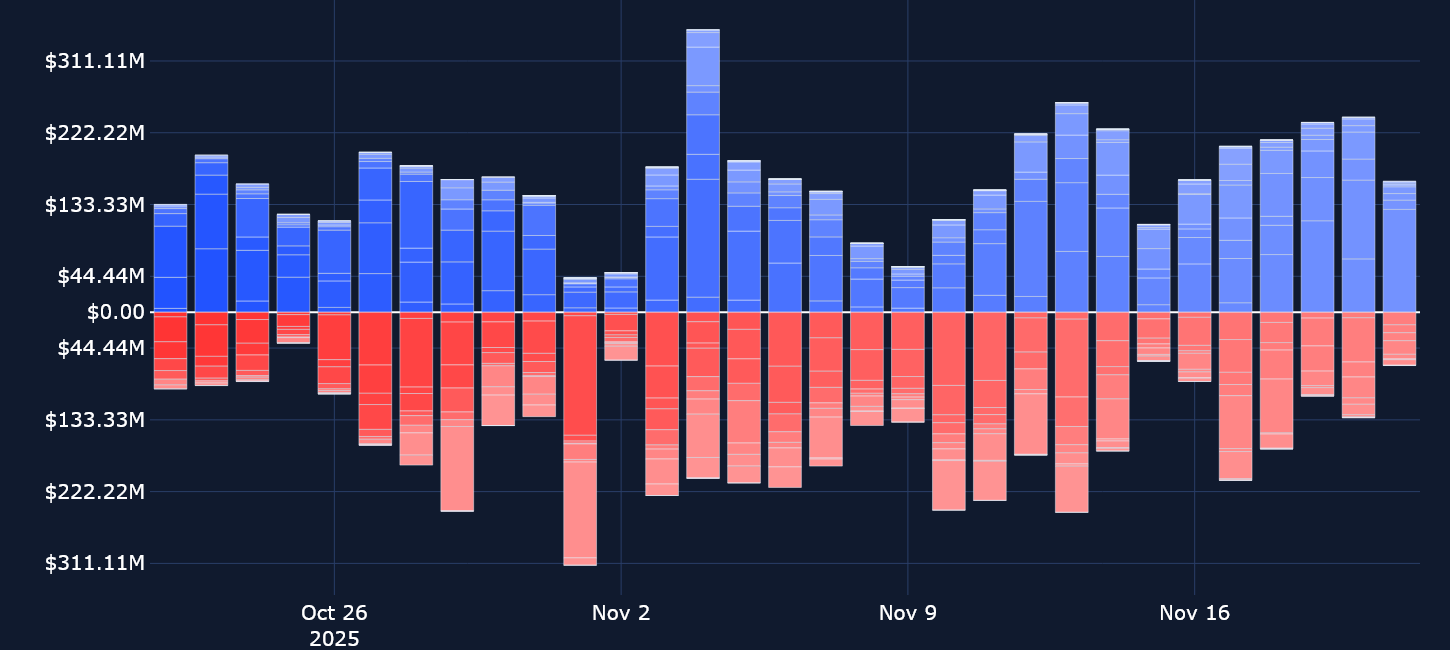
Since the Oct 10, 2025 leverage unwind, further legs lower in spot prices has seen a further fall in the open interest of large-cap perpetual swap contracts. More than a month later, we still find continued evidence of subdued appetite from retail Bybit traders to reopen the positions that were closed in early October.
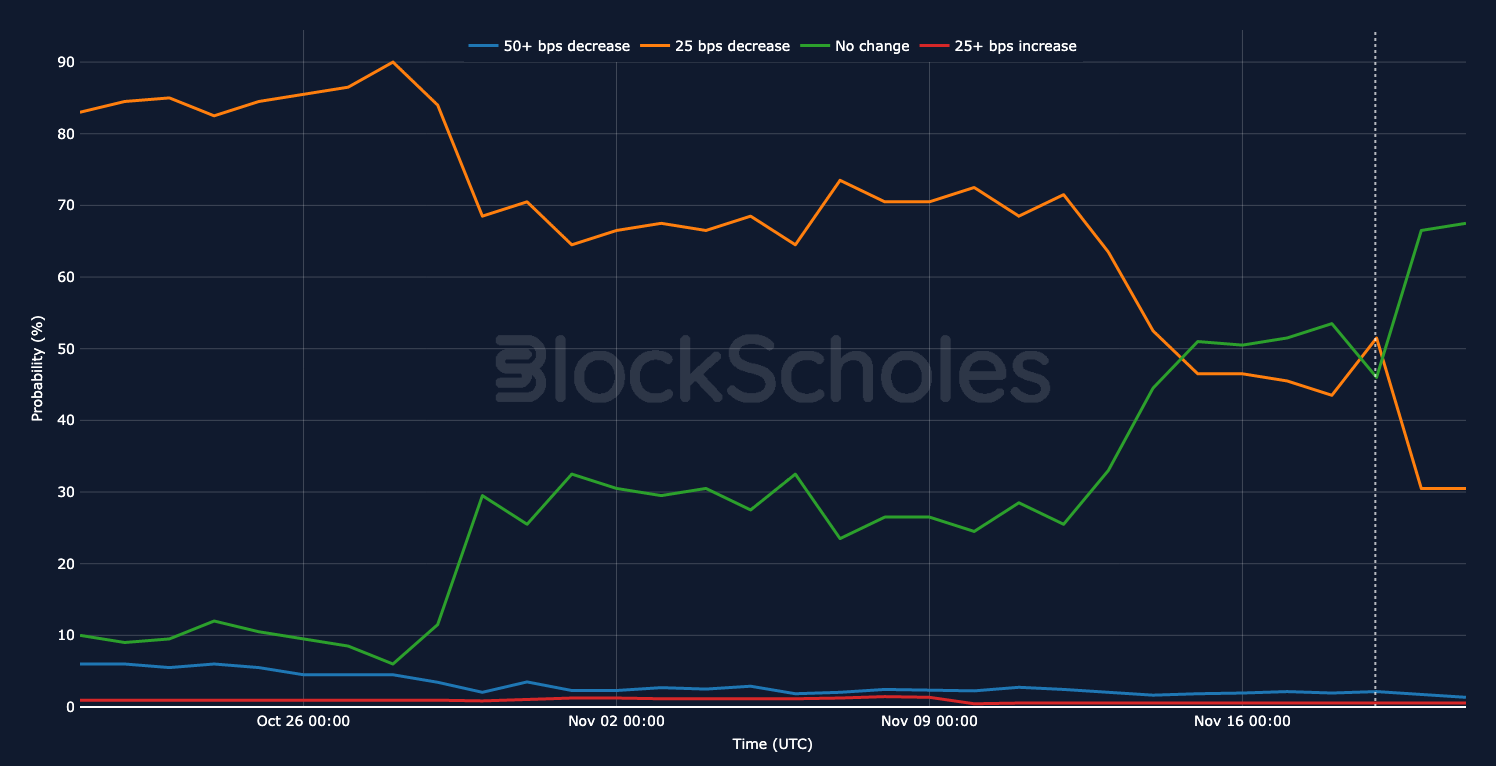
Open interest in the tracked tokens below has moved sideways around $9B and far lower than the $16B in notional positions prior to Oct 10, 2025. The lack of interest to re-open leveraged positions is not surprising. Following yesterday’s (Thursday, Nov 20) NFP report (which showed 119K jobs added by the US economy in September, against expectations of 50K, along with a slight tick up in the unemployment rate), risk-assets including BTC and US equities sharply repriced lower. That’s due to a stronger-than-expected jobs print which suggests the Fed may not need to cut rates in December as well as the BLS announcing a lack of an October jobs report, adding to the data blackout at the Fed. Fed funds futures now point to just a 40% chance of a December rate cut, far below the near-certain odds accorded a month ago.
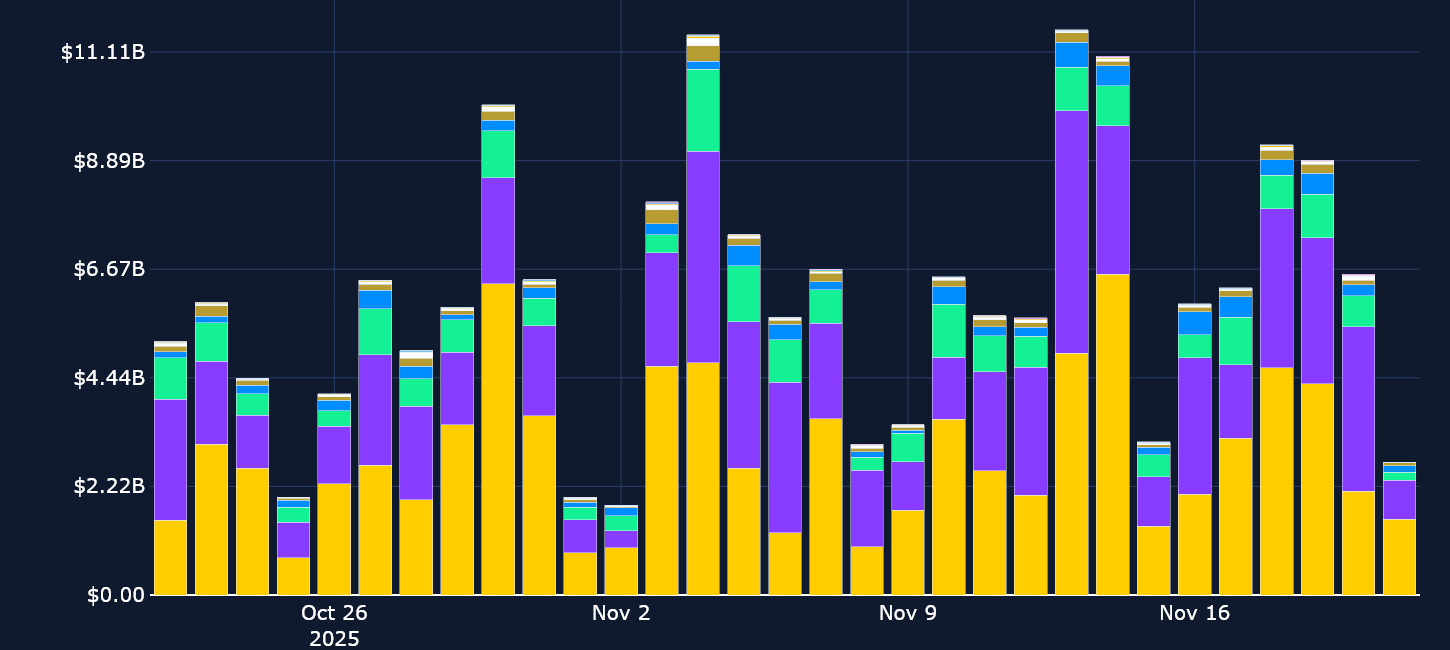
BTC is currently trading close to $83K, down 33% from its all-time high in October, while a slew of the large blue-chip tokens are down 30-50% from their respective all-time highs. Drawdowns of these magnitudes provide some context as to why traders are choosing to remain on the side-lines. Interestingly, despite the recent pullbacks in spot price, first to $95K then $90K and now towards April 2025 lows, we haven’t seen a big drop in open interest, suggesting these selloffs may be more attributed to the spot market, and not leveraged positions.
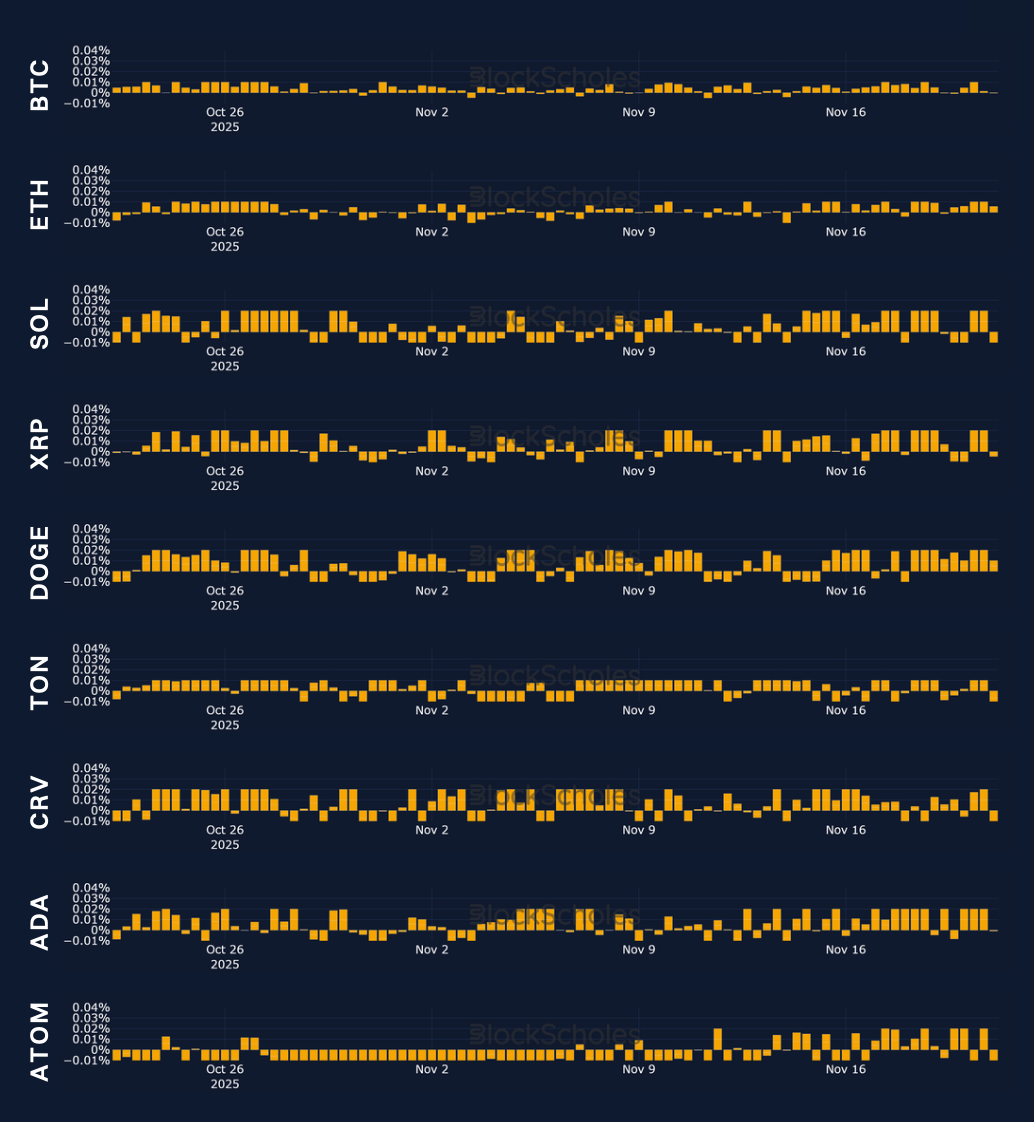
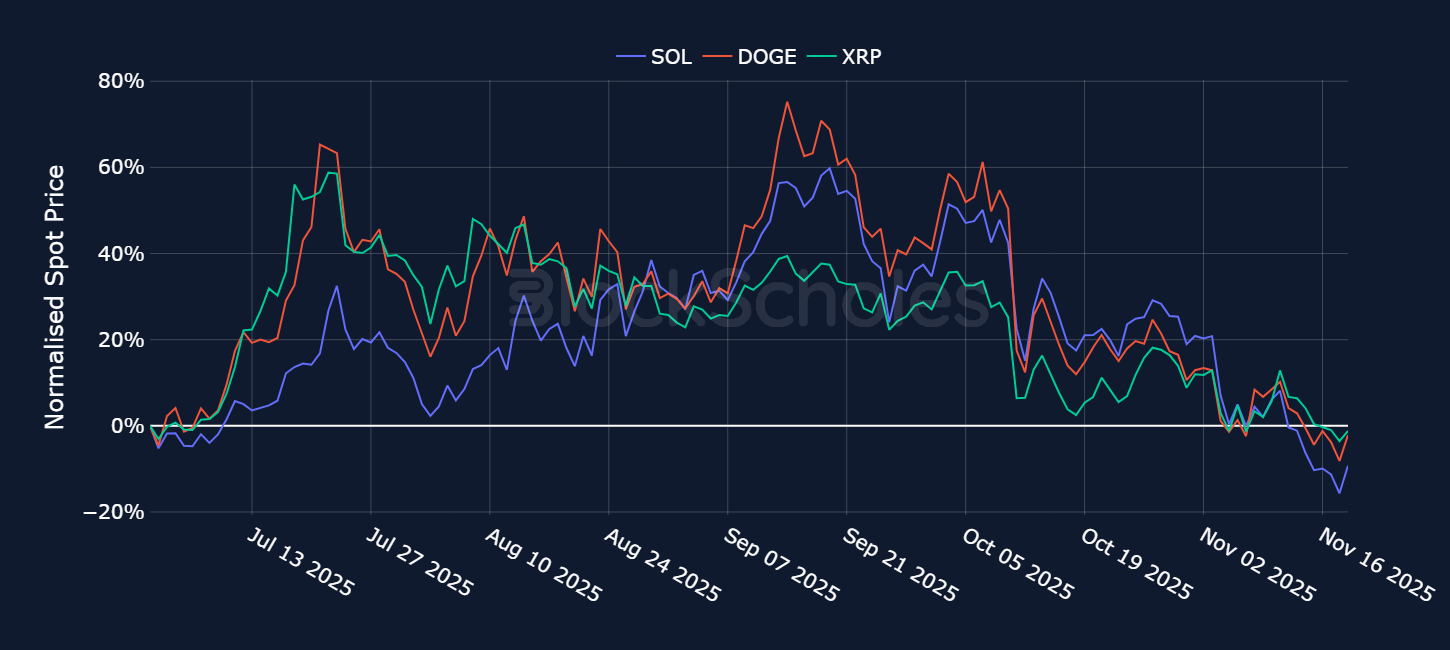
Earlier in the week an interesting phenomenon played out between BTC and altcoins. BTC dominance (including stablecoins) declined from 59.57% to 55.75%, with only a modest increase in stablecoin market-cap. That suggested that while BTC had been falling, the total market cap of altcoins had been falling at a slower rate. The most recent meltdown over the past 24 hours however, which saw BTC drop to $82K, has seen a return back to the trend we’re used to – altcoins performing even worse than BTC when BTC crashes lower. ETH, SOL and XRP are all currently down more than 10% over the past 24 hours, while BTC is down closer to 8%. The earlier resilience of altcoins was somewhat reflected in the funding rates of the large cap altcoin tokens. ETH, SOL and XRP all traded with mostly positive funding rates, a modest indication that traders had been willing to take some long-exposure via the perp. However, the most recent meltdown lower has bolstered a negative funding rate for SOL and XRP, though not yet for ETH.
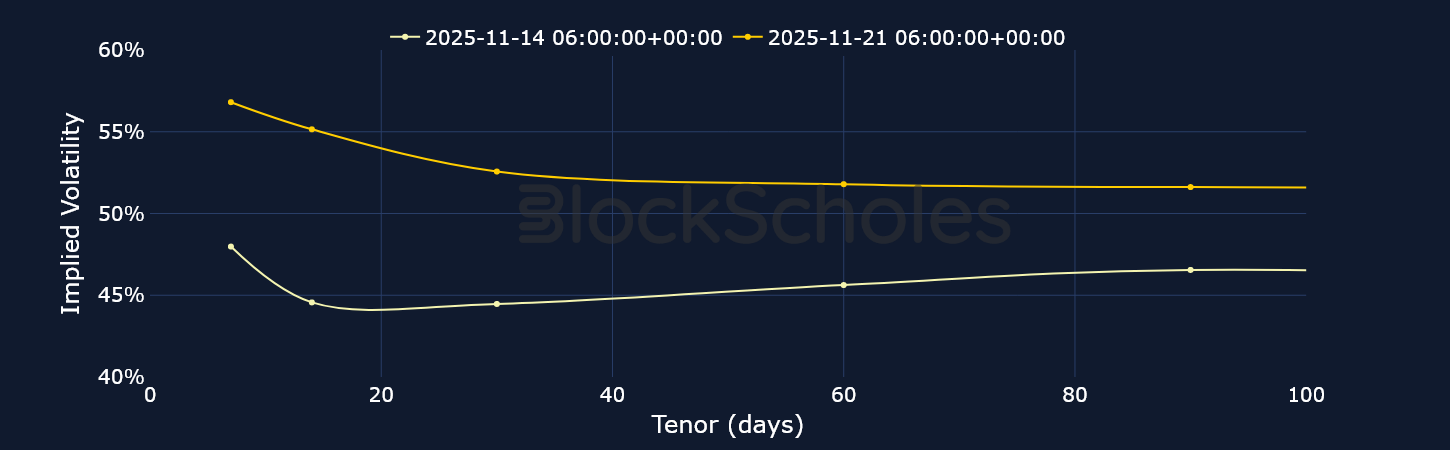
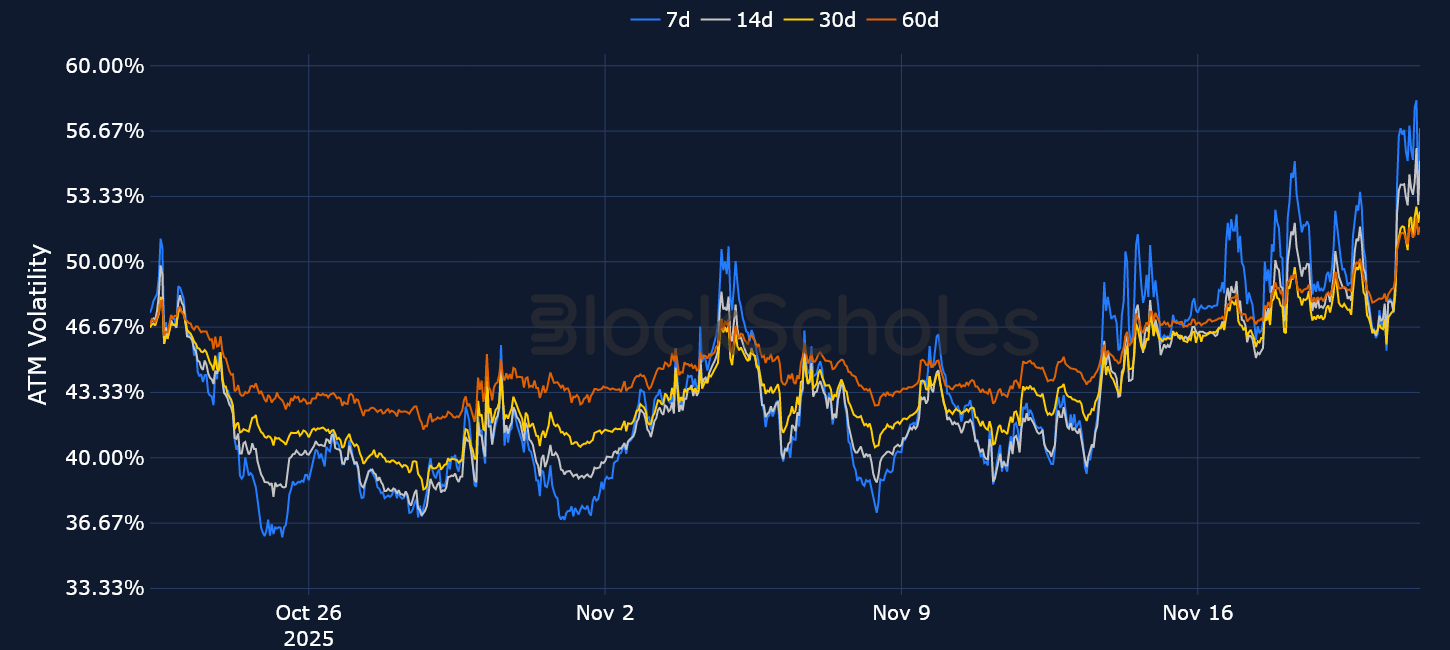
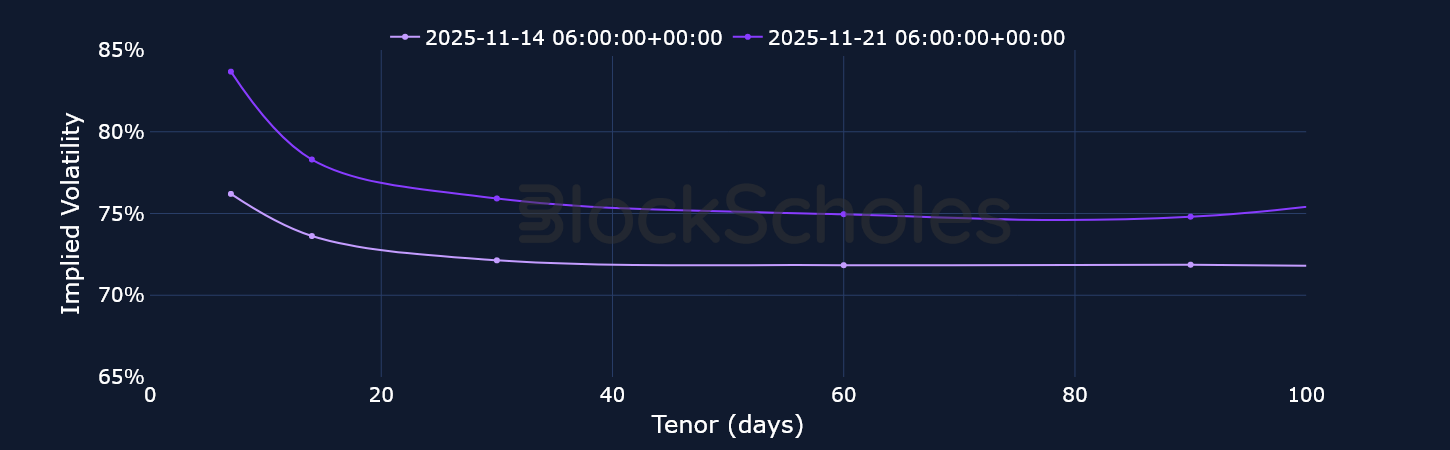
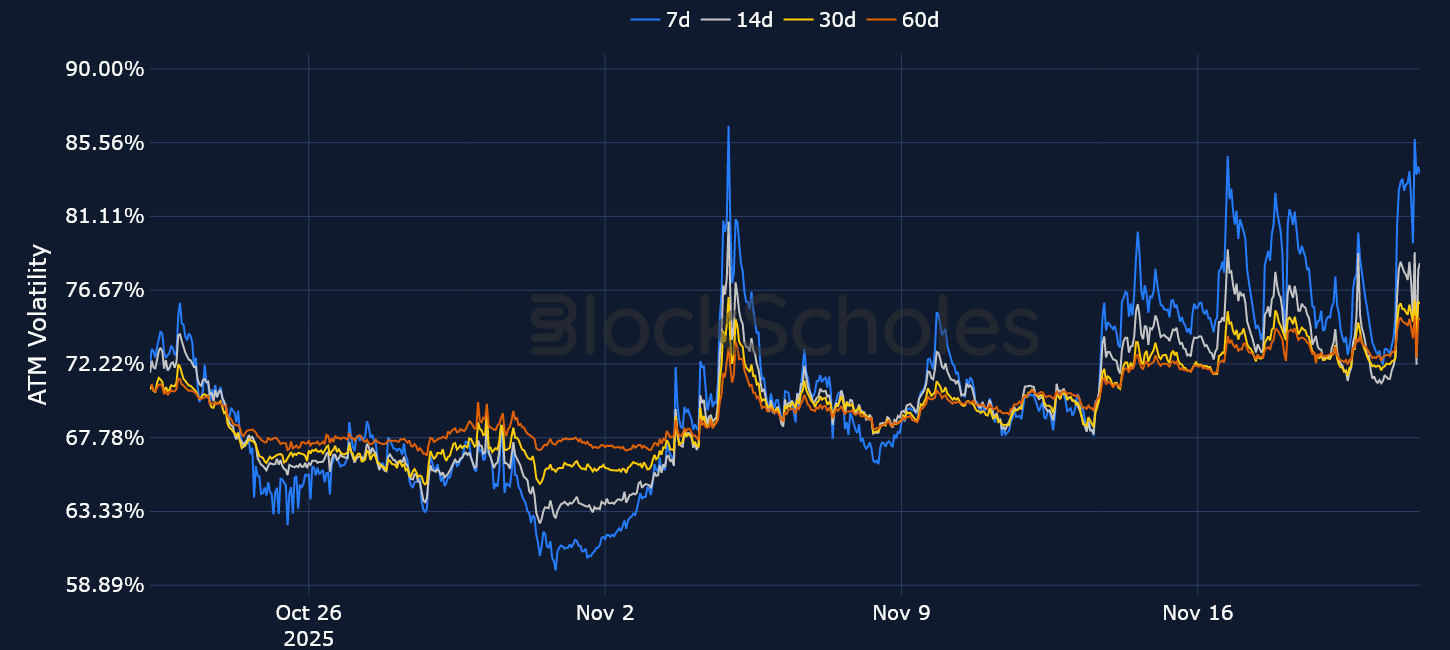
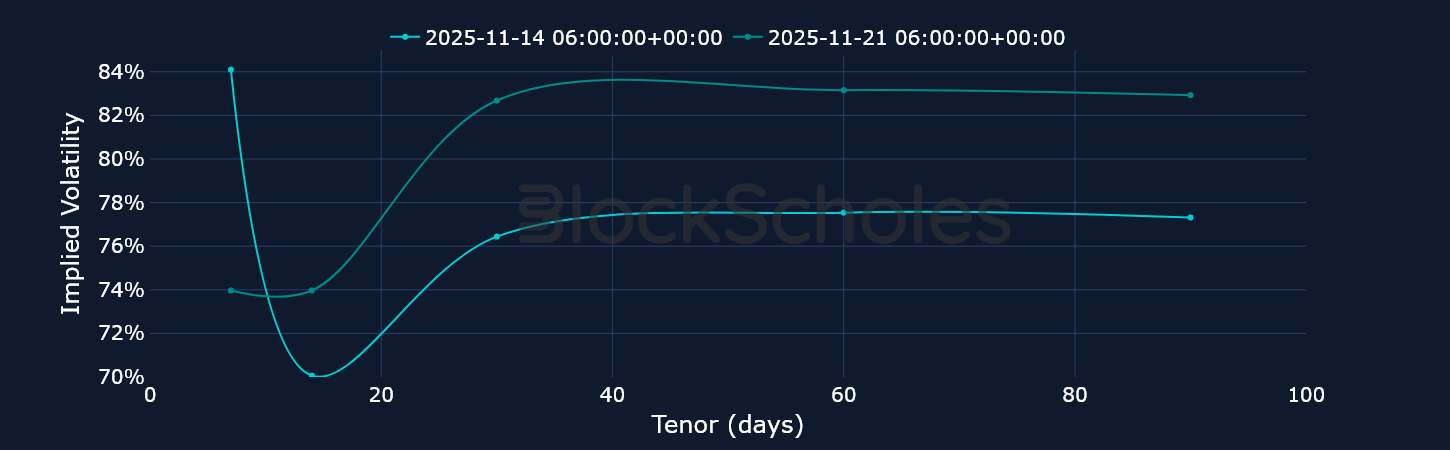
US equity markets were able to shrug off some of the broader macroeconomic uncertainty last week, while the modest rallies in BTC quickly fizzled out. Since then, we have seen very few of these modest rallies; instead BTC has continued to fall lower. Earlier in the week it fell below $90K, completely erasing all of its year-to-date gains. That selloff has now extended all the way to $83K, slowly getting closer to the April 2025 bottom of $75K. That’s occurred alongside a continued wave of selling from Spot Bitcoin ETF holders as well as a lack of interest from retail traders to reopen lost positions (as showcased by perpetual swap open interest). As a result of the continued moves lower in spot price, ATM implied volatility across all tenors has increased over the past week, with the front end of the term structure outperforming. Hence, for most of the past week, BTC’s term structure has been sharply inverted, with traders bracing for higher volatility in the short-term than over a longer period into the future. On Nov 21, 2025, as BTC dropped to $82K, 7D IV spiked close to 60%, while short-dated skew fell even more sharply towards put contracts, as traders were willing to pay even higher premiums for short-term downside protection.

Realized volatility of ETH’s spot price has surged towards 90% as ETH trades 14% lower over the past week and 45% lower than its Aug 24, 2025 all-time high. ATM implied volatility across the surface has in turn exploded to the upside, with the front end of the term structure touching 86%. That has resulted in a term structure inversion, similar to BTC’s, but at higher outright volatility levels. Once again, such elevated levels of volatility over the foreseeable future is unsurprising, given that ETH now trades at a five month low, falling below $2,700. In turn, positioning remains bearish in Ether denominated options contracts, with volatility smiles firmly skewed towards OTM put contracts across the whole curve.
Unlike last week, however, when trade volumes were focused on short-dated downside protection against further sell-offs, this week trade volume data shows a closer balance between calls and puts.


Earlier in the month, we found that SOL options recorded four consecutive days of heavy trade volume dominated by bearish put options. We have not seen a repeat of such an event since then, though volumes in both calls and puts now remain equally subdued. SOL has been one of the hardest hit large cap altcoins over the past month, despite positive news such as Fidelity’s launch of its first Solana exchange-traded fund, the Fidelity SOL Fund (FSOL), becoming the fourth issuer to bring a SOL ETF to market and the first from the firm to feature staking. That announcement still did very little to change sentiment in the token.
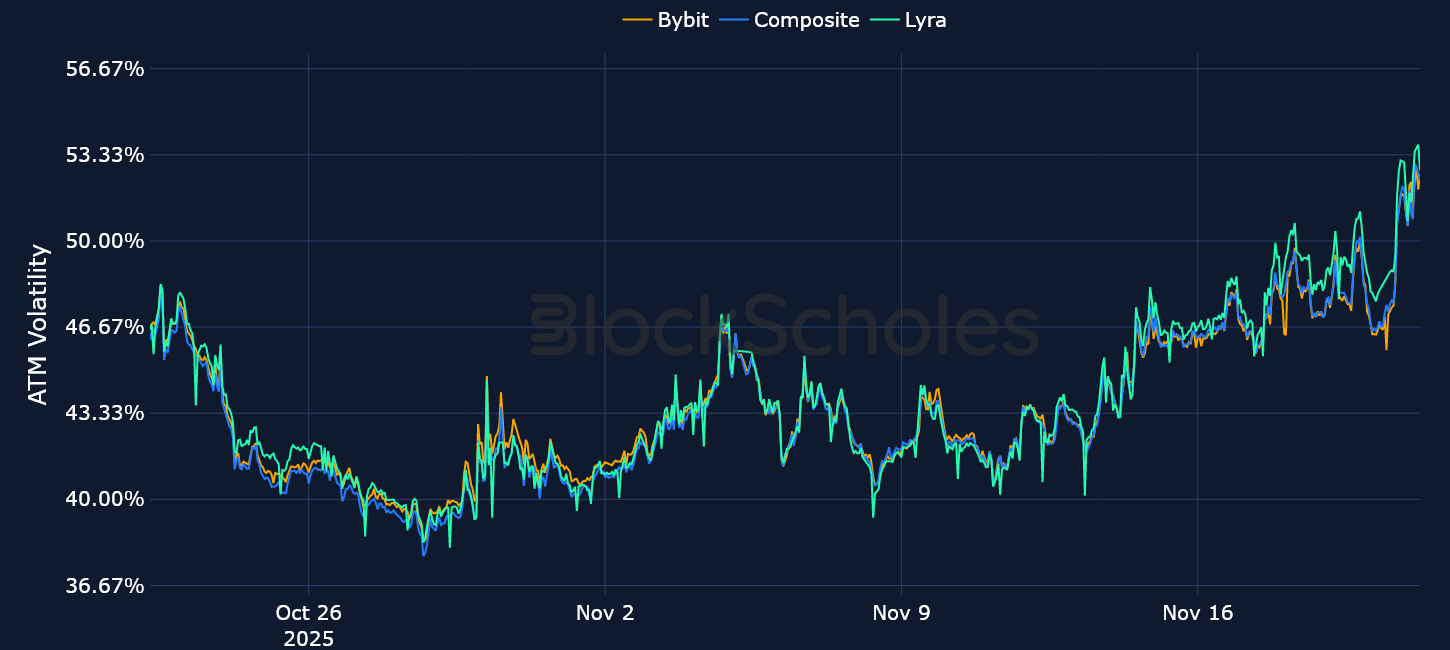
Volatility expectations briefly fell to a local low earlier in the week of 55%, a level we’ve seen short-tenor volatility bounce off in the past. As with those previous cases, options prices did not stay at that level for long and have once more increased as short-dated options are again showing signs of increased demand, resulting in an inverted volatility term structure.


The modest bounces in spot price that we highlighted last week proved futile. Over the past week, BTC has fallen from $105K all the way down to a local bottom of $83K. Spot price falling below $90K marked an important level for several reasons.
As such, it is no surprise that a revisit to a low that was last seen in April 2025 stoked a significantly bearish response in options markets, where skew plunged firmly towards OTM puts in both BTC and ETH. That was a firm indication that traders rushed for downside protection against an even deeper dip below $83K for BTC and $2,700 for ETH. Much of that bearish skew was priced out just as quick as it occurred, but options markets still remain unequivocally bearish. BTC options traders are assigning a 10%+ implied volatility premium to put options expiring in the next 7 days, while ETH options traders are assigning an 8%+ premium towards puts.


Crypto ETF approval has begun for altcoins in the US regulated market, a moment long awaited by the community. However, the ETF effect is not what had been anticipated; previous ETF approval announcements for BTC and ETH had both triggered rallies. Now, the announcements come during a volatile period, clouding the picture for ETF listings.
SOL in particular has had its SOL staking ETFs approved over the last week, which targets exposure to both the spot price and the staking yield, yet SOL has continued to move lower in line with the rest of the market.
This comes as the macro picture is driving a risk-off environment, creating caution around investing heavily in crypto tokens and preventing a rally. Other tokens with recent listings or upcoming listings include XRP, DOGE, Hedera, and SUI, which also show a similarly muted response. This is extremely different from the rally created as a result of the BTC ETF approval and listing, and from the rally in ETH in anticipation of its own ETH spot ETF.

At the same time, 21Shares is adding further depth to the Solana product stack with the launch of its spot Solana ETF, $TSOL, which has cleared its final hurdle via Cboe approval and is expected to begin trading today with a 0.21% management fee and around $100M in initial AUM. The arrival of TSOL brings the total number of Solana ETFs to six and pushes combined Solana ETF assets to roughly $2B, with inflows recorded on most days despite the current “extreme fear” backdrop. This comes on the heels of 21Shares’ recent rollout of two 1940 Act crypto index ETFs spanning Bitcoin, Ethereum, Solana and Dogecoin, underscoring that product development and institutional access are still progressing even as spot prices remain under pressure and fail to reflect the strength of these flows.


Open interest and trading volume data are sourced “as is” from the Bybit exchange platform API exclusively, and as such do not represent a comprehensive picture of the sum of trading activity across all derivatives markets or exchanges. The data visualized in this report consists of hourly and daily snapshots, recorded over the previous 30 days. Daily (hourly) snapshots of trade volume record the total sum of the notional value of trades recorded in the 24H (1 hour) period, beginning with the snapshot timestamp.
If not explicitly labeled as derived from another exchange, the input instrument prices to all derivatives analytics metrics in this report are sourced from the appropriate endpoints of Bybit’s public exchange platform API. In the event that data is labeled or referred to as representing the market on another exchange source, that data is sourced from the appropriate endpoint of each respective exchange’s public API.
Macroeconomic charts and data are sourced “as is” from the Bloomberg Terminal. Exchange data is sourced “as is” from publicly available exchange APIs. Block Scholes makes no claims about the veracity of public third-party data.
After acquisition of underlying-denominated raw data for open interest and trading volume on the Bybit exchange platform from Bybit’s API endpoint, equivalent dollar-denominated figures are calculated using the concurrent value of Block Scholes’s Spot Index for the relevant underlying asset.
Block Scholes’s Spot Index represents the aggregate Spot mid-price for a given currency across the top five CEXs by volume (with USD-quoted markets). It considers the proportion of total volume in the instrument on the exchange, as well as the deviation of a data point from those on other exchanges.
Futures prices are used for Block Scholes’s futures-implied yields calculation services in order to derive the constant-tenor annualized yields displayed in the Futures section of this report.
Options prices are used for Block Scholes’s implied volatility calculation services in order to calibrate volatility surfaces, from which all derivatives volatility analytics displayed in the BTC Options and ETH Options sections of this report are calculated. Volatility smiles are constructed by calibrating to mid-market prices observed in Bybit options markets. As part of the calibration process, prices go through rigorous filtration and cleaning steps, which ensures that the resulting volatility surface is arbitrage-free and has exceptional fit to the market observables.


.jpg)
.jpg)