Thahbib Rahman
Research Analyst
Mapping the expansion of options as a trading instrument and the volatility that prices them.

Options onchain have taken various forms over time, representing an underrepresented niche within crypto primitives. Nonetheless, this is changing, with a new wave of protocols that improve on their predecessors, abstracting the complexity of options and emphasising their value proposition rather than primarily on user education, and meeting real demand as onchain yields compress.
In this report, we cover and compare different venues that offer exposure to crypto asset options, compare thecam with traditional platforms, and highlight how Prediction Markets essentially replicate traditional binary options.
With this, we also expand the research to map the volatility of the major assets, BTC and ETH, and their correlation with prediction market odds.
This report is co-authored with Block Scholes and is divided into separate sections, with each having a different focus:
Most people don’t realise they’ve been trading options their whole lives.
If you’ve bought insurance, you’ve paid a premium for a conditional payout in the future. This is a put because you are protected against a drop in the value of whatever you insured. If you’ve taken out a mortgage, you hold the right to refinance early. This is a call because you hold the exclusive right (but not the obligation) to “call in” or cancel your current debt contract.
Options now dwarf futures in global exchange-traded derivatives volume, with options accounting for over 4x the contracts of futures in 2024, and in 2025, U.S.-listed options posted a sixth consecutive record year, with roughly 15.2B contracts traded, equating to ~$36B in premium traded daily.
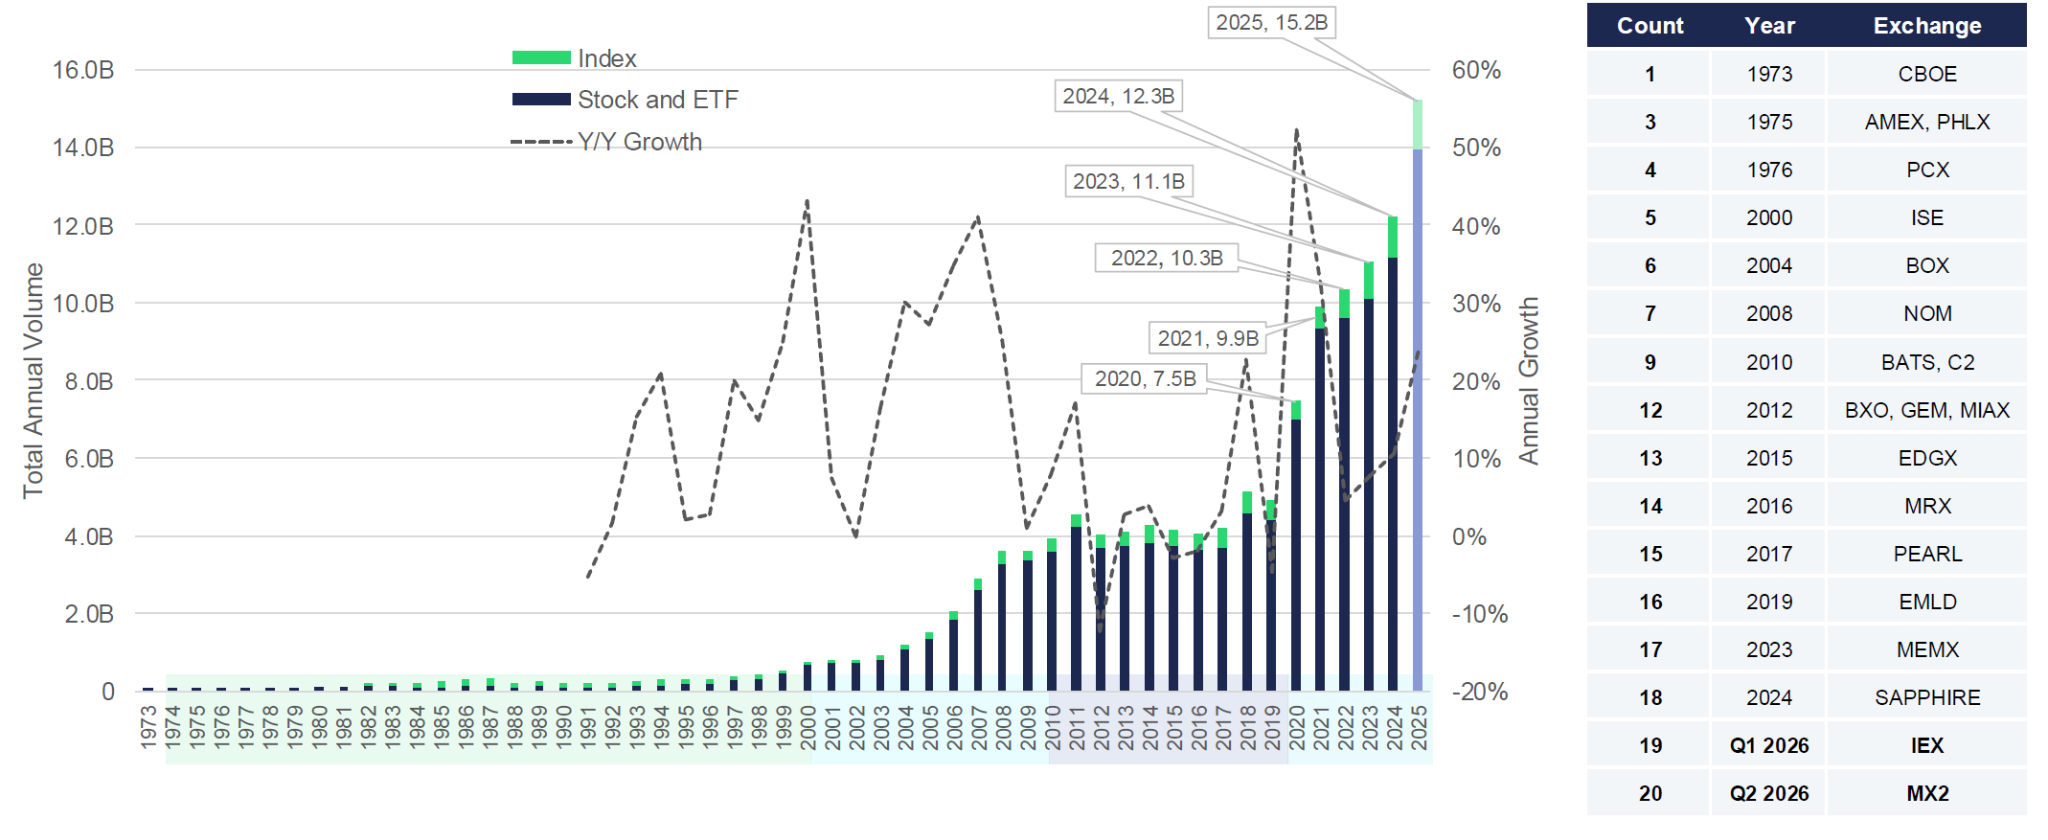
Figure 1 (CL) State of Options Industry: https://www.cboe.com/insights/posts/the-state-of-the-options-industry-2025
Zero-day-to-expiry (0DTE) options on SPX alone topped $1 trillion in daily notional at their peak, averaging 2.3 million contracts daily and comprising 59% of the product’s total volume in 2025. 0DTE options expire on the same day they are traded; they are used to chase large, rapid returns on intraday stock movements, but they carry the risk of losing 100% of your investment very quickly.
In 2024, the NSE (National Stock Exchange of India) accounted for ~84% of global equity options contracts; however, in value terms, the total premiums paid by options buyers in the US were still around 4 times those in India. This suggests that the Indian retail public is trading a massive number of tiny contracts, whereas US participants trade fewer, but vastly larger and more expensive contracts.
The appeal of options is making its way into crypto products, too, albeit from institutions.
CME, the largest US-regulated derivatives exchange, is now offering 24/7 crypto options. This is an unprecedented shift from a legacy exchange seeking to retain its user base, one that recognises the appeal of crypto markets that trade around the clock. Furthermore, in April, open interest in BlackRock’s IBIT options, which launched just over 2 years ago, surpassed BTC on Deribit, rising from $26.9 B to $27.6 B, despite Deribit launching over 10 years ago.
Options are extremely flexible instruments which can be leveraged in a wide range of applications:
User profiles are spread widely across financial markets. They range from institutional market makers hedging risk and banks packaging yield, to volatility funds trading market swings and retail investors speculating on cheap, same-day 0DTE movements.
Given their prominent role in traditional markets, options were expected to be an instrument with natural product market fit in volatile, onchain crypto markets. Instead, they have been one of its most repeated failures.
This was in no way due to a lack of experimentation, as can be seen from the products launched in previous cycles:
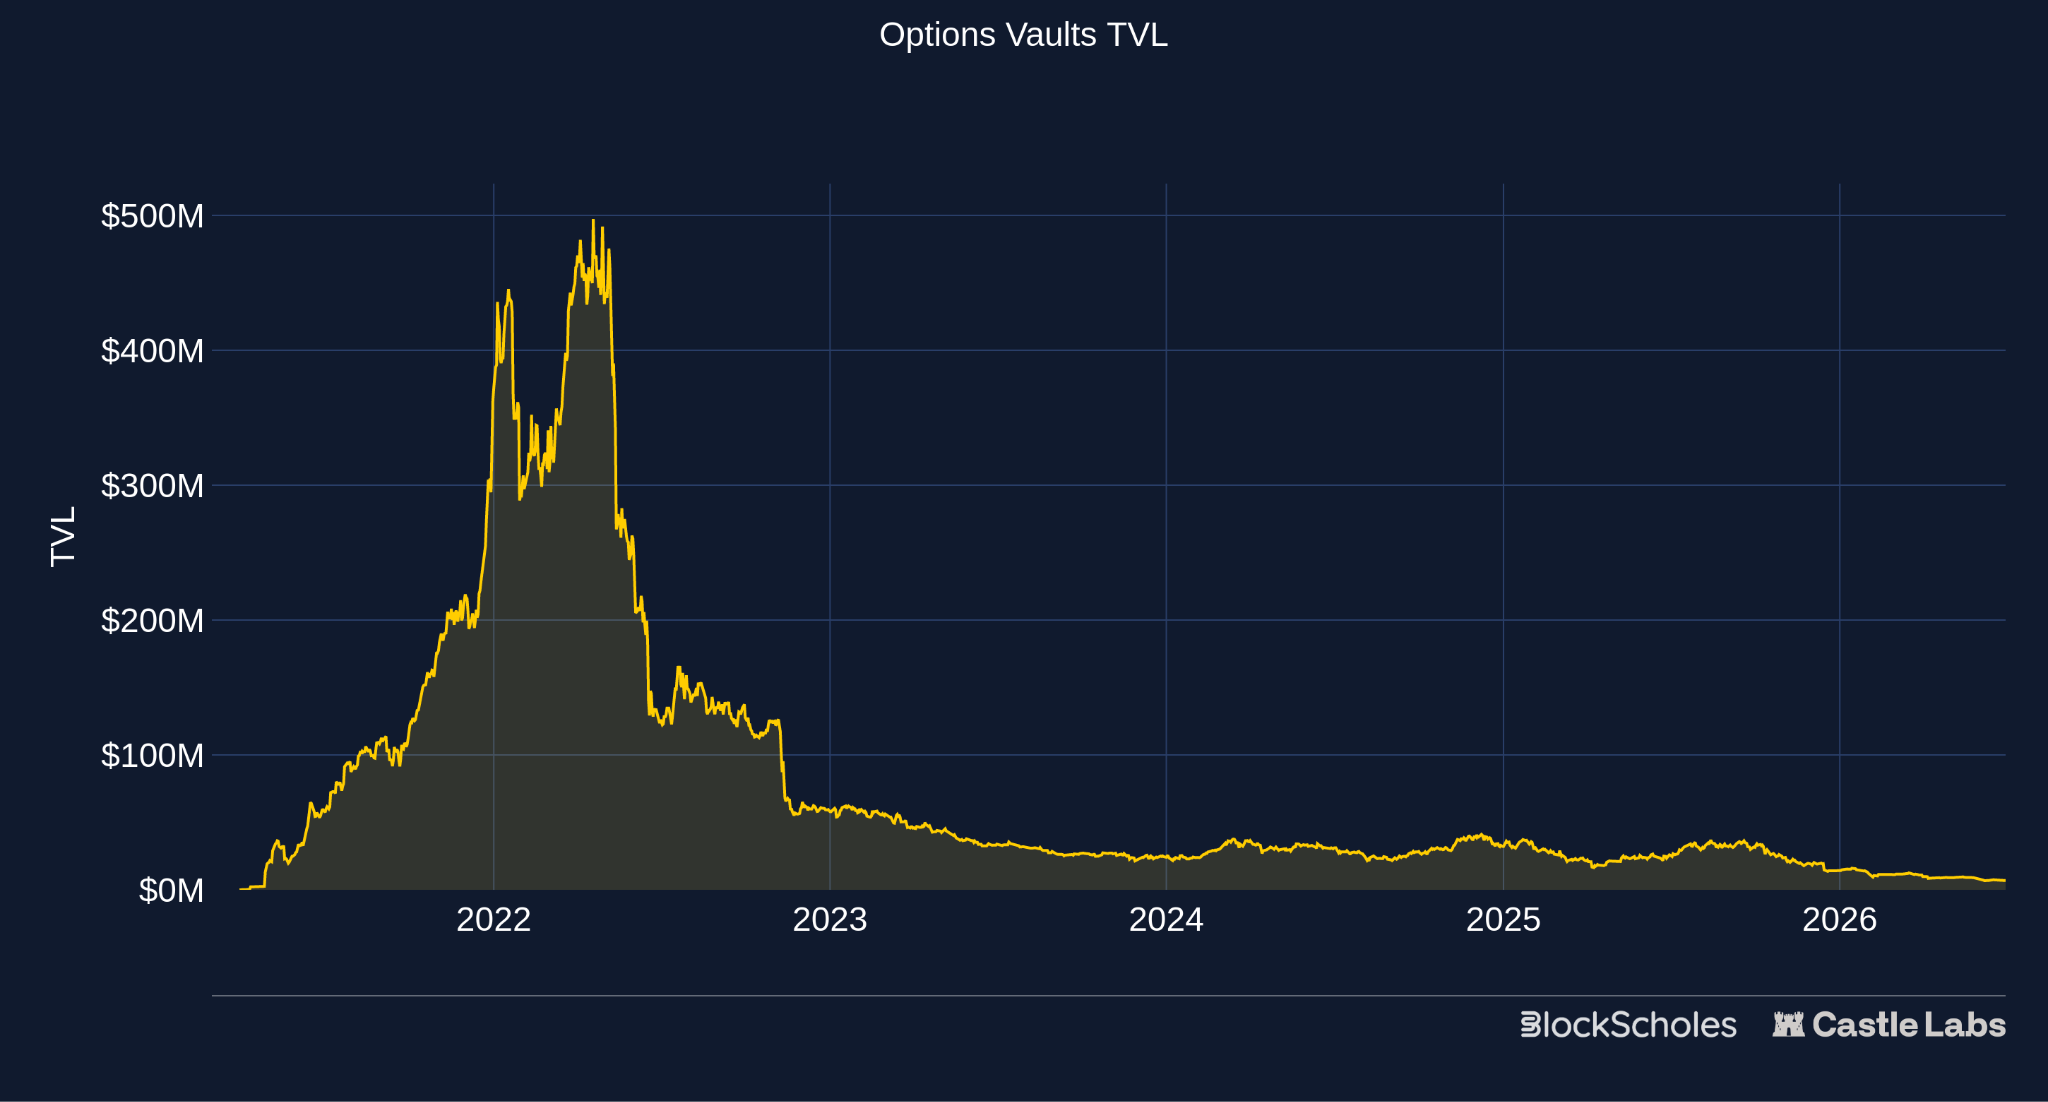
Figure 2 (CL) Options Vaults TVL - DefiLlama
The sector has been repeatedly held back, primarily by structural constraints. Weak market-maker participation left venues with thin two-sided liquidity and pushed hard-to-hedge risk onto passive LPs. Poor capital efficiency was paired with unreliable volatility surfaces, while the user experience was left in no man’s land: too complex for retail but lacking the professional architecture required by institutions.
Since these early attempts, conditions have been continually improving:
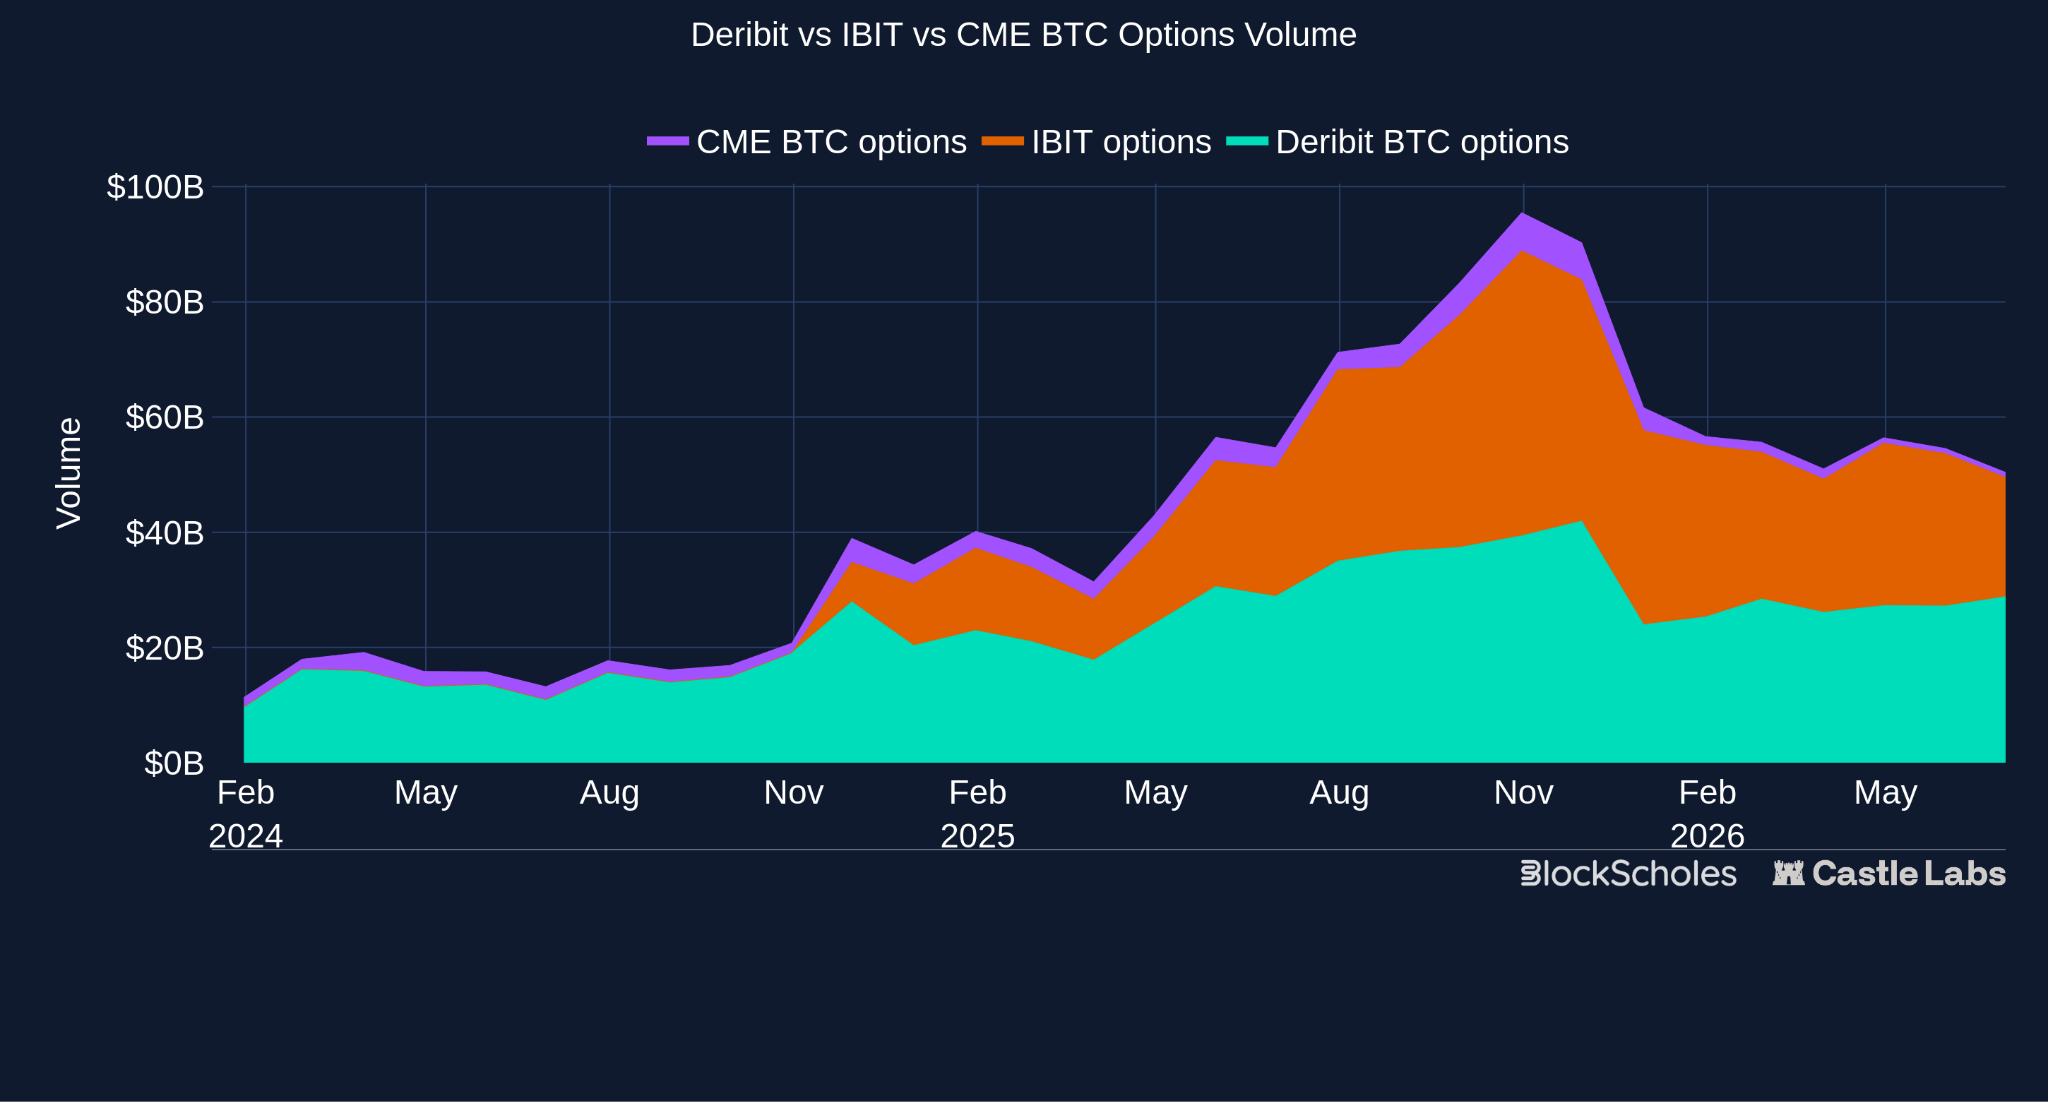
Figure 3 (CL) Deribit vs IBIT vs CME BTC Options
Conditions have also improved onchain, where stronger options markets are beginning to form, with 30d notional volume at ~$1.44B, and premium volumes posting all-time highs this year.
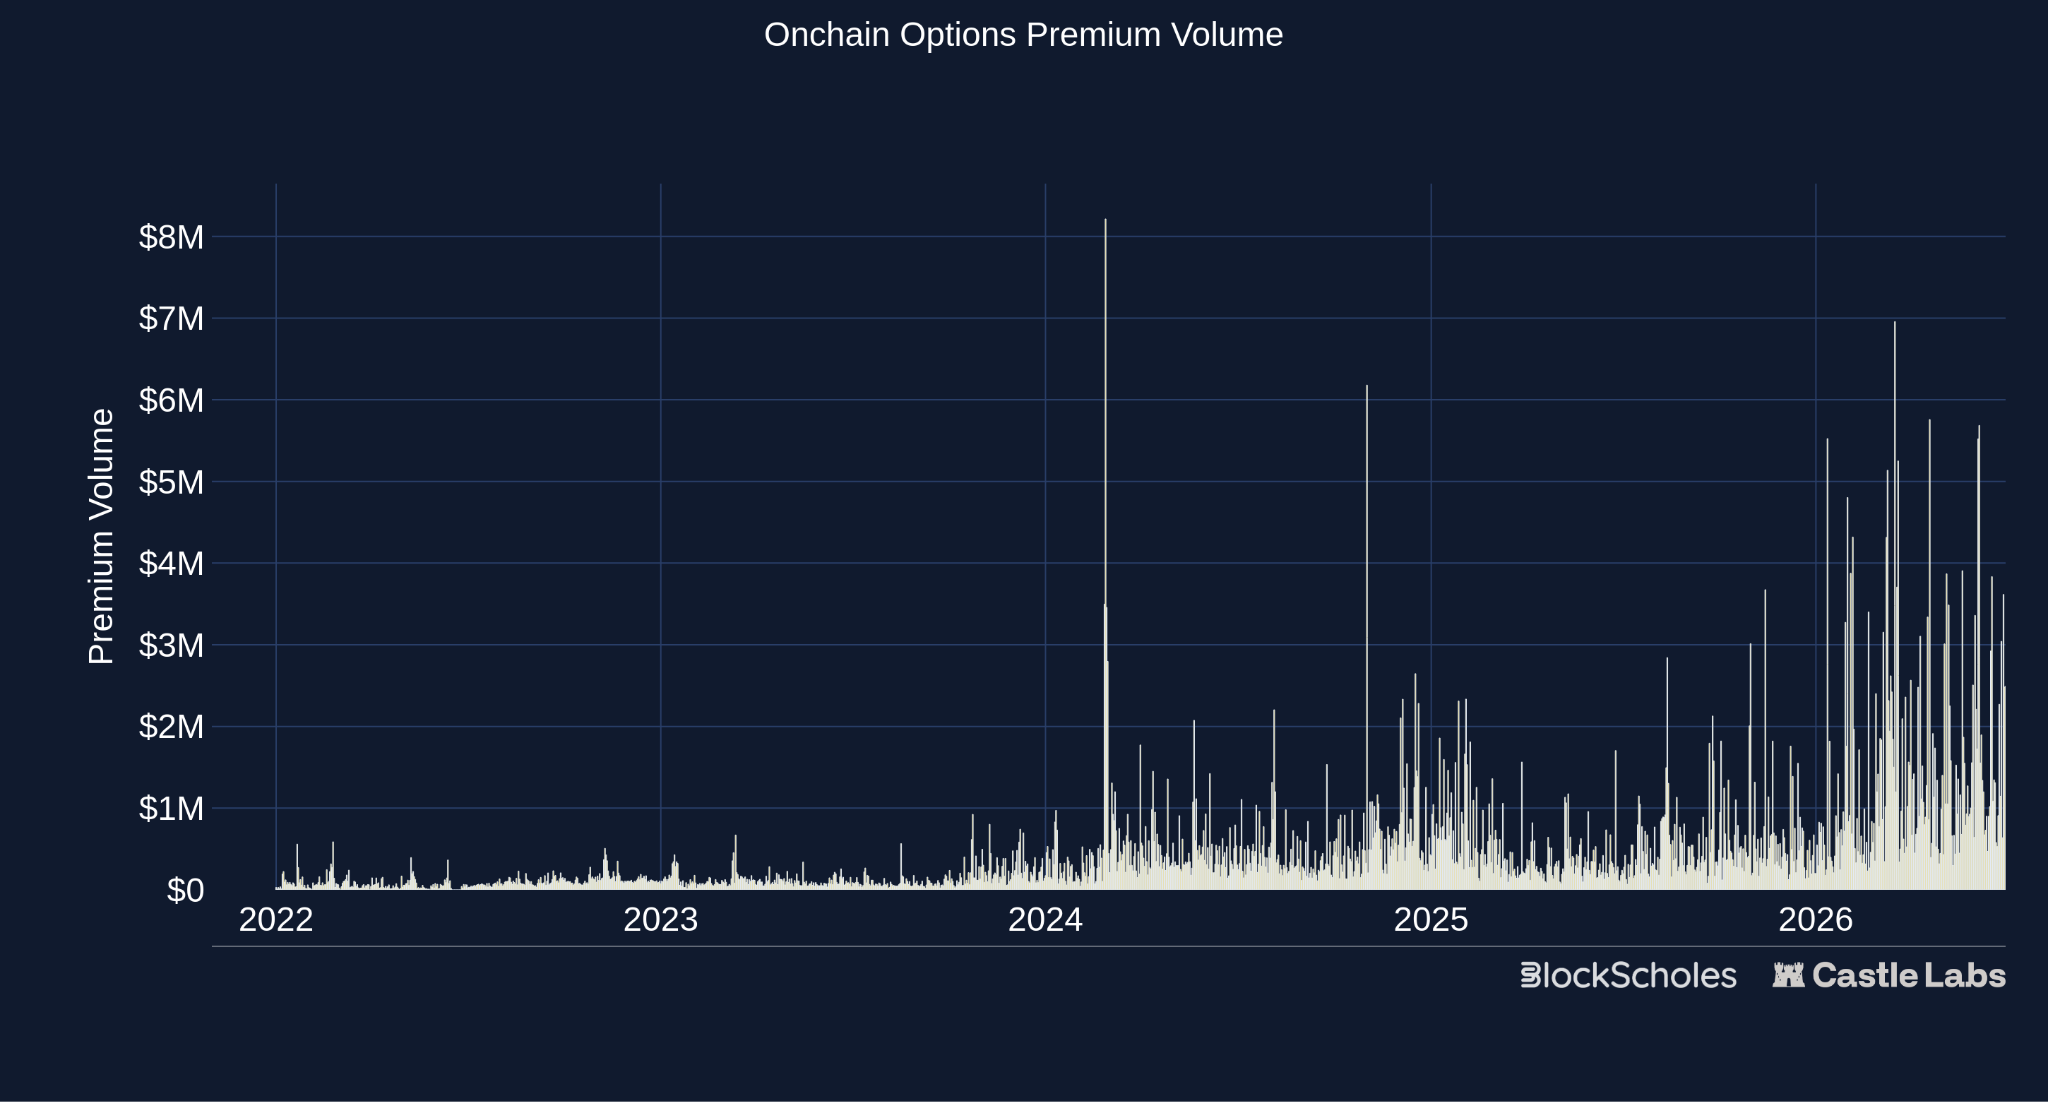
Figure 4 (CL) Options Premium Volume
The resultant category looks vastly different from the first DeFi options cycle. Protocols are no longer simply attempting to become Deribit onchain, and the ecosystem touches many parties from institutional venues and ETF wrappers to onchain vanilla options, new exotics, and binary options operational through prediction markets.
In the following sections, we will dive into the current options landscape, focusing on what’s happening onchain.
The crypto options landscape is a set of adjacent markets with different settlement and payoff types. The map below splits the ecosystem across these two dimensions:
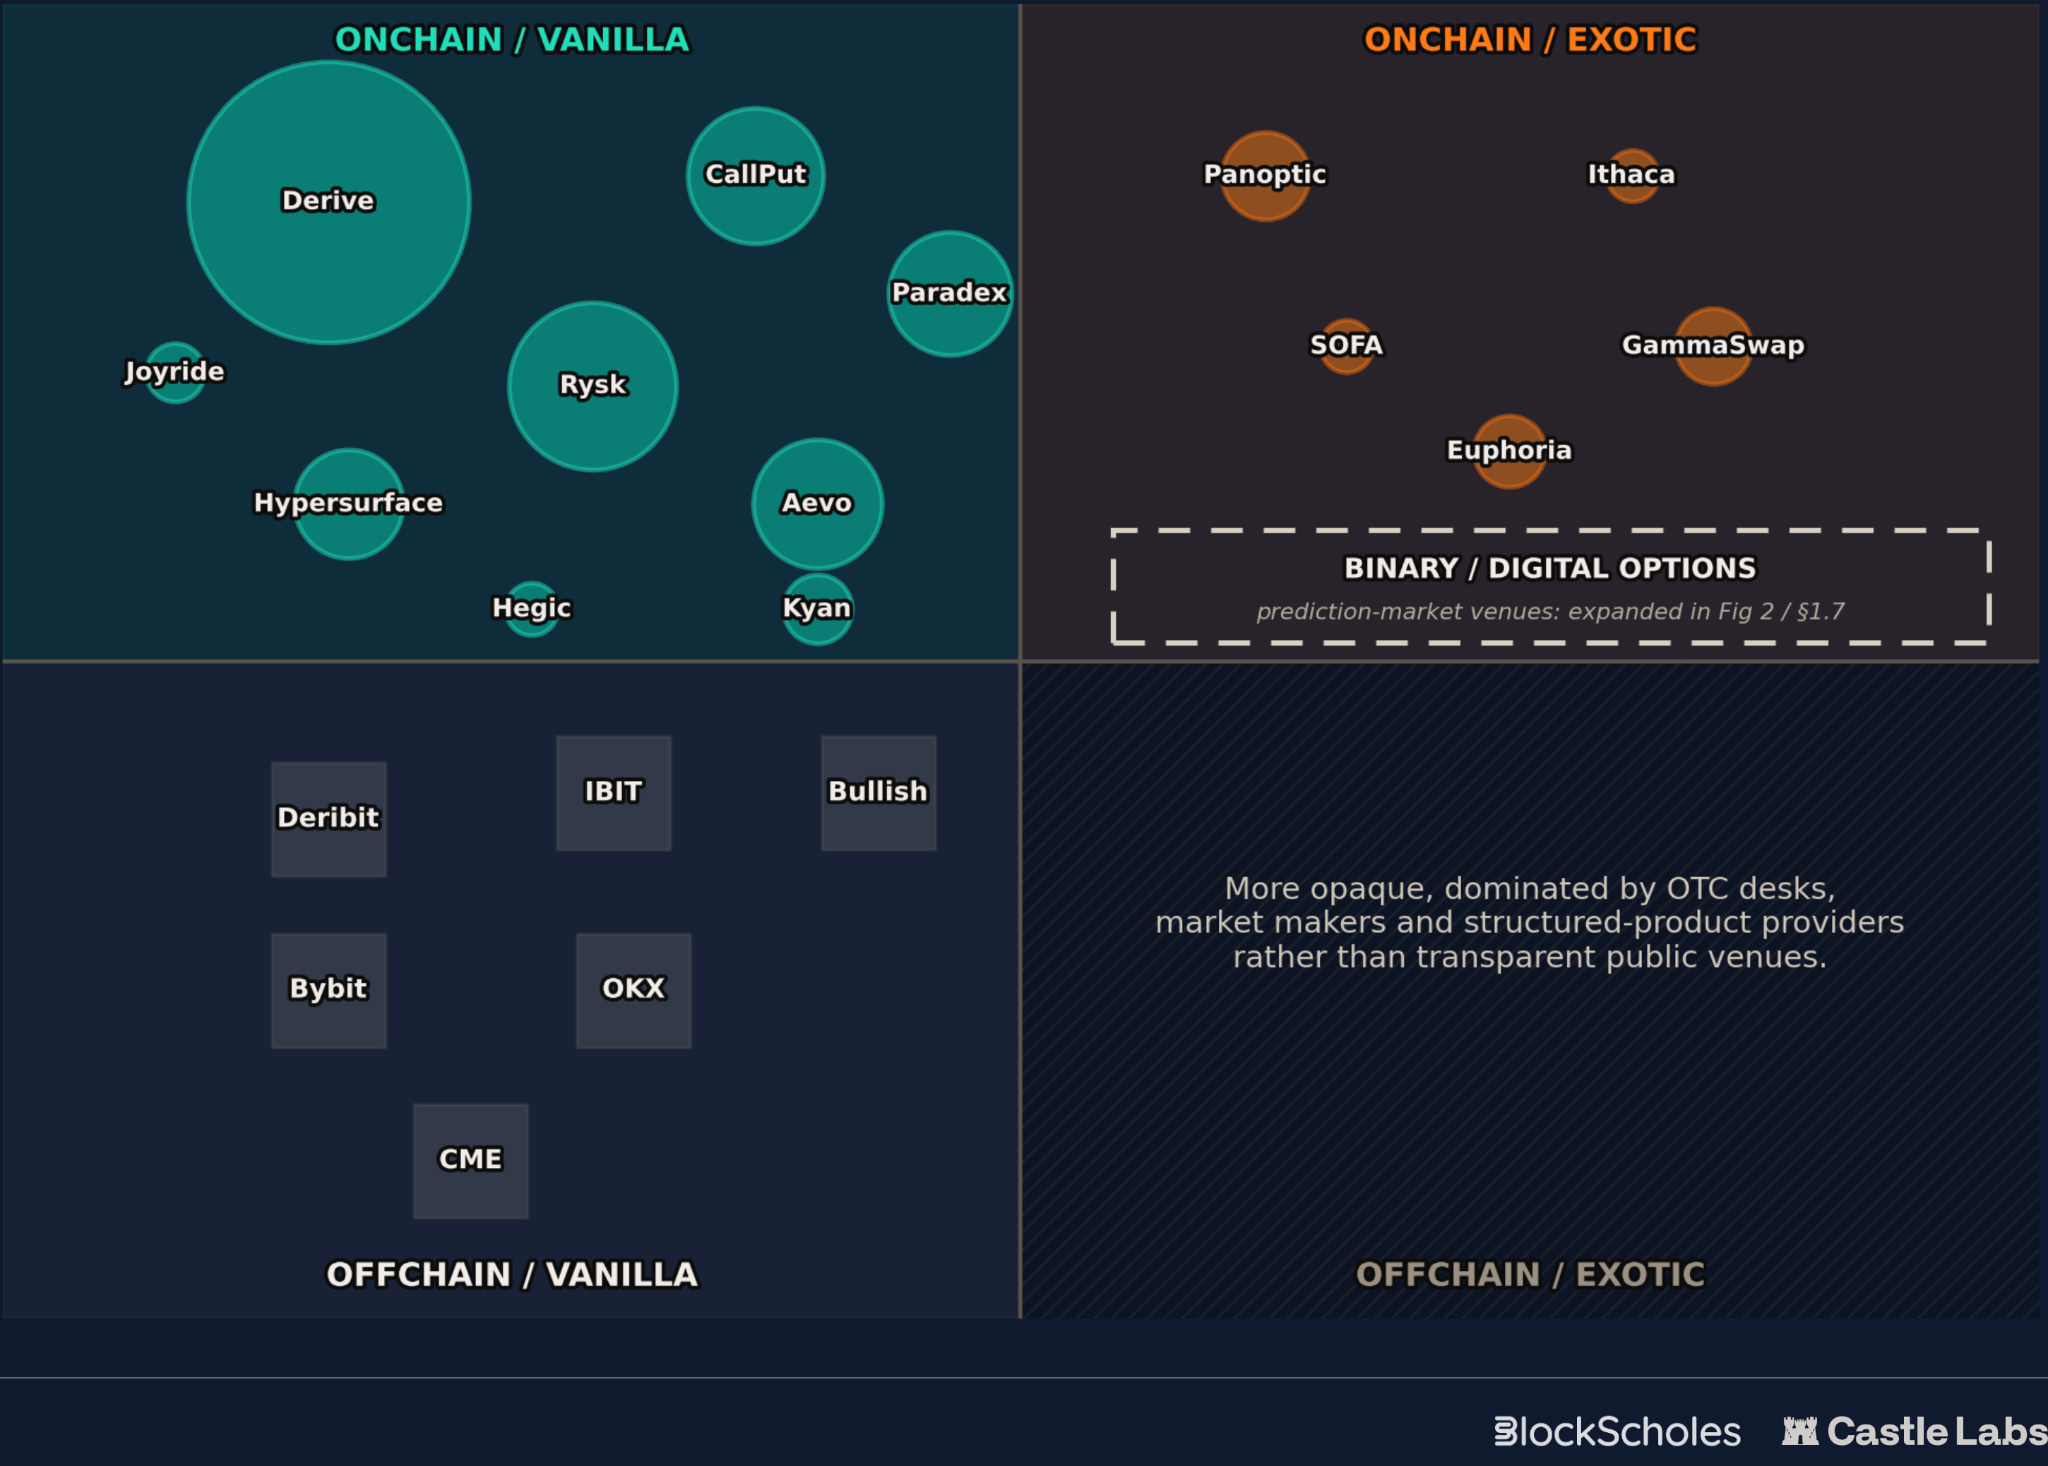
Figure 5 (CL) Options Ecosystem Comparison
Offchain vanilla options remain the clear leader, led by Deribit, IBIT, and CME, along with CEXs like Binance and OKX. Onchain vanilla venues are instead beginning to rebuild liquidity around CLOBs, RFQs, and more simplified user-focused products, whilst settling transactions onchain.
More experimental products sit within onchain exotics, using options or option-like payoffs as building blocks rather than simple listed calls, puts, and spreads. Examples include:
The fourth quadrant, offchain exotics, is more opaque, dominated by OTC desks, market makers, and structured-product providers rather than transparent public venues.
This report focuses on the onchain side of the map, covering vanilla options venues and exotic options primitives before turning to binary option-like markets, most commonly expressed through prediction markets.
There has been clear progress in onchain vanilla options recently, not through changing the payoff itself, but through the surrounding infrastructure, product design, and user experience. These venues have generally moved away from passive LP pools toward CLOBs and RFQs, making room for portfolio-margin and yield-bearing collateral, as well as more targeted income products that simplify outcomes for users.
This section will walk through the most prominent venues as they stand today.
Derive is a clear example of this architectural shift. It evolved from Lyra, an options AMM, into the CLOB-based venue we see today. Today, Derive runs on its own OP Stack L2, offering cross-margined options and perps through a professional orderbook interface. Derive does not attempt to hide the complexity of options from users and therefore targets pro traders, market makers, institutional users, and other sophisticated volatility traders. It looks much like a traditional options exchange, with an array of assets, strikes, and expiries that can be combined to create custom payoff structures.
Using an off-chain matching engine for instant execution and an onchain L2 for settlement allows institutional allocators to trade at the speed of a centralised exchange (CEX) like Deribit while maintaining non-custodial ownership of their assets. Derive also offers a range of vault products that, unlike previous attempts, harness the underlying exchange to execute a predetermined options strategy, aiming to earn yield on deposits.
Derive accounts for the majority of onchain options activity currently, with $1.142B in 30-day notional and $44.3M in premium, representing 79.2% of notional and 87.2% of premium across the category. These numbers should be accompanied by the caveat that Derive uses market-maker rewards, OP incentives, DRV rewards, and rebate programmes to support liquidity.
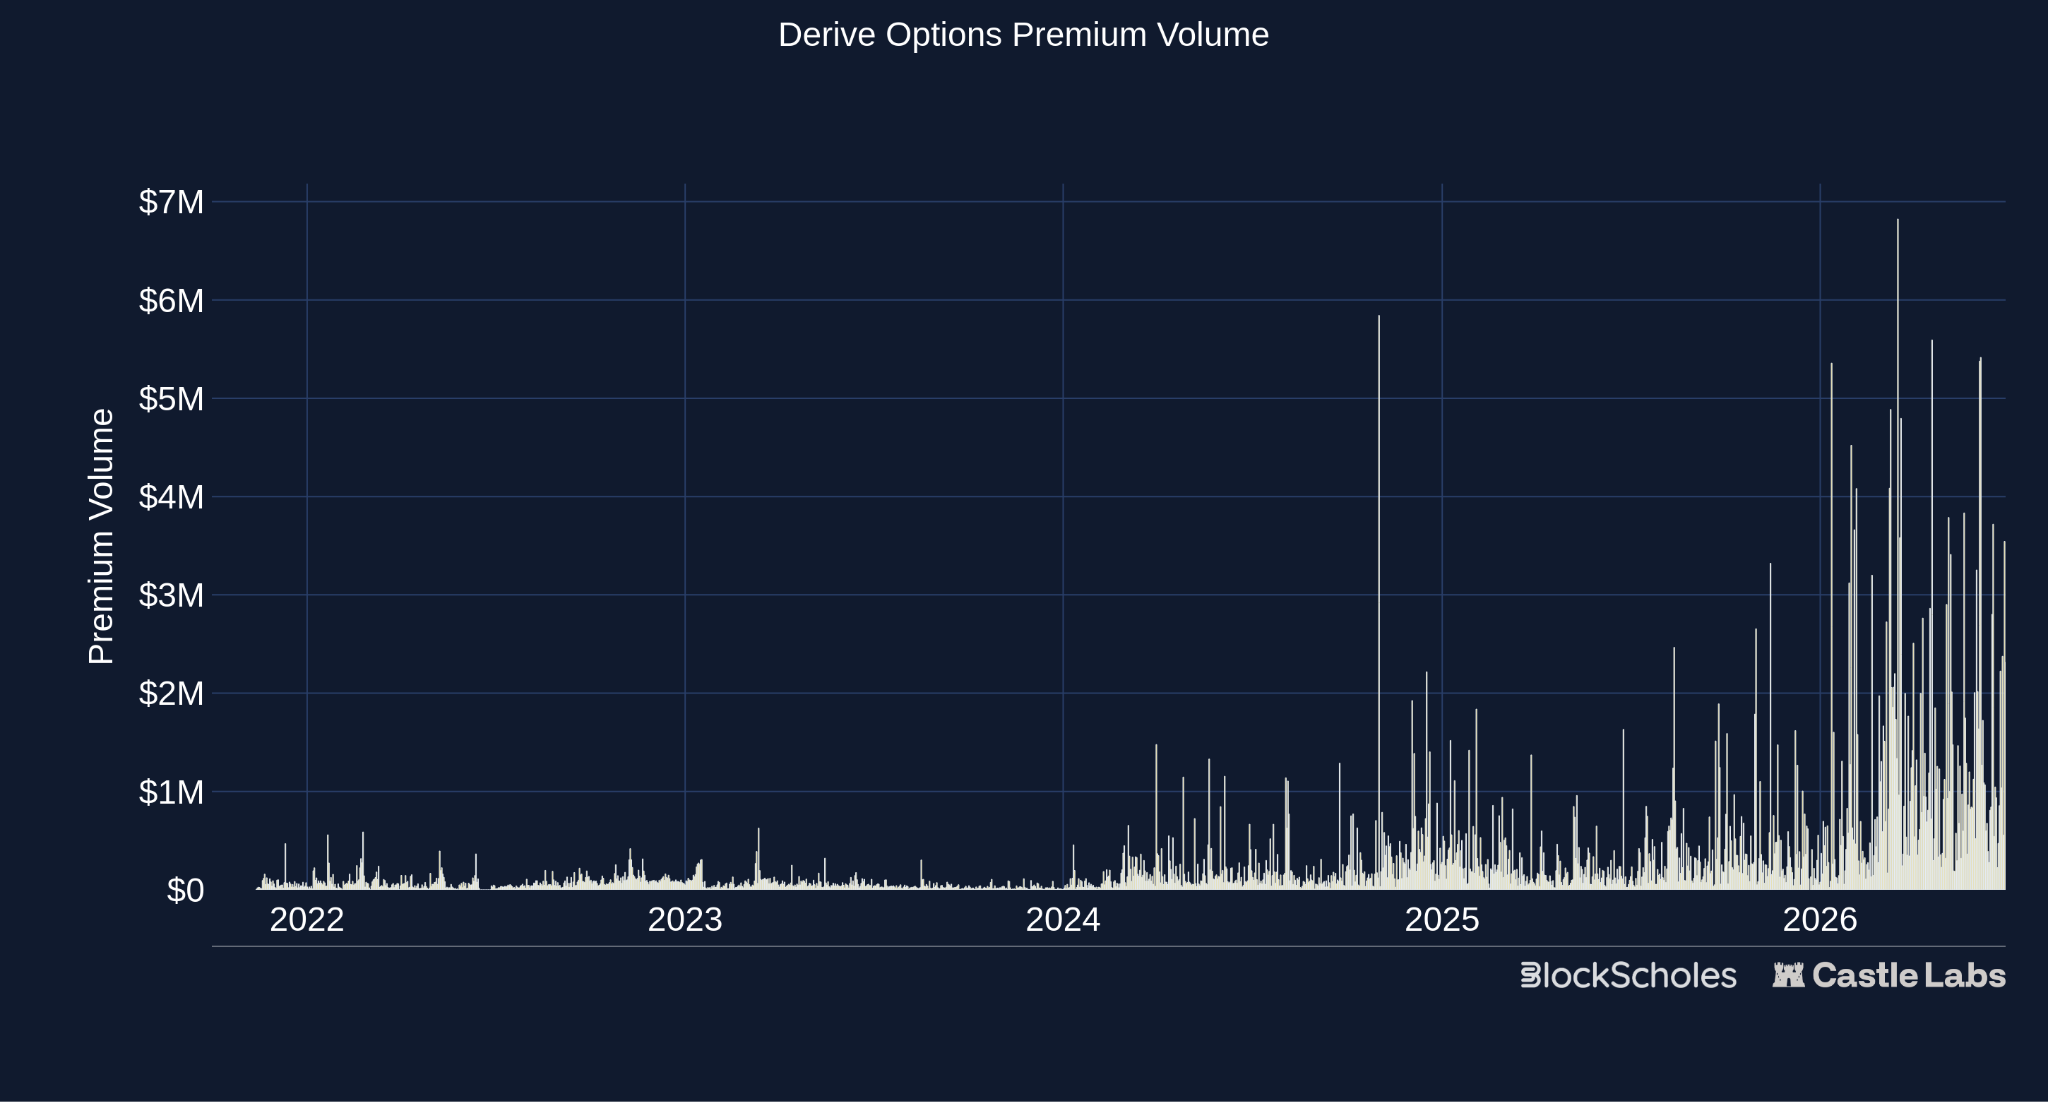
Figure 6 (CL) Derive Options Premium Volume
Despite the incentivisation of liquidity and participation, Derive highlights how the industry has developed over the years, with fully fledged options exchanges now running on performant appchains, accessible to institutions and market makers.
Rysk takes a completely different approach than Derive. Built around covered calls and cash-secured puts, it uses options as upfront income products, whilst keeping strikes and expiries selectable, unlike option vaults of the past. It routes user demand through an RFQ system, where market makers quote on specific requests, purchase the options flow, and manage their own risk elsewhere. Rysk focuses on abstracting the complexity of option products, making them appealing to retail and institutional investors alike with strong asset selection, clearly defined outcomes, and a seamless user experience.
For users, the offering is simple. Earn yield on your assets while agreeing on a price level you are willing to sell at or buy at. This is reflected in a broad range of actual users. They all want to earn yield, but do so in different ways and with different strategies. Treasuries, DAOs and funds are long-term holders that already have a view on where they would be willing to buy or sell an asset, and if they didn’t want to, could still earn yield on much more distant strikes. Institutions, on the other hand, for example, Hyperion, a Nasdaq-listed HYPE treasury company, runs curated vault strategies on top of Rysk infrastructure. Its mandate is to accumulate HYPE, so a cash-secured put strategy is a natural fit, earning them yield while placing orders at lower levels.
Rysk generated $136.3M in notional and $1.94M in premium over the last 30 days, accounting for 9.5% of the category’s notional. Rysk’s monthly notional volume grew from $50M in January to $182M in May, remaining above $175M in March and April as well.
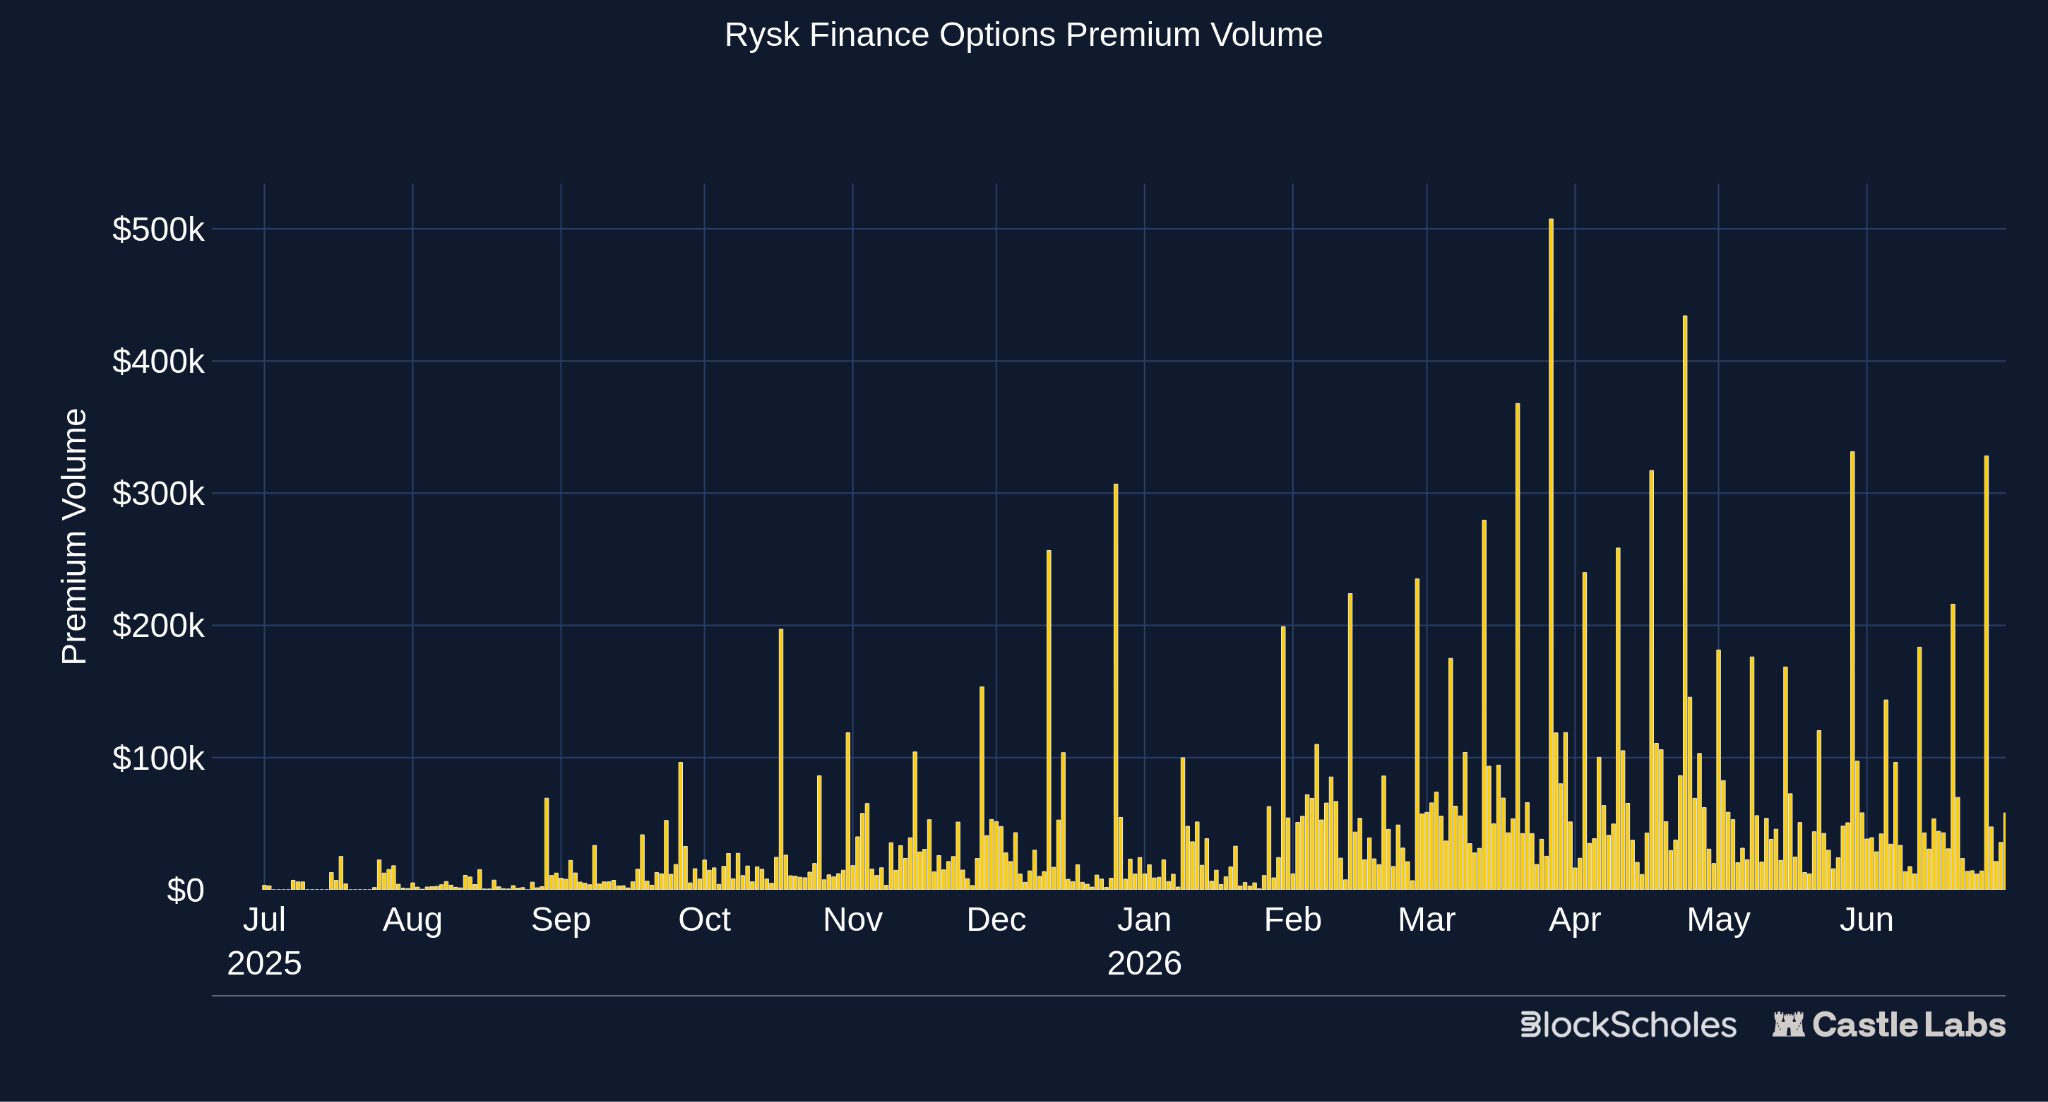
Figure 7 (CL) Rysk Finance Options Premium Volume
Unlike Derive, TVL for Rysk is much more relevant, as the product is based on collateralised option-selling strategies. To capture your premium, you need to deposit all your collateral, whereas in Derive, users can buy cheap options with a low premium to pursue large payouts.
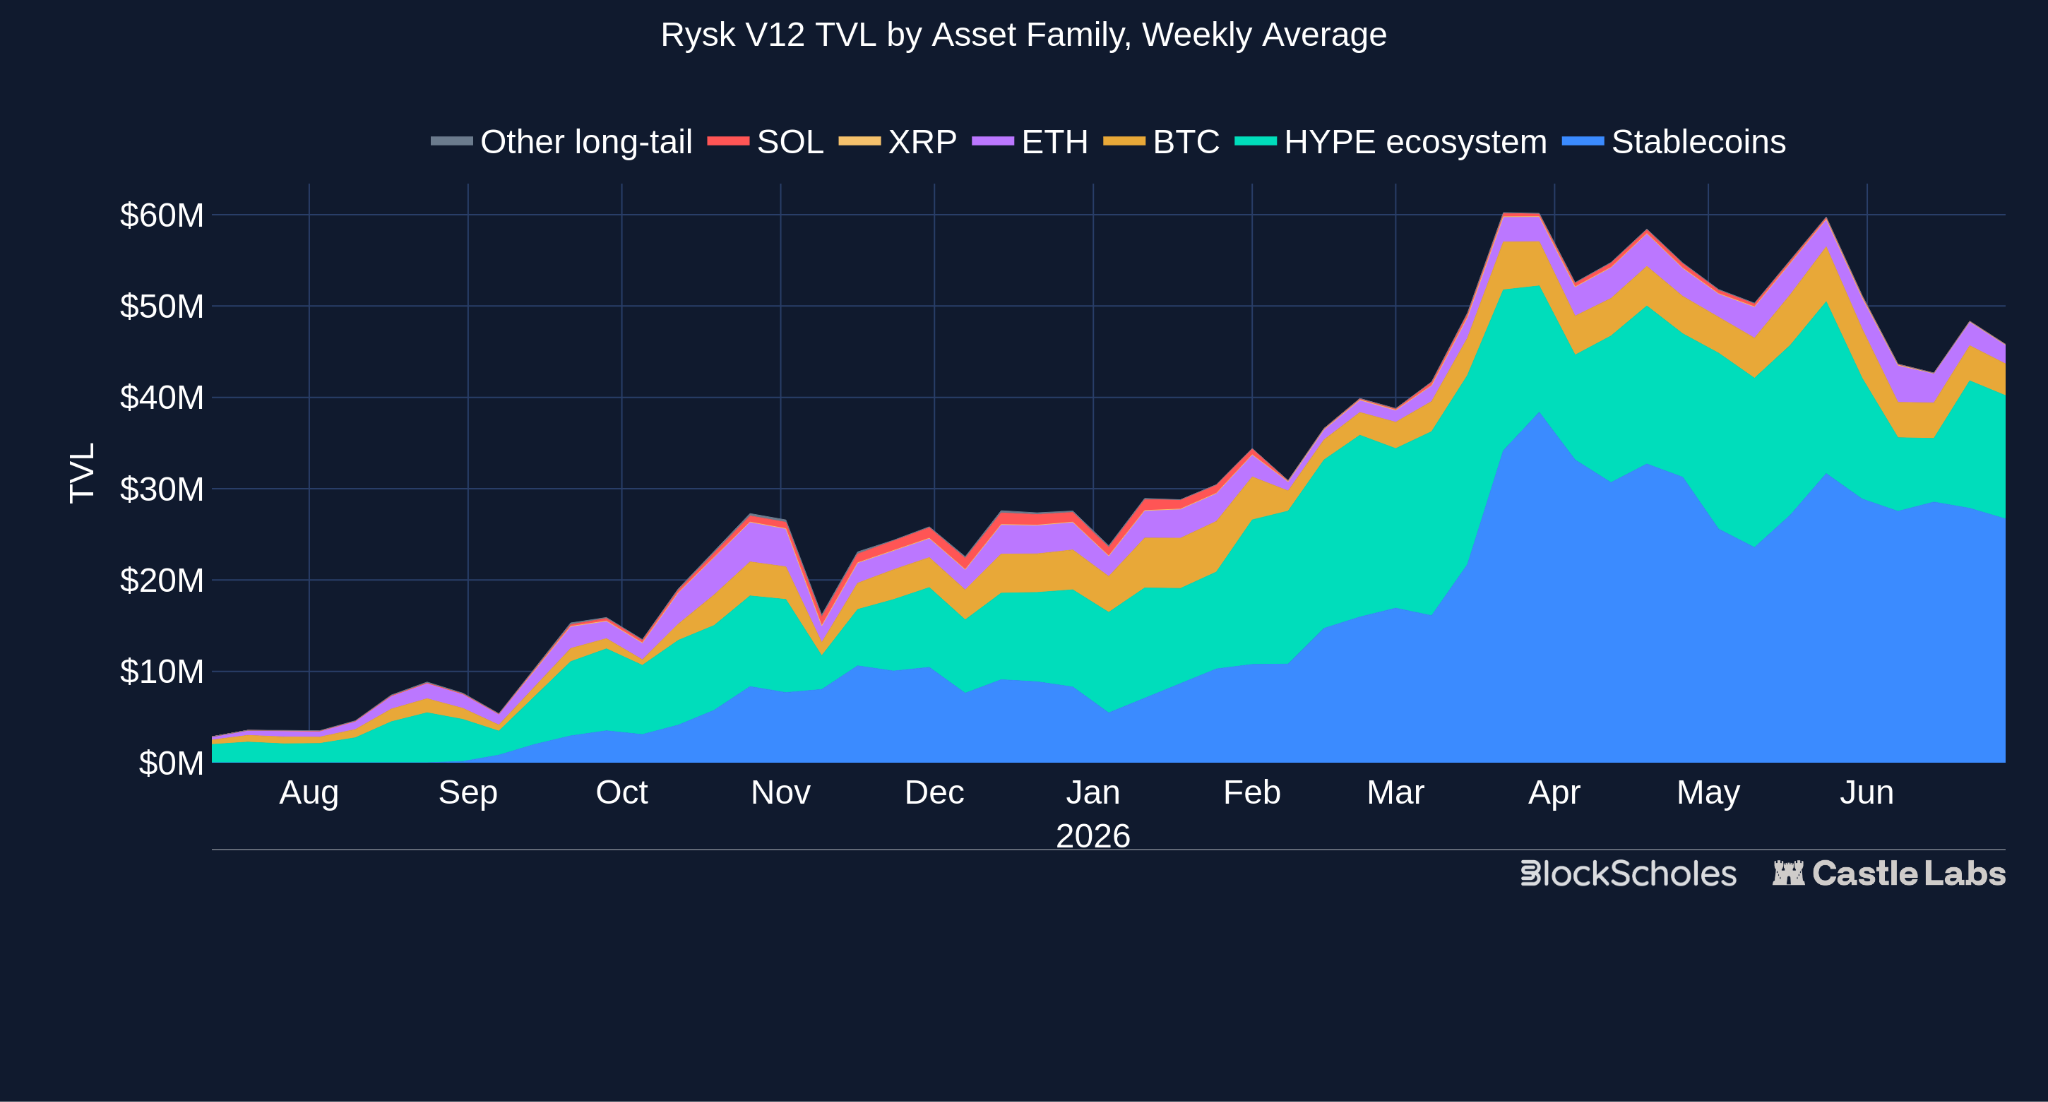
Figure 8 (CL) Rysk V12 TVL by Asset Family, Weekly Average
Rysk has managed to find a different kind of PMF in options, reframing them from trading instruments into income products based on selling volatility. With yields compressed across the industry, this has become highly competitive relative to lending, staking, and basis products, as evidenced by the strong, sustained growth since launch.
Like Derive, Aevo evolved from an earlier options product into an orderbook exchange. It emerged from Ribbon Finance, one of the first major DeFi Options Vault (DOV) products, before shifting to a broader derivatives venue. Today, Aevo offers options alongside perps, pre-launch markets, OTC and automated strategies on a custom L2, with offchain order matching and onchain settlement. Orders are matched in microseconds via an off-chain Central Limit Order Book (CLOB) to replicate a CEX user experience, but user funds remain secure in onchain smart contracts hosted on a custom OP Stack Ethereum Layer-2 rollup.
Launched in 2023, Aevo saw its strongest options activity during 2024. Since then, reported TVL and visible options activity have fallen from earlier highs, although options premium volume has recently started to pick up again.
Aevo’s primary unique selling proposition is its variety of products inside a unified margin account. This includes pre-launch tokens, allowing users to trade highly leveraged options and perps on hyped, unreleased tokens before they hit spot markets.
Aevo generated $45.1M in notional and $2.52M in premium over the last 30 days, representing 3.1% of onchain options notional. Monthly notional rose from $20M in January to $50M in May, but live options OI is only around $3.6M, far below Derive and below Rysk’s calculated open-notional proxy.
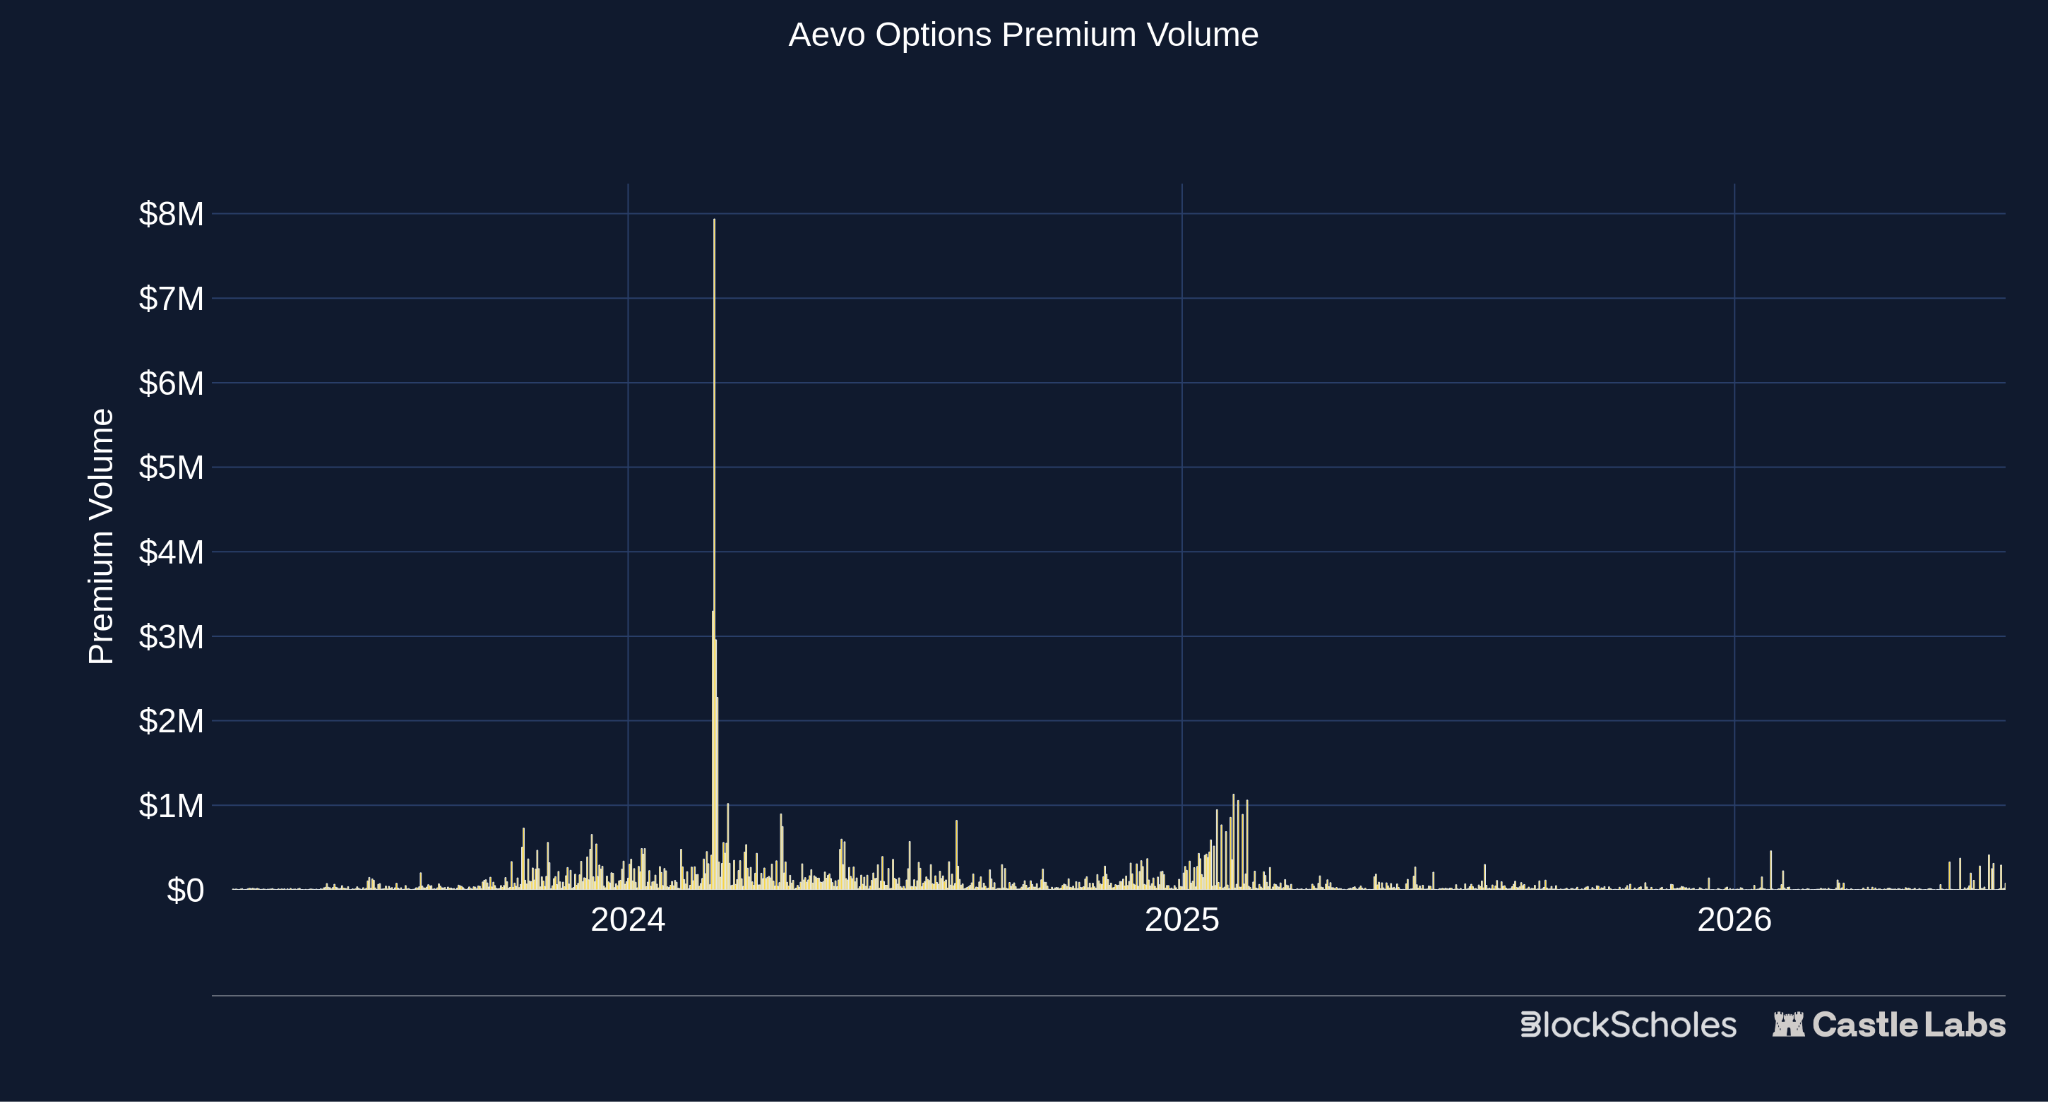
Figure 9 (CL) Aevo Options Premium Volume - DefiLlama
Incentives likely support some of this activity. Aevo distributes 1M AEVO per week through trading rewards, with 30% reserved for options, which may partly explain the recent uptick in options volume. Despite Ribbon being one of DeFi’s earliest options teams, focused on options vaults, Aevo’s migration to a broader derivatives exchange drew attention to perps, pre-launch markets, and trading campaigns. Options now look more like a secondary product with less focus, rather than the core business, and while the team are clearly trying to boost activity there, it remains to be seen whether these incentives can fully revive the options markets for Aevo.
Beneath Derive, Rysk and Aevo, the rest of the market is smaller and fragmented.
Paradex is another broad derivatives venue, built by the Paradigm.co team, a provider of institutional crypto derivatives liquidity. Currently offering perps, options, and various Vault Traded Funds (VTFs), Paradex used to support perpetual options, but has recently paused this feature to focus on dated options, which opened in April of this year. To further encourage traders and gain market share, they have reintroduced zero-fee trading for makers and takers across perps, spot, and options.
Hypersurface looks more similar to Rysk, using covered calls and cash-secured puts to provide a yield product on HyperEVM. CallPut expands beyond crypto, differentiating from other platforms by offering a range of stocks, including SPCX, TSLA, NVDA, and COIN, in its vanilla call and put options exchange, which operates via request-based execution and protocol-managed liquidity.
Kyan has evolved from Premia into a wider derivatives exchange, using an orderbook-based model with support for RFQs. It offers portfolio margin and multi-leg combo trades to build more customised positions.
Ithaca offers a wide range of options, strategies, and structured products, and has recently integrated AI agents into its protocol for managing options strategies.
SOFA.org offers structured products, packaging option-like outcomes into products like Earn and Surge, rather than the user trading options directly.
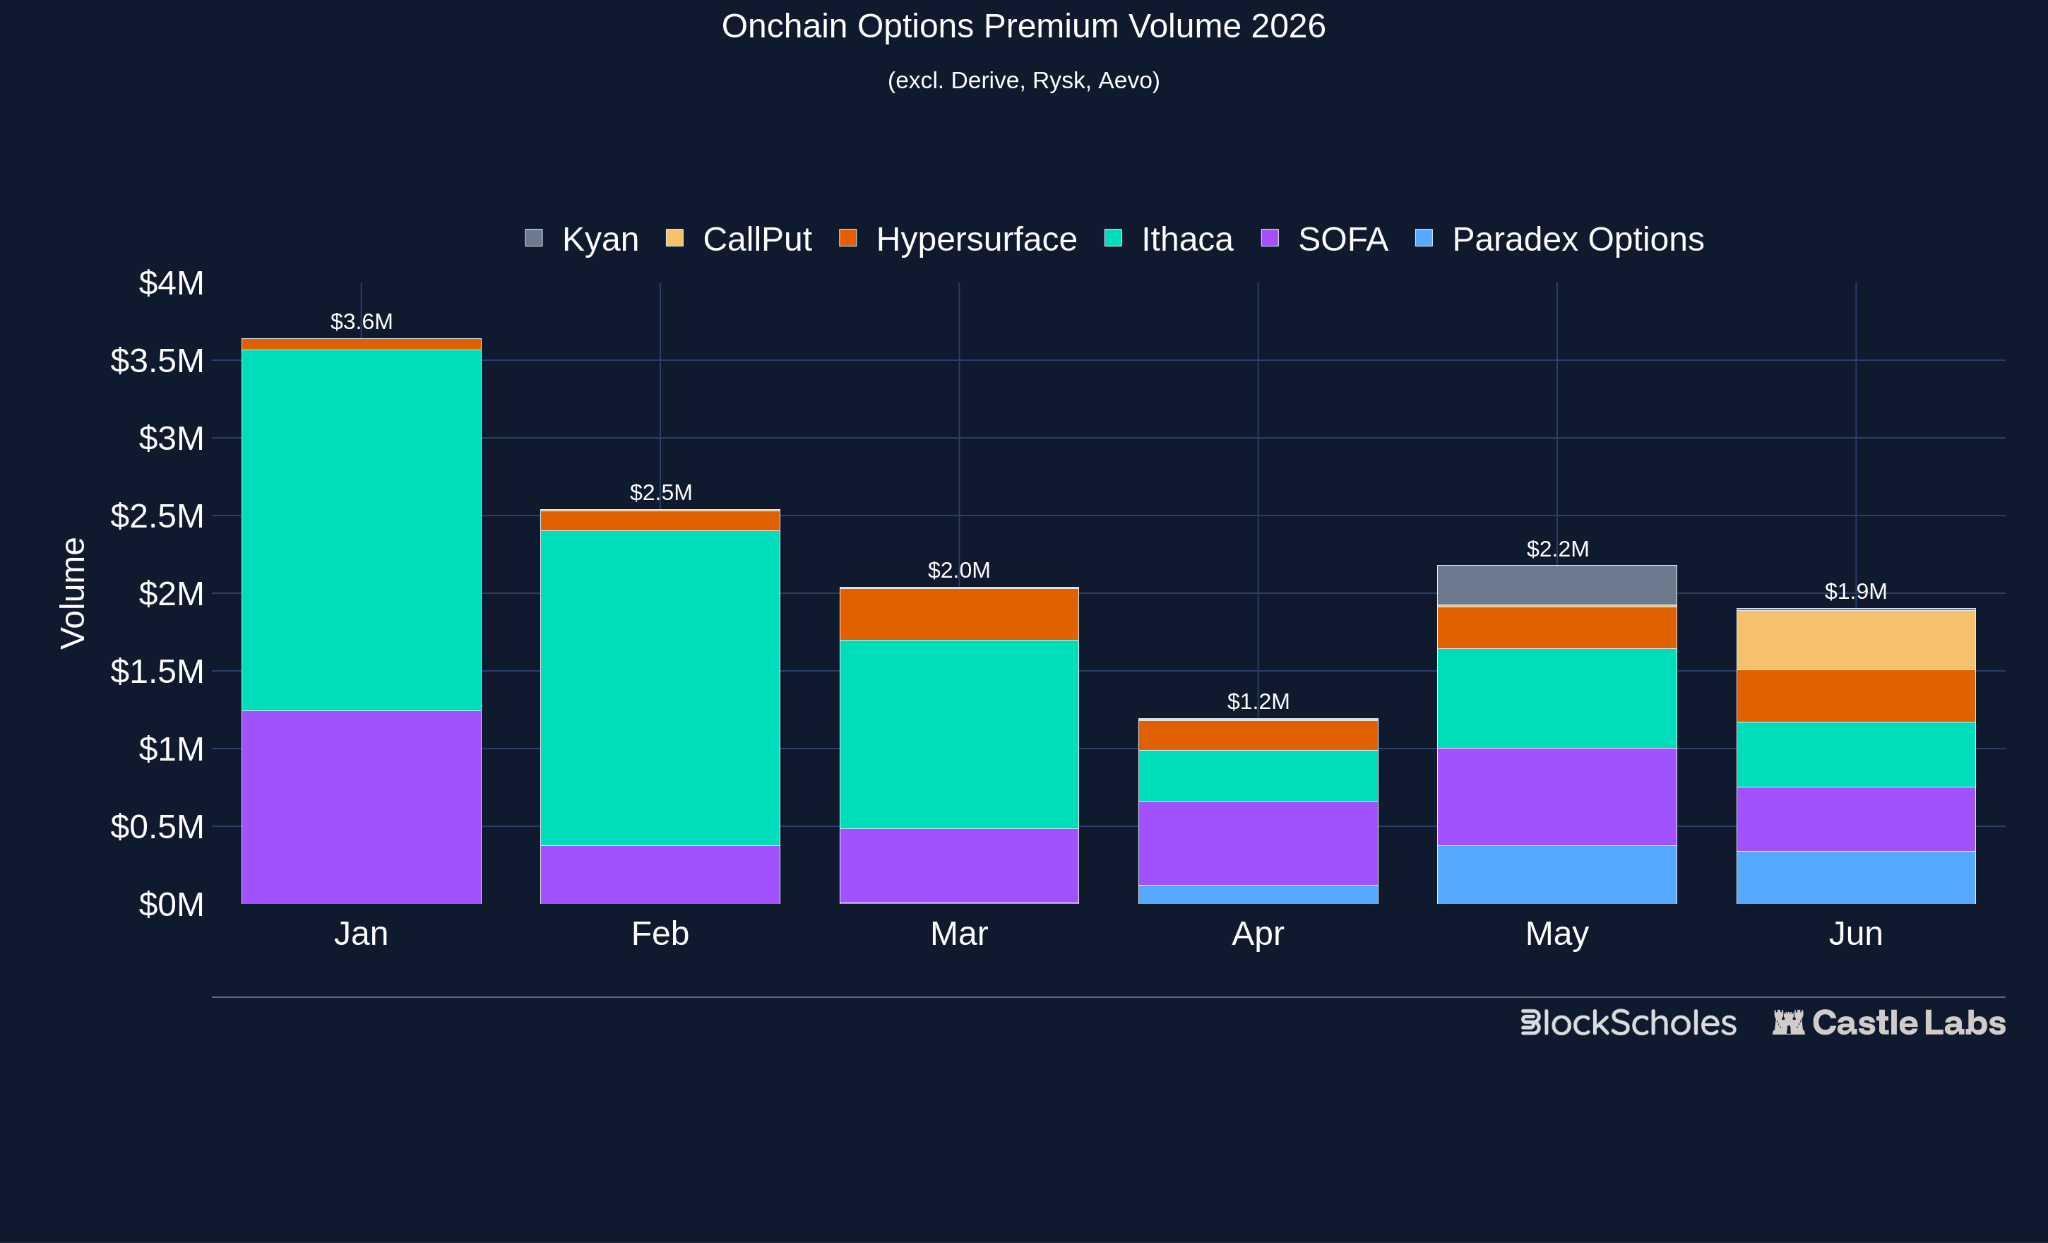
Figure 10 (CL) Options premium volume in 2026 excluding Derive, Rysk, and Aevo
The market is becoming more diverse at the lower end, with new entrants like Kyan, Paradex, and CallPut capturing share of premium volume in recent months.
Many protocols are now building better infrastructure, but infrastructure is not enough. Orderbooks, RFQs, cross-margin and portfolio margin do not create demand by themselves. Users still need a reason to choose options over perps for direction or prediction markets for events. The clearest demand appears when options are tied to a specific asset-holder problem, as with Rysk and HYPE: they offered newly wealthy HYPE holders yield, the ability to manage their entries and exits, and a way to monetise exposure without simply selling the asset. To achieve stronger growth, teams need to craft user-targeted products that perps and prediction markets cannot easily replicate.
By exotic and short-dated options primitives, we mean option-like products that go beyond simple listed calls, puts, and spreads. These may remove fixed expiries, derive exposure from AMM liquidity, or settle based on whether the price reaches a specific zone within a short time window.
Vanilla onchain options are no doubt becoming more sophisticated and professional, but they still largely replicate familiar offchain products. Exotic and short-dated primitives, on the other hand, expand the design space and case studies, experimenting with payoffs that are harder to deliver through standard listed options: perpetual convexity, AMM-native exposure, and ultra-short-dated touch markets. Most of these ideas remain commercially unproven, often solving an interesting payoff-design problem before they solve a user-demand problem.
Perpetual options remove the expiry variable from the equation. Instead of choosing a fixed expiry, traders hold a continuous convex exposure funded over time, much like a perpetual futures contract, but with greater upside potential. Squeeth is the historical example that gave users exposure to ETH², while Paradex has also tested perpetual options, though its current live options markets are dated only.
The problem, especially when compared to traditional perps, is that removing expiry does not remove complexity. Users still need to understand convexity, but now also need to manage the ongoing funding or premium cost and decide when holding the exposure no longer justifies the payoff. That weakens one of the core benefits of a standard option: knowing in advance the premium you will have to pay and the payoff. Perpetual options remain an interesting primitive, but have not yet made the product simpler or more widely adopted.
Traditional options platforms fragment liquidity across strikes and expiries, where market makers need to update quotes after every price move. Despite improvements in faster, cheaper chains, this still remains a difficult task, especially on Ethereum mainnet, and often relies on offchain matching. Panoptic and GammaSwap instead create option-like exposure using AMM liquidity.
Panoptic uses Uniswap V3-style liquidity ranges to create perpetual options. Instead of paying a fixed upfront premium for a fixed expiry, buyers pay streaming premia over time, while liquidity ranges act as the basis for strikes and option exposure. This way, options can be created for long-tail assets already trading on AMMs without requiring a separate orderbook. Panoptic V2 just launched, offering perpetual options trading on ETH and SPCX. On the other side, depositors can enter either the Unicorn vault, which remains delta-neutral and scalps gamma, or the PLP Vault, which uses deposited ETH liquidity to earn Uniswap fees, Panoptic premia, and lending fees.
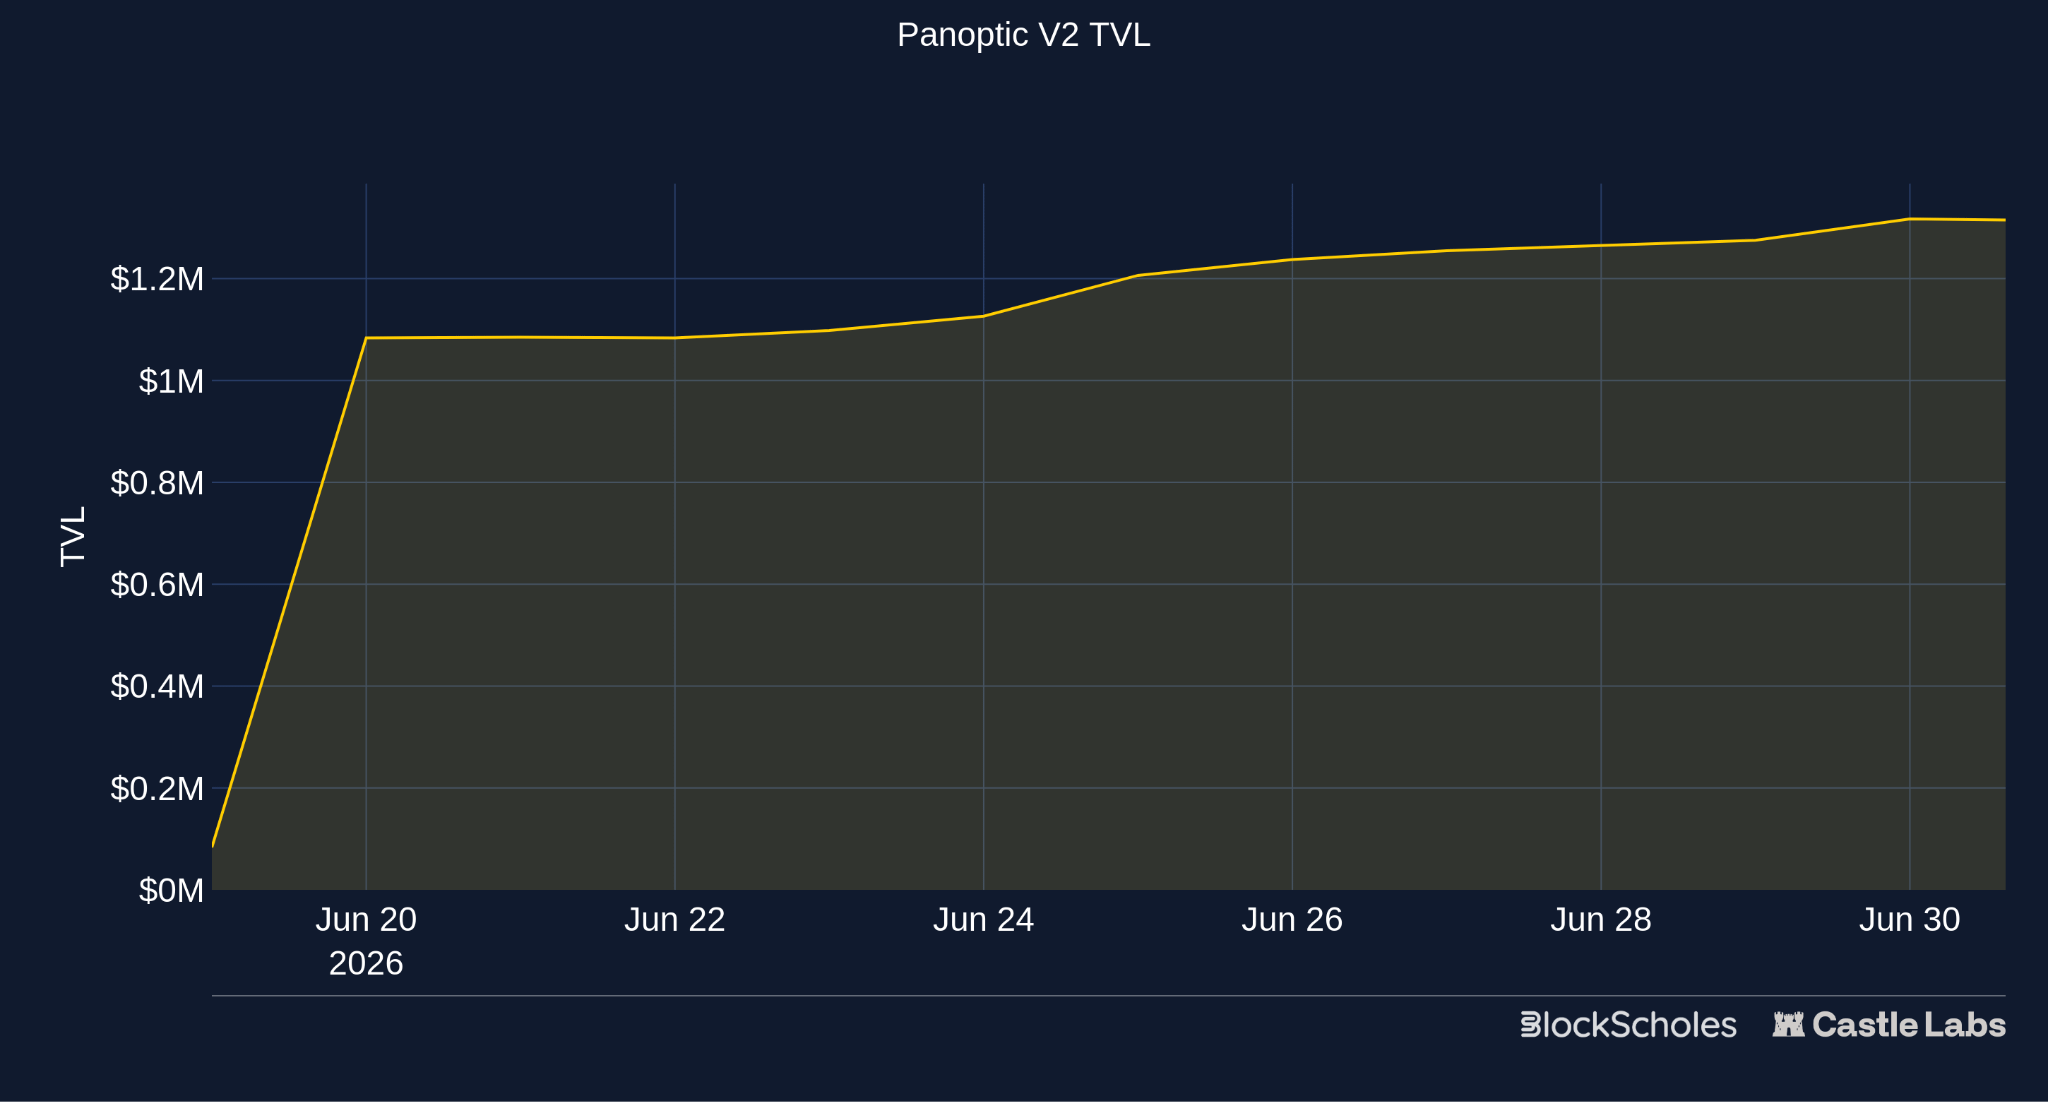
Figure 11 (CL) Panoptic V2 TVL
GammaSwap took a different angle with its V1, allowing users to borrow AMM liquidity and create perpetual option exposure. This made it possible to hedge impermanent loss or speculate on token volatility without an oracle.
These products are among the most complex DeFi-native designs in the category. Panoptic, for example, whilst it removes expiry fragmentation, also introduces streaming premia, liquidity widths and AMM range mechanics, meaning users of the product need to be comfortable with Uniswap V3 and the complexities of providing liquidity. GammaSwap, on the other hand, has now moved on entirely, looking to overcome its capital-efficiency and complexity issues by creating crypto-focused binary markets using an order book. This gives users a simple, convex trade without the risk of liquidation. In these markets, users are either right and they win, or wrong and they lose.
This bucket is probably the furthest from standard calls and puts. Instead of buying upside or downside exposure at a fixed strike and expiry, the user chooses a simple condition over a short window: will the price enter this zone, finish above this level, or resolve in-the-money within the next few minutes?
Euphoria’s Tap Trading is the newest onchain example of this design. Users select a grid square representing a price range over a five-second window. The payout is quoted upfront by professional market makers and varies with the distance from spot, the time remaining, and volatility. If price enters the selected zone before expiry, the trade wins. If it does not, the trade expires worthless.
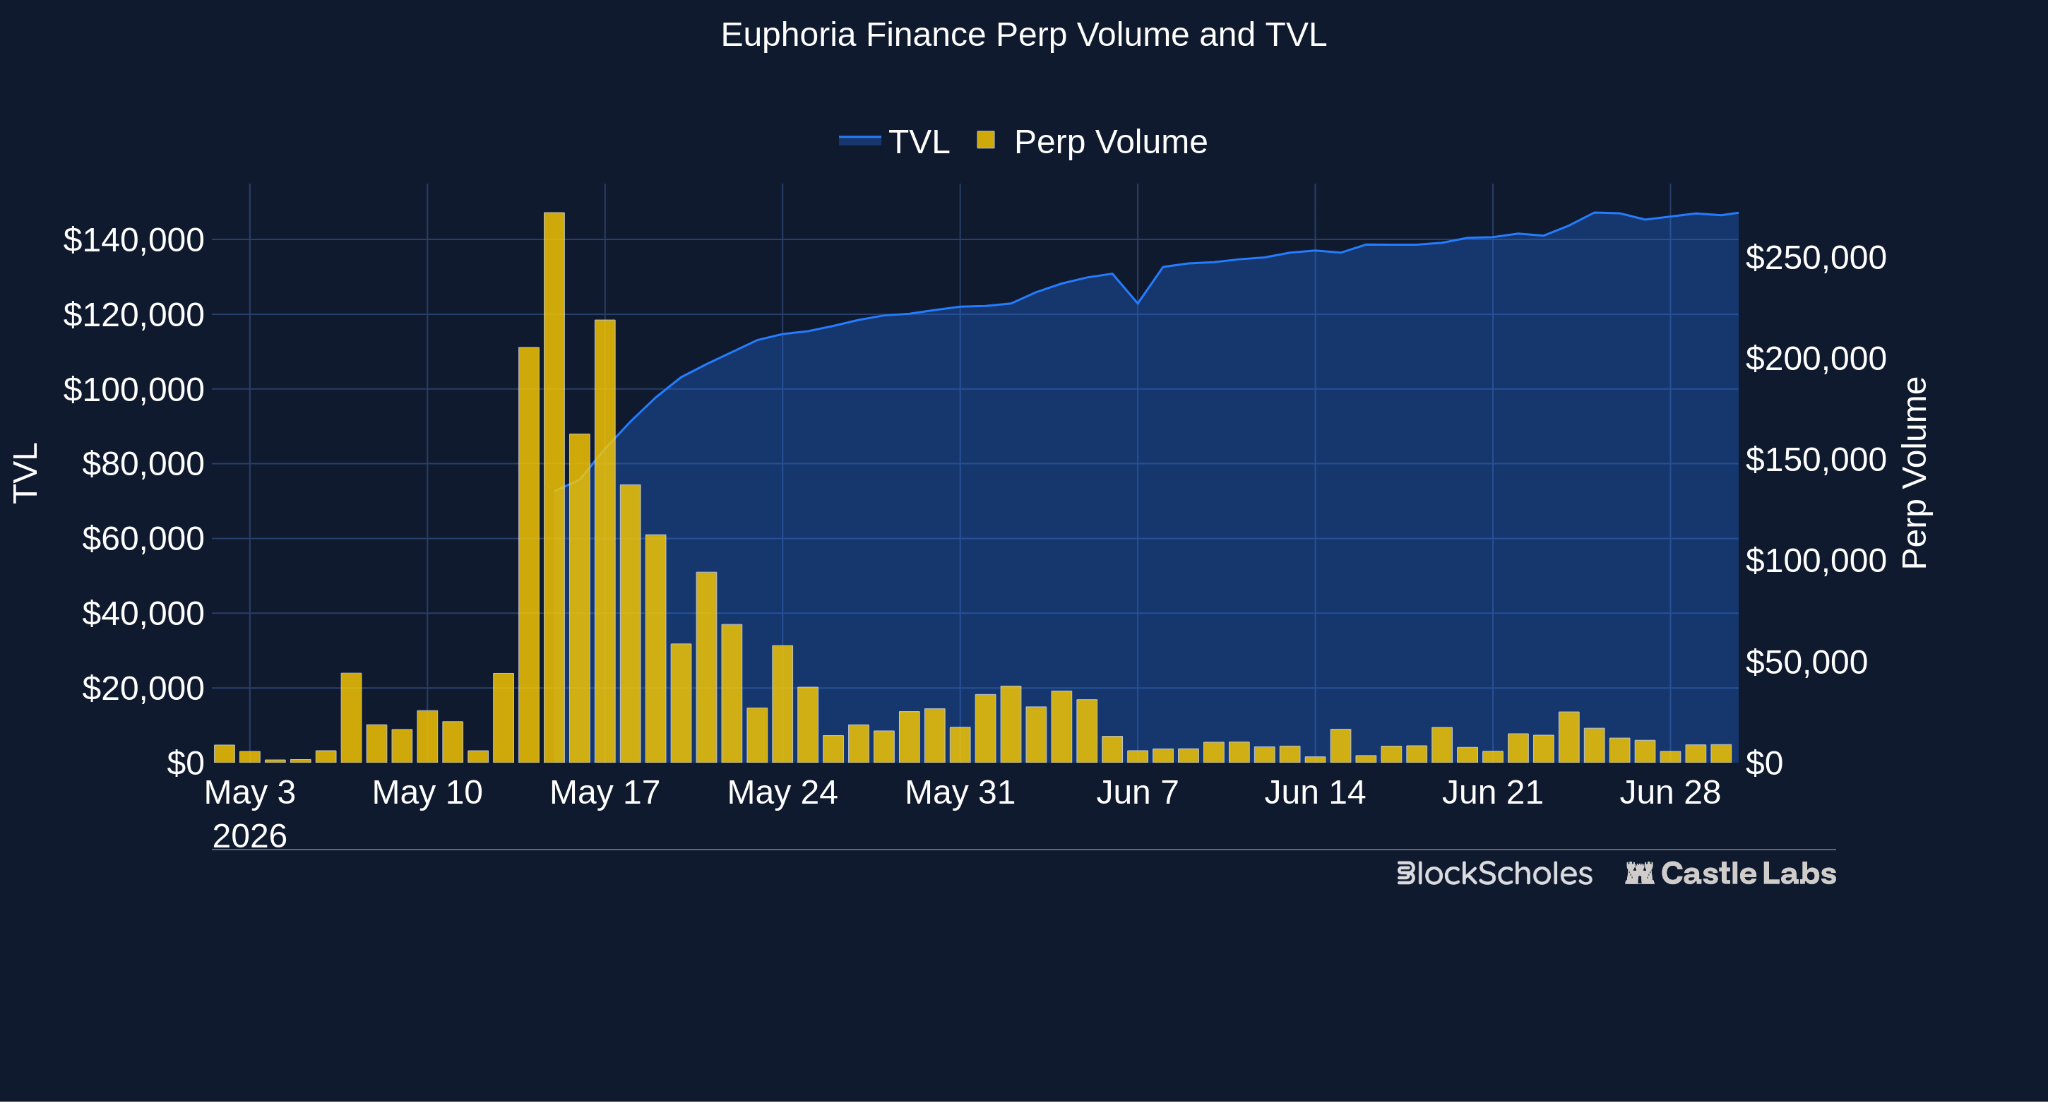
Figure 12 (CL) Euphoria Finance Perp Volume and TVL
This product moves in a similar direction to GammaSwap V2’s binary markets. The target user wants to bet on crypto prices over increasingly short timeframes, so the product competes less with traditional options exchanges and more with perps, prediction markets, and mobile betting. The appeal is simplicity: users can understand the trade quickly and access convex exposure without managing funding rates, liquidations, greeks or theta decay.
The emerging popularity of prediction markets among retail participants is the first real example of products with non-linear payoffs gaining significant onchain traction. However, prediction markets on financial assets, such as BTC Up/Down markets, are structurally identical to binary options – a well-known and well-studied instrument in Traditional Finance. Each contract pays out a fixed amount if a condition is met at expiry, and $0 otherwise.
In the image below, the ‘Up’ contract is priced at 44¢, meaning a trader can pay 44¢ for the chance to receive $1 if BTC trades above $63,605 by the expiration timestamp of Jun 12, 6:50 AM ET.
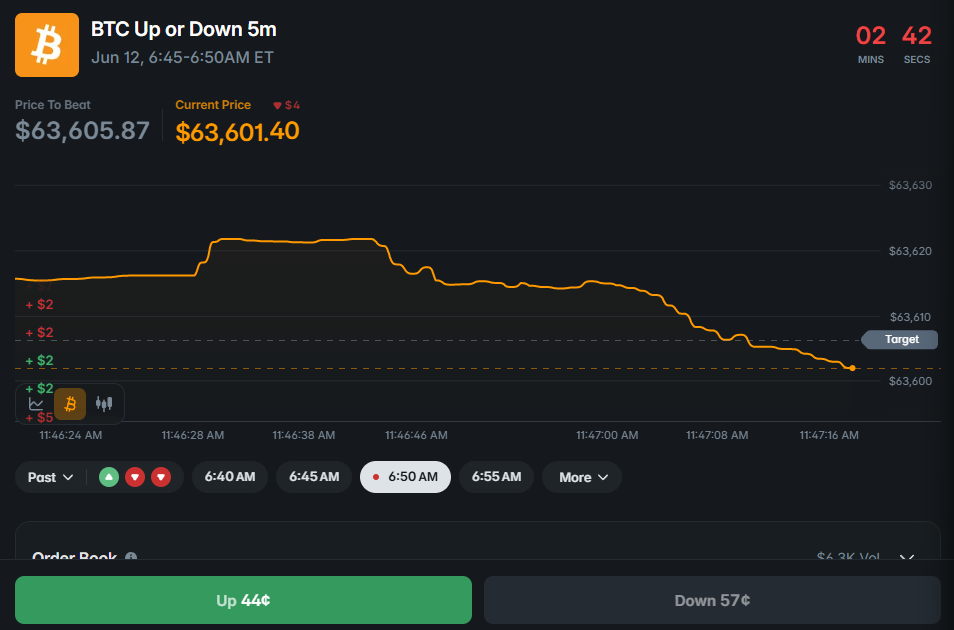
Polymarket BTC Up or Down 5m with up trading at 44¢ and Down trading at 57¢.
Binary option prices (and therefore the prices of prediction markets on the same underlying asset) are uniquely determined by the prices of vanilla call options, a much more mature market than prediction markets. The binary option at each strike has a single price that is uniquely determined by the surrounding vanilla options market. We’ll show how the binary is built from ordinary call options and why the process results in a unique price:
A call option gives a buyer the right to buy the underlying asset at a fixed price known as the strike. If the asset’s price ends above the strike at expiry, the call is worth the difference between them; if below, it expires worthless.
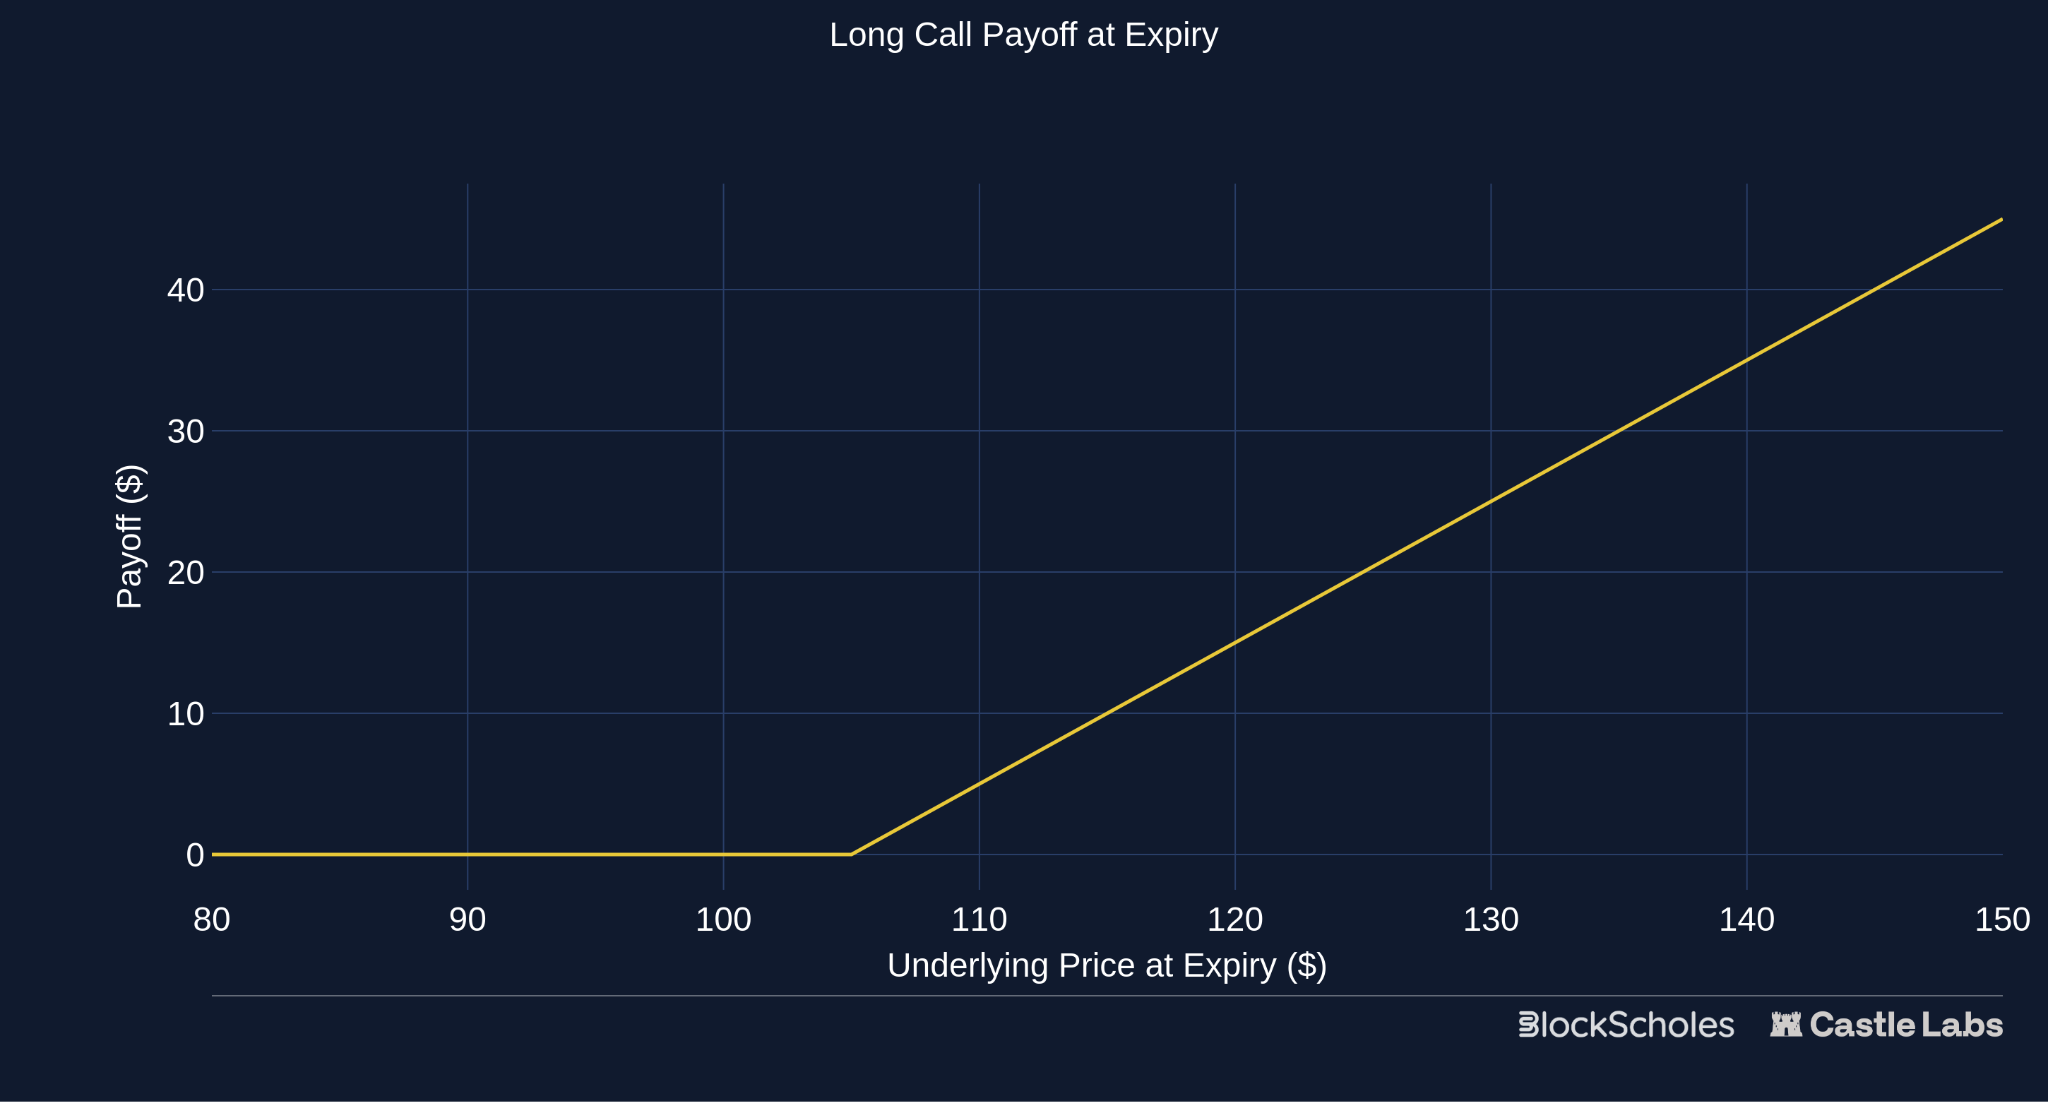
A call spread is a combination of two calls on the same underlying: buy a call at a lower strike and sell another call at a higher strike. The result is a payoff with three zones, the two extremes of which resemble that of a binary option:
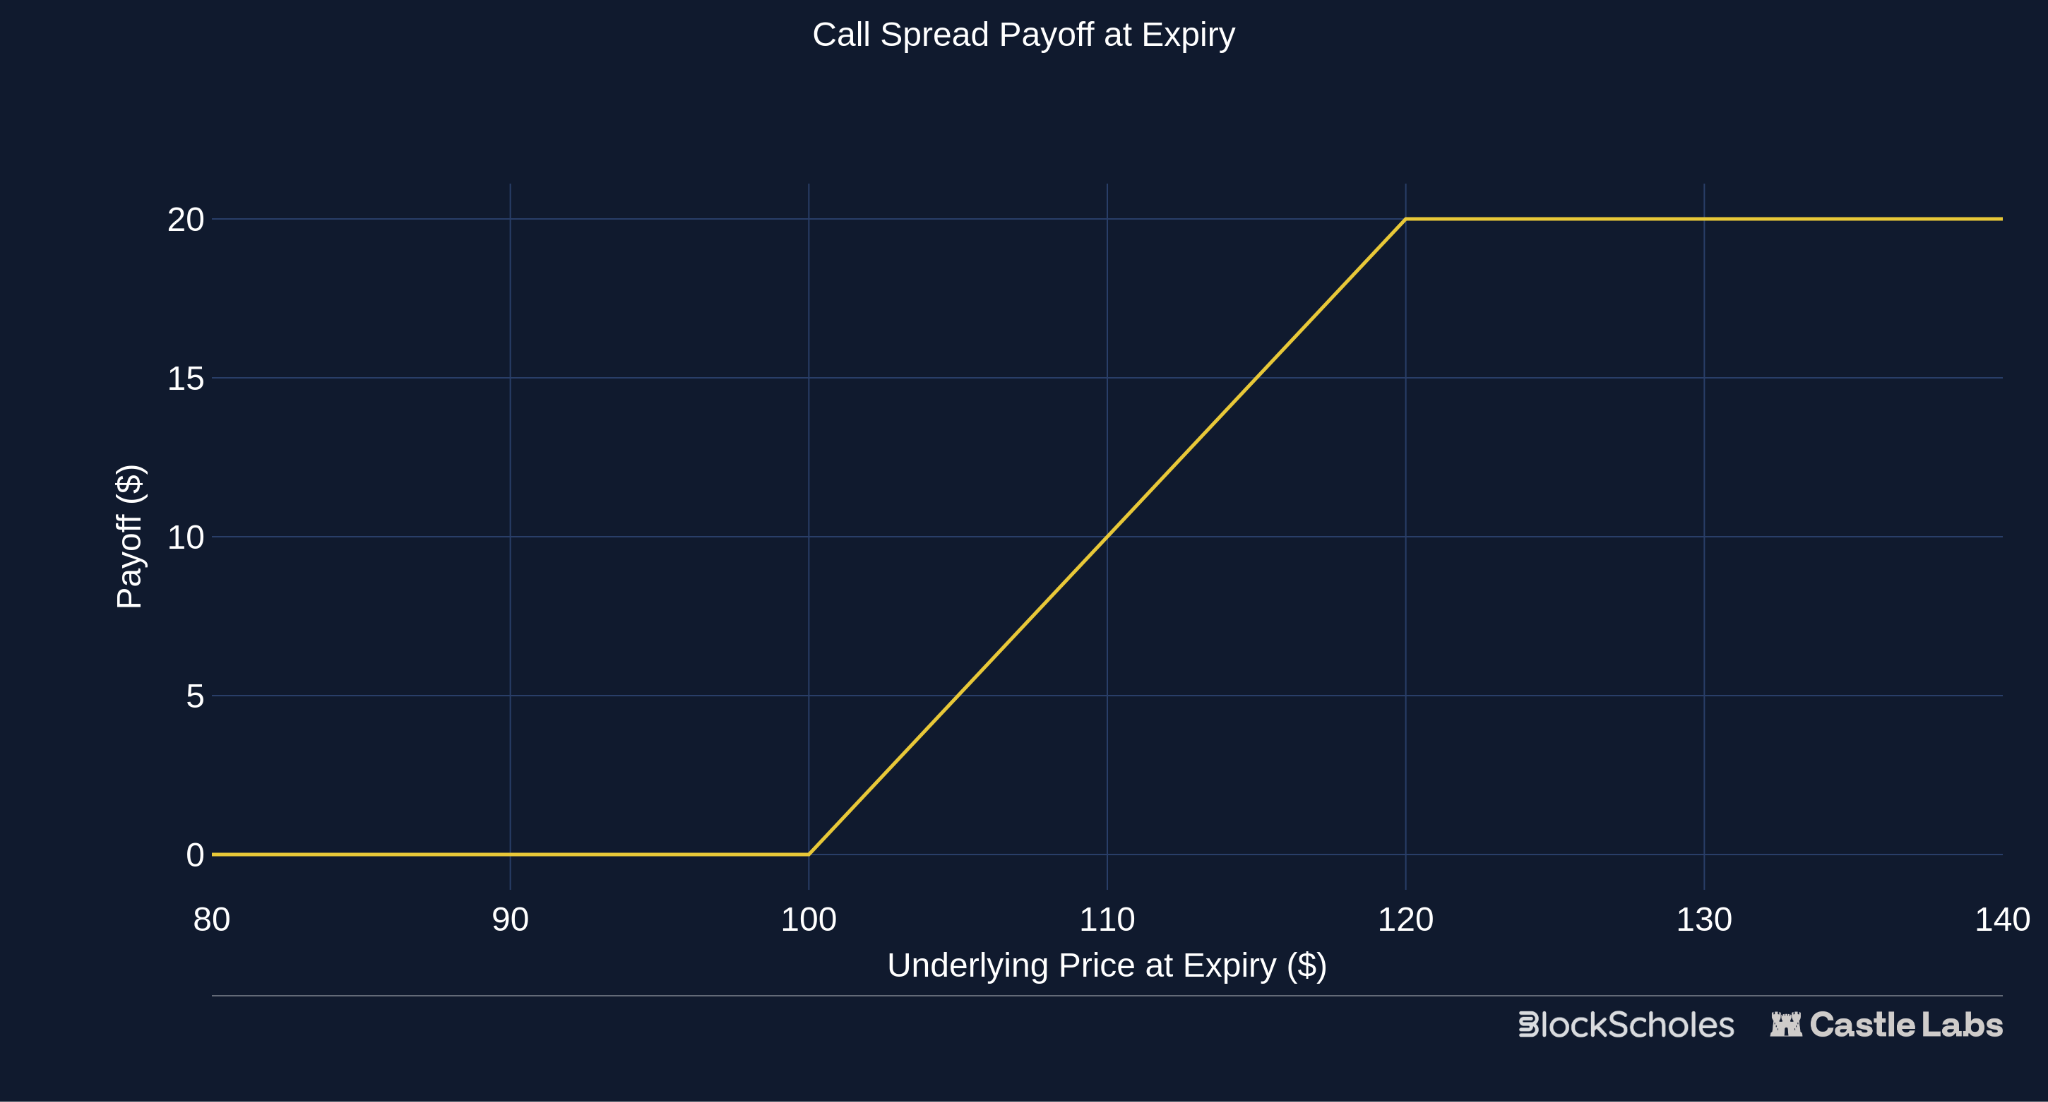
To get a payoff structure resembling a binary option, we must remove the linear increase in value for terminal spot prices between the two strikes, essentially ‘squeezing’ the call spread strikes together.
Initially, we bought one call option with a lower strike and sold one call option with a higher strike. Our ‘linear increase in value’ zone of the payoff represents how far apart the two strikes are. The wider apart the strikes, the wider the linear payoff zone; the closer the strikes, the closer the linear payoff zone resembles that of a binary option.
As visualised in the above chart, the capped payoff of call spreads is equal to the difference in strikes:
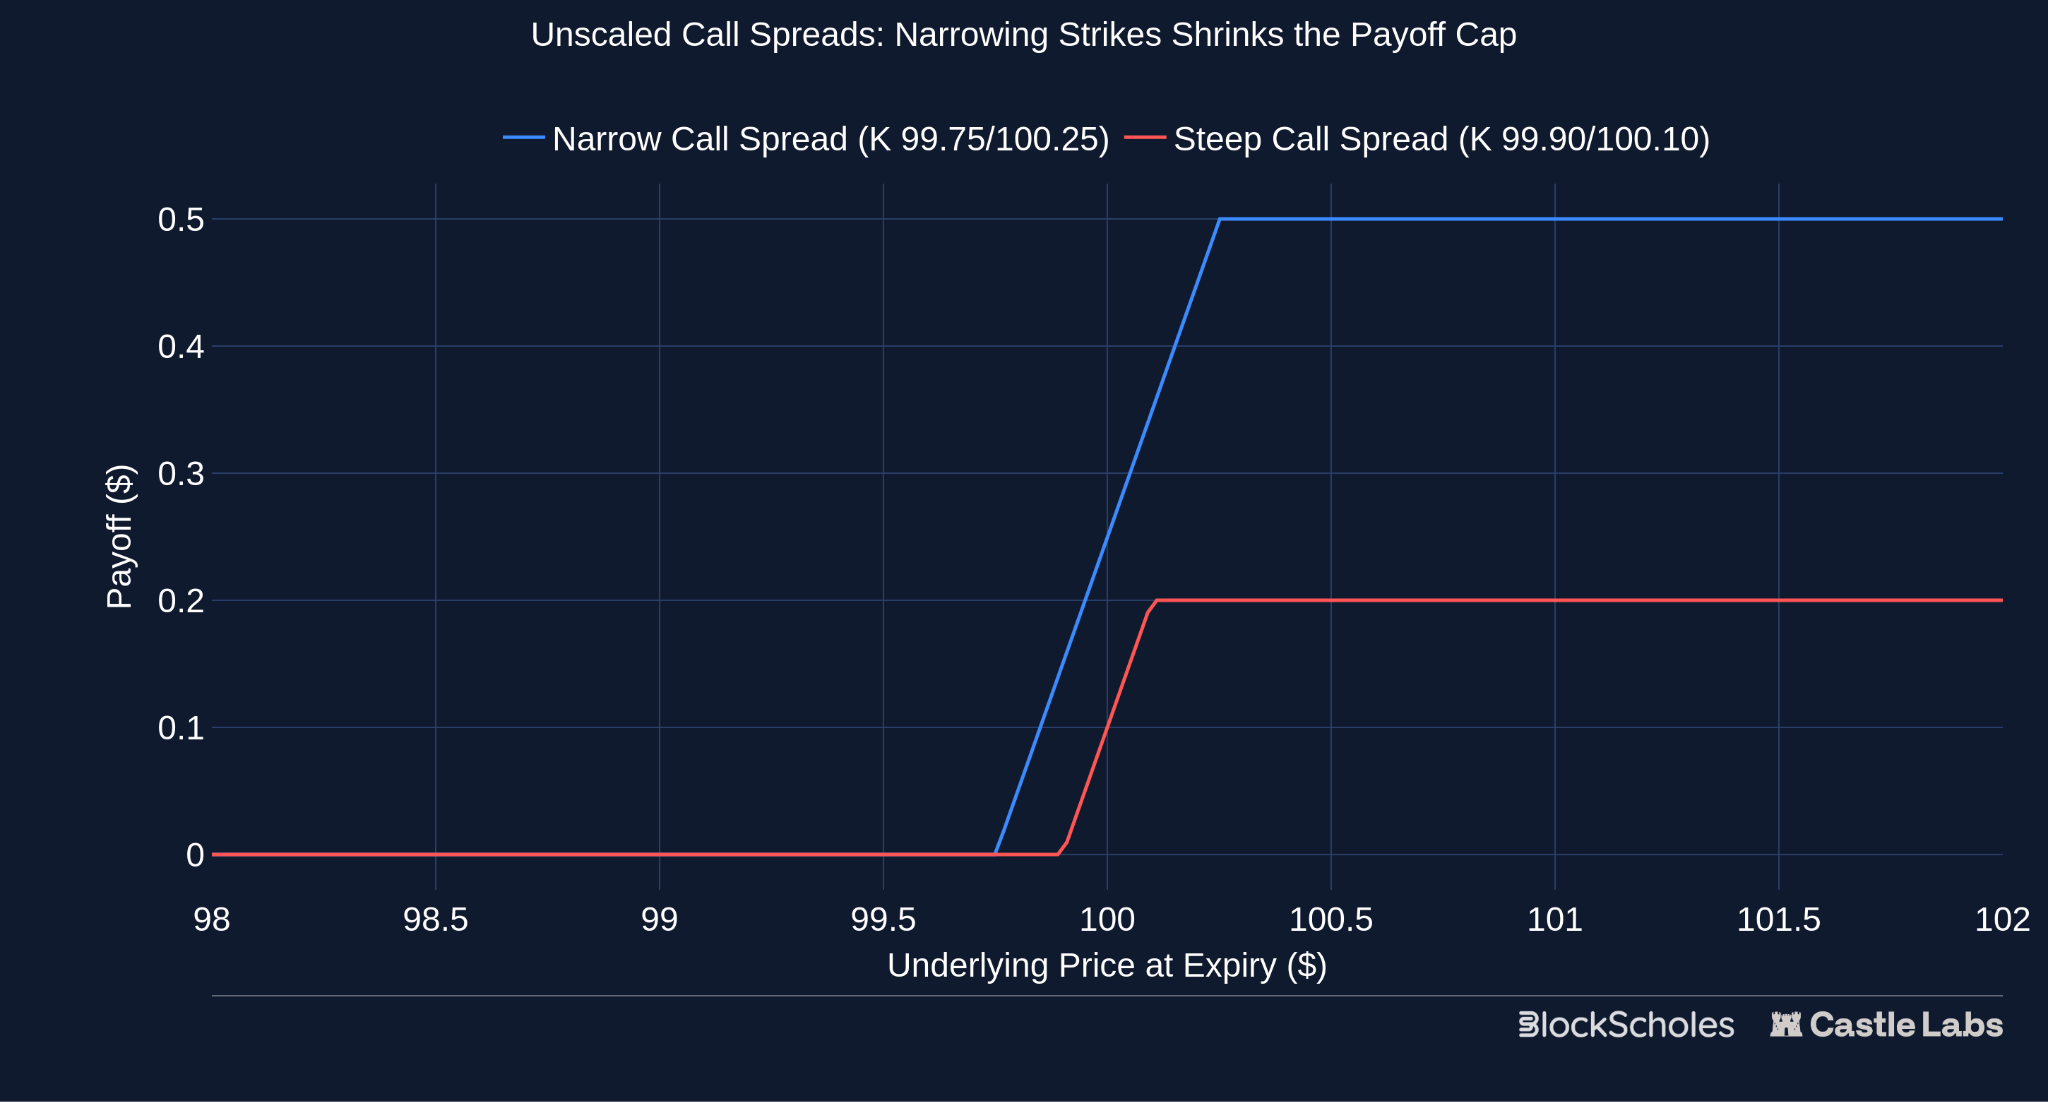
As strikes get closer and closer, the payoff cap shrinks towards 0, so you must scale the trade to maintain a payoff cap at $1. This is done by dividing the cost of the spread by the strike difference — Scaled Binary Cost = (price of lower call - price of higher call) ÷ (strike gap):
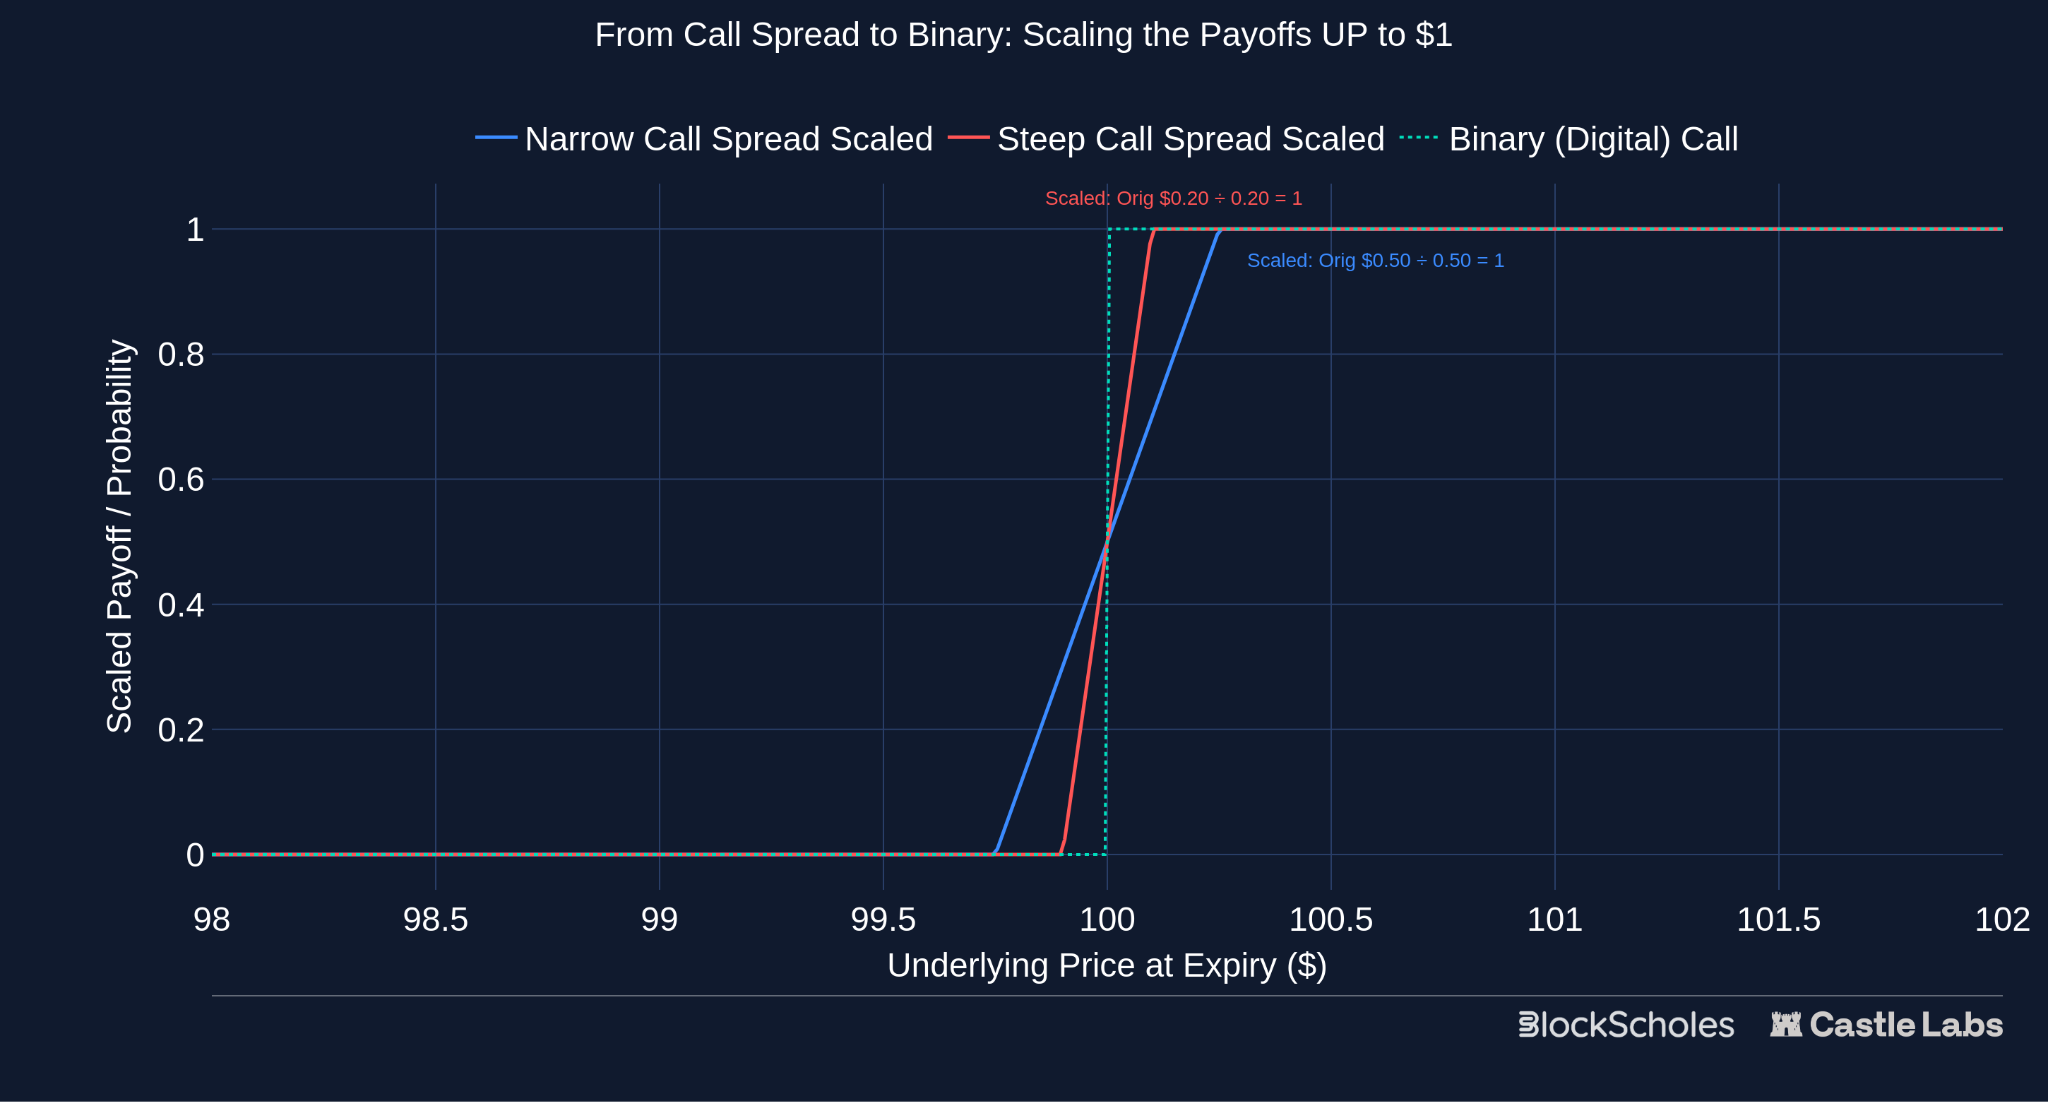
In the limit, as the strike gap approaches 0, the ramp becomes a vertical step from a payoff of $0 to $1. Because the scaled position and the binary have identical payoffs, no-arbitrage states that they must have the same price. If they didn’t, a trader could buy the cheaper options structure, sell the more expensive structure, then pocket the difference with no risk.
Prediction Markets (PMs) closely resemble traditional binary options.
This category as a whole is growing at an enormous rate and has consistently driven monthly volumes exceeding $30 billion over the past two months.
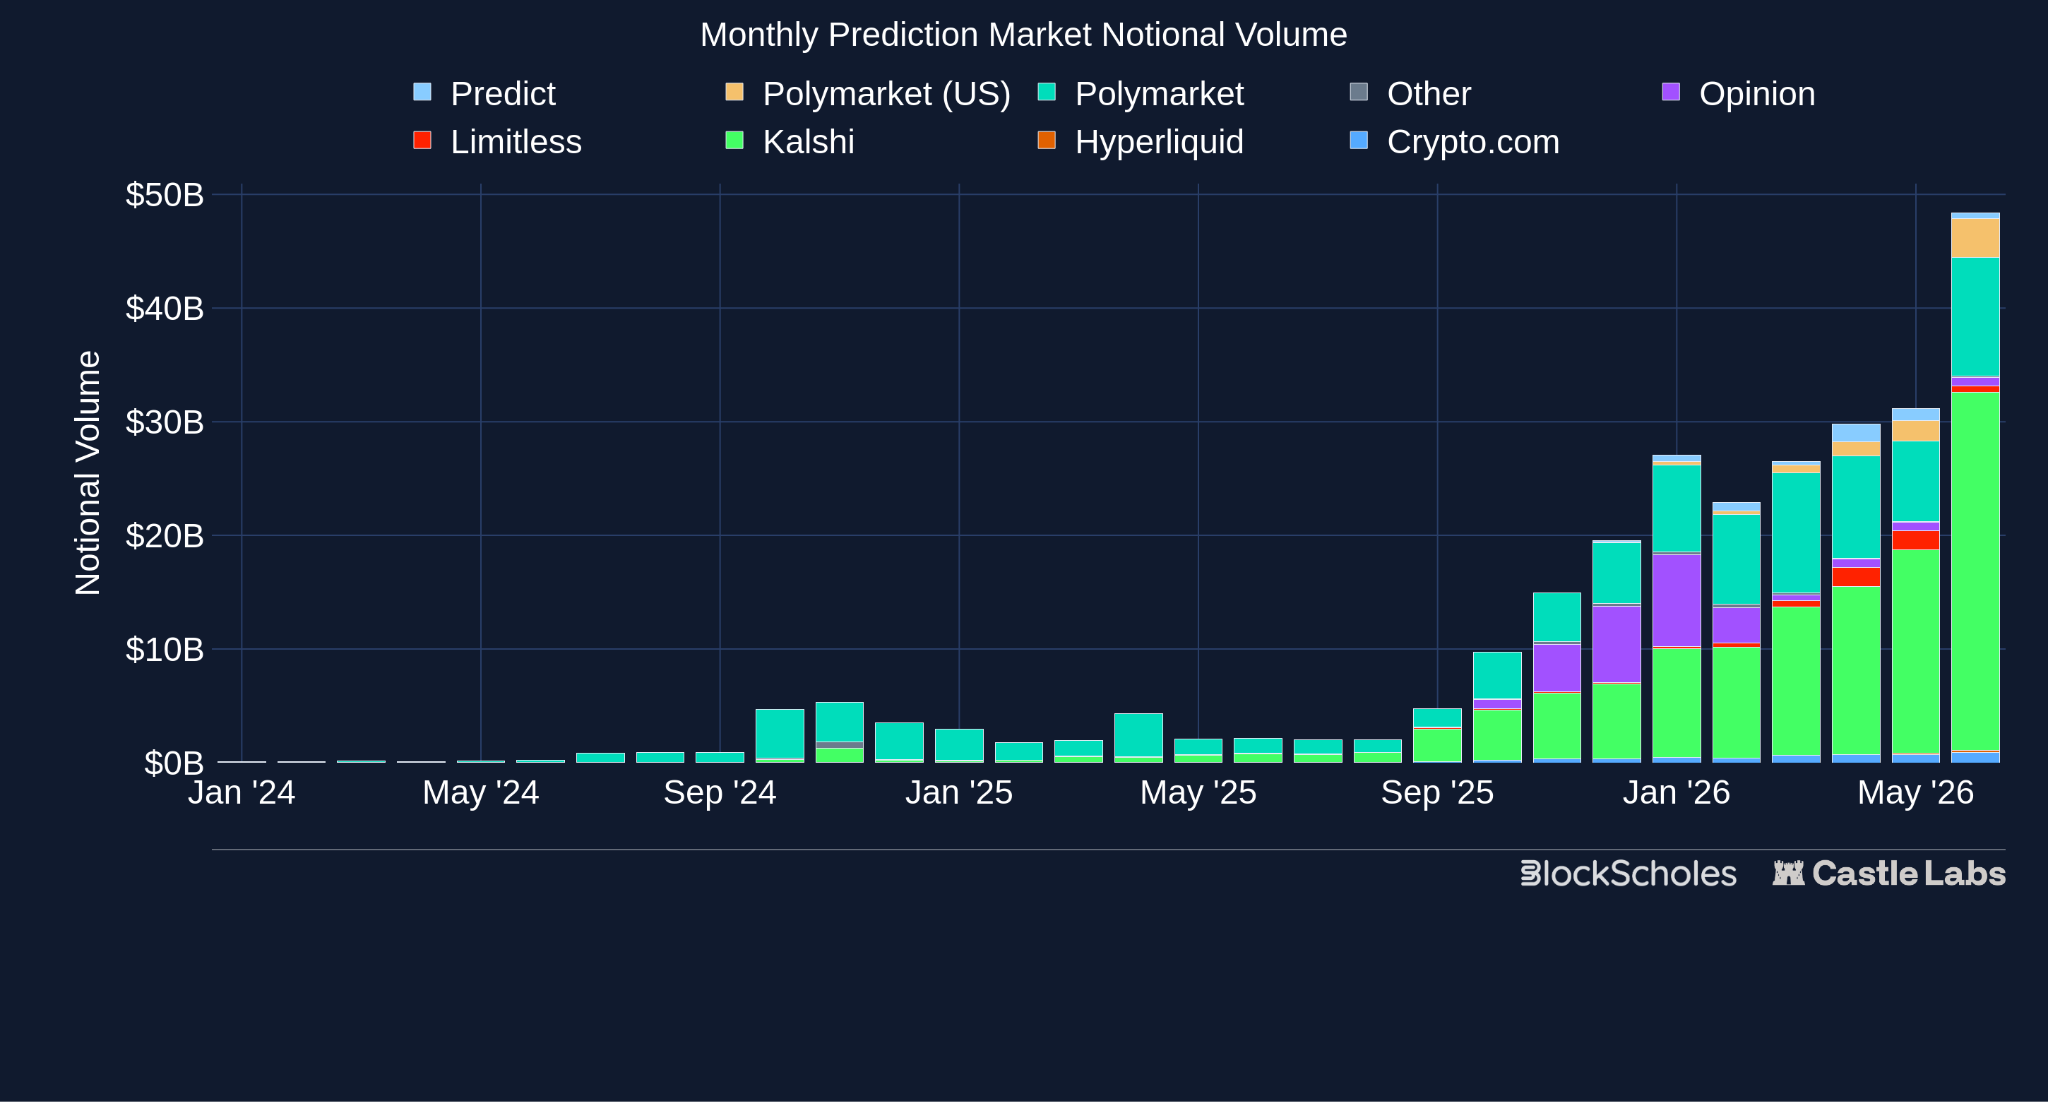
Figure 13 (CL) Monthly Prediction Market Notional Volume
In this section, we highlight the protocols driving this growth, how they function, how they compare in terms of the volumes they handle, the infrastructure supporting them, and how these platforms are evolving to replace traditional instruments to some extent.
Polymarket’s settlement infrastructure runs on Polygon PoS and utilises Gnosis’s Conditional Token Framework for the creation of a binary outcome contract. For liquidity, the platform relies on a hybrid CLOB-based model, and users (market makers) are incentivised to provide liquidity.
Resolution path is an important factor for any PM: Polymarket sources its event resolution from the combination of UMA’s Optimistic Oracle and Chainlink for crypto price markets.
Regulatory alignment remains pivotal for expanding into multiple regions: In 2022, the platform received a CFTC order and was unable to provide access to U.S. customers. To reclaim this market, the platform acquired QCEX (a CFTC-licensed DCM) in 2025 to reenter the U.S. market. They are currently slowly rolling out Polymarket U.S.
The platforms’ monthly volume now exceeds $10 billion, primarily driven by categories such as crypto, sports, and politics.
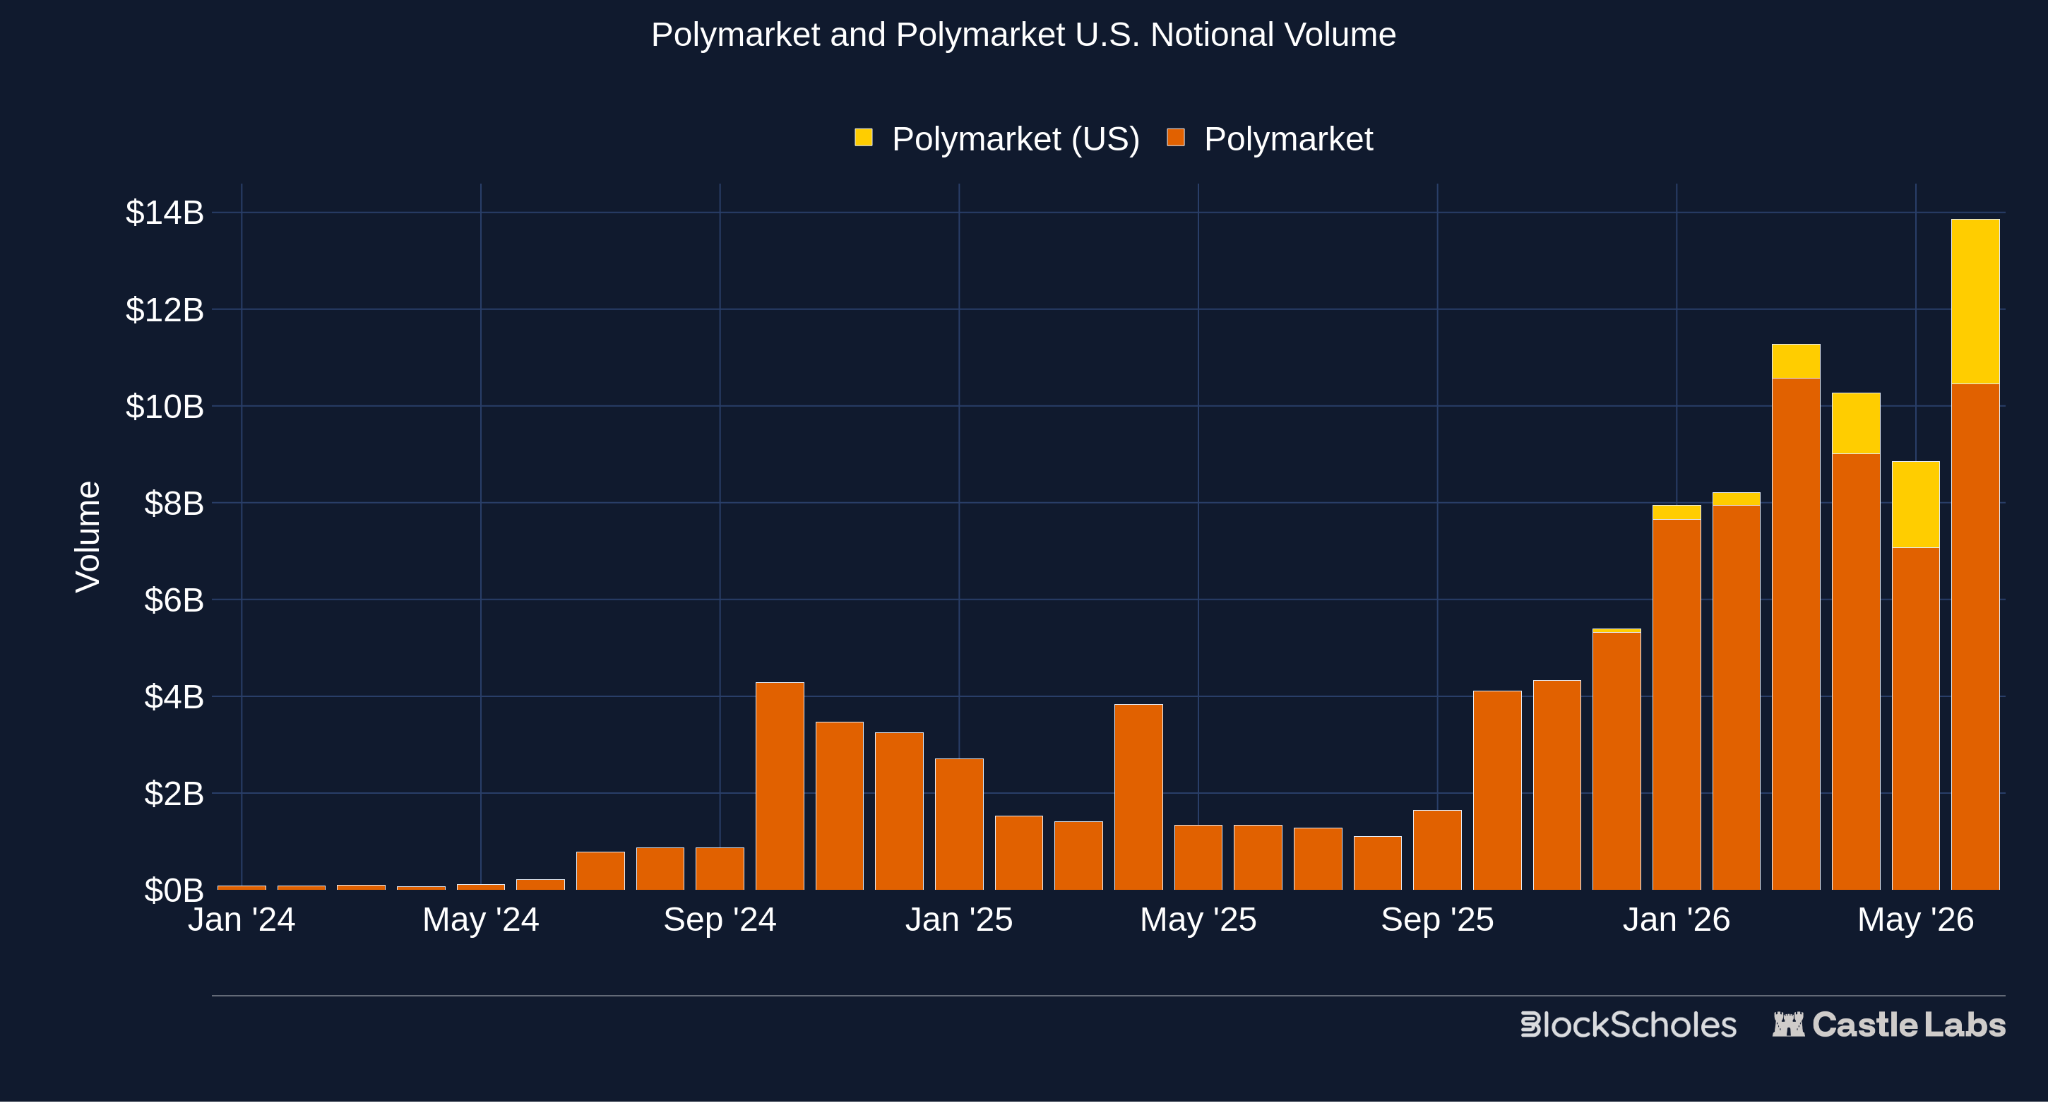
Figure 14 (CL) Polymarket and Polymarket U.S. Notional Volume
PMs’ crypto markets attract a ton of volume, as they offer a simpler design and appeal to audiences interested in trading binary options with ultra-low expiry time. Users can buy a simple “Yes” or “No” contract on whether the price of an asset like BTC will be above or below a certain number after 5 minutes, 15 minutes, 1 hour, and so on.
These markets are created automatically after the designated market period and are also referred to as “digital binary options” because of the fixed expiration time and binary payout structure, which settles at either $0 or $1.
Regarding options-related markets, Polymarket also went live with Volmex Volatility Index markets, which track the IV of crypto assets such as Bitcoin. However, these markets failed to attract much volume because there is a steeper learning curve to trade in such markets.
This makes the case for how PMs find PMF as a seamless instrument, abstracting the complexity of outcome events and gaining volume in simpler categories that require users to choose between two options, rather than in multi-outcome events that add complexity. Additionally, it highlights the divergence in audience between traditional derivative trading platforms and PMs, as the latter’s market structure is easier to understand and has a low barrier to entry.
Kalshi commands over 65% of the volume in prediction markets and has slowly outpaced its competitor, Polymarket. At one point, both platforms were trading at similar valuations, but now Kalshi is eyeing $40 billion, while Polymarket is targeting $15 billion for its next round. The gap between them widened primarily due to Kalshi’s regulated approach, its dominance in the U.S., and its collaboration with platforms like Robinhood.
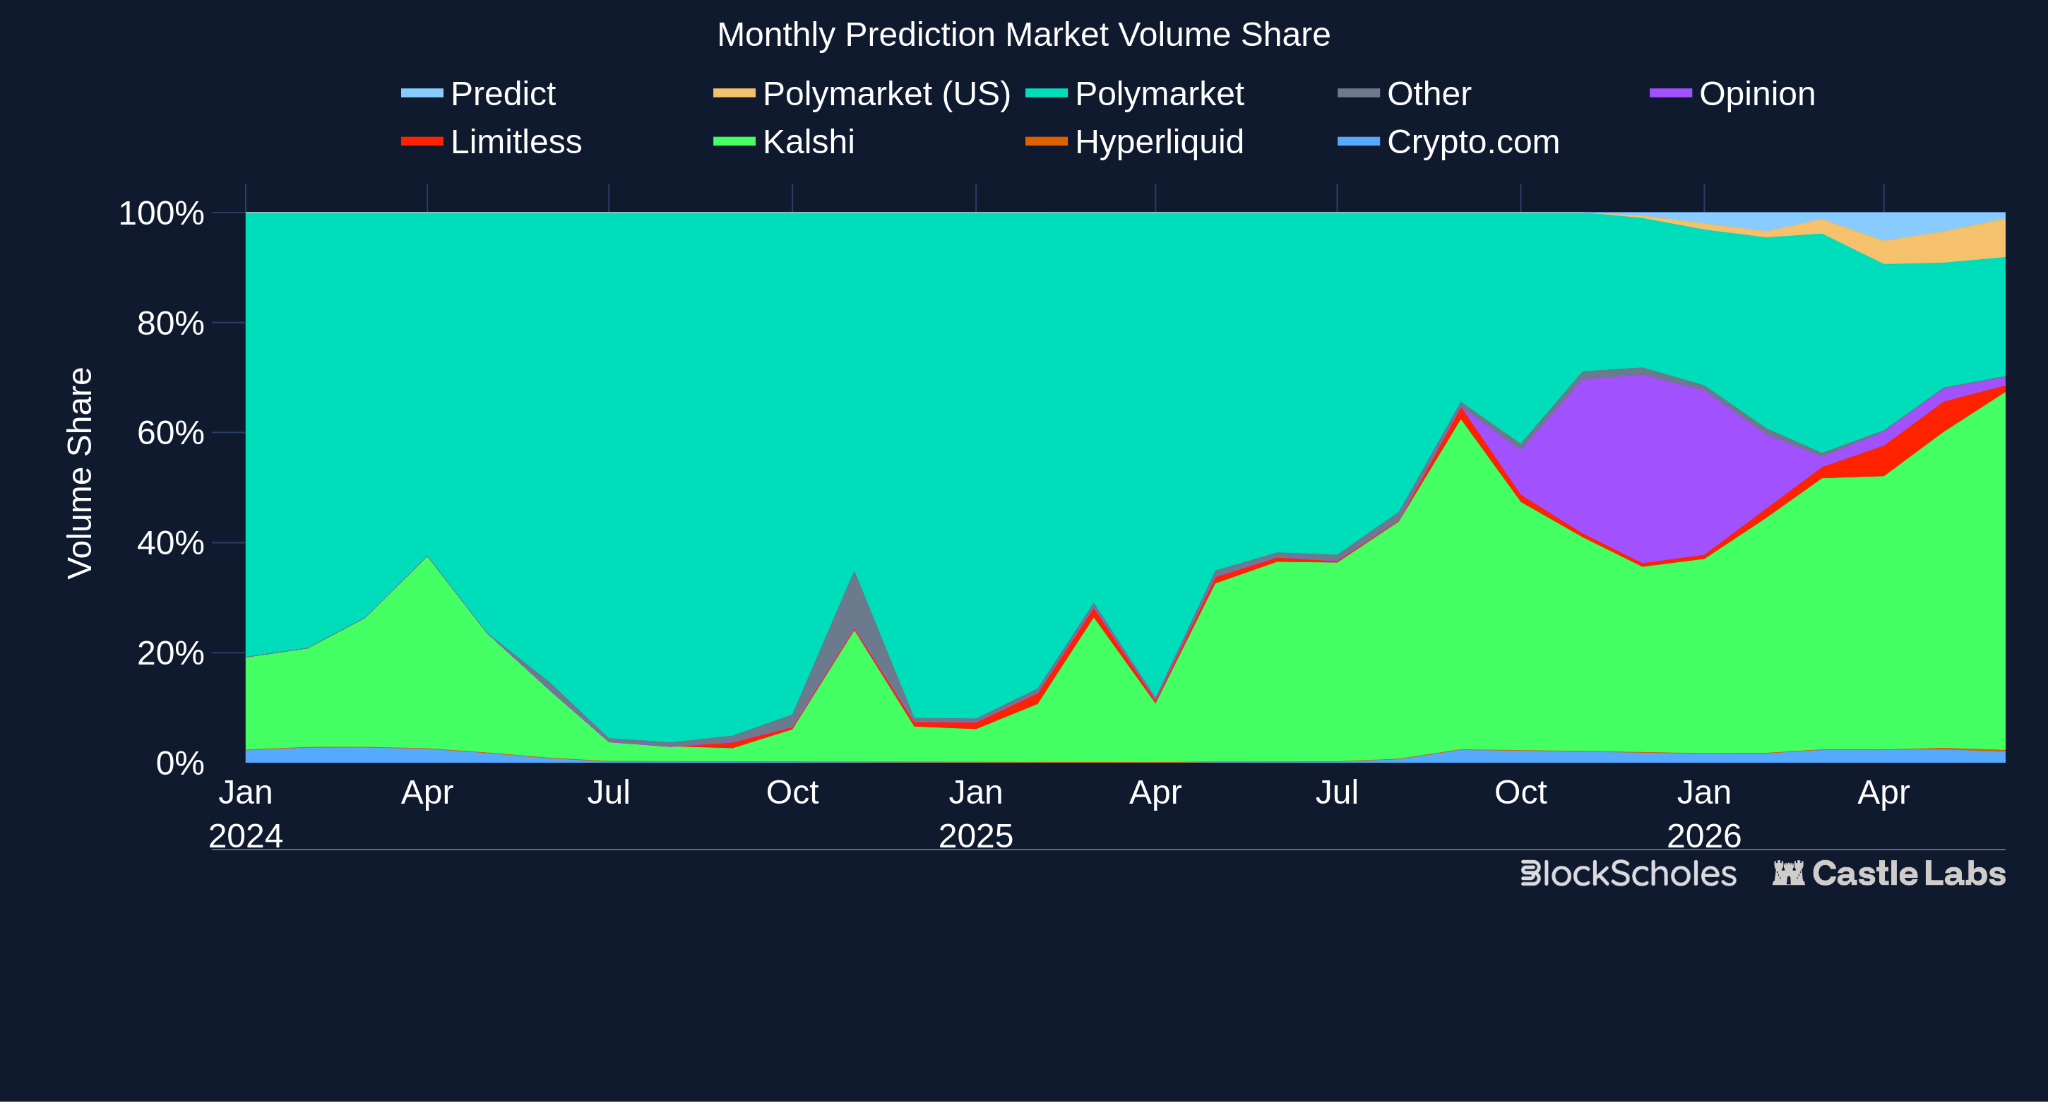
Figure 15 (CL) Monthly Prediction Market Volume Share - @datadashboards
Similar to Polymarket, Kalshi also offers 5-minute and 15-minute crypto markets, making it more tied to binary options. Their liquidity sourcing model is also similar, based on a CLOB, while Kalshi has ties with institutional market makers.
Additionally, both Polymarket and Kalshi are launching their perps platform. Kalshi recently went live with it, becoming the first federally regulated perpetual futures trading platform in the U.S. It is currently making its way into the category and has reached daily perps volume of $1 billion, with OI growing steadily as well.
While most of the volume is driven by top products like Polymarket and Kalshi, a few products, such as Limitless, are also making their space in the category. They are one of the few products with a live token and have recently expanded their offerings through user-generated markets (UGMs), which enable users to create financial markets in a permissionless manner.
Structurally, Limitless is similar to Polymarket and Kalshi and offers comparable offerings, but their recent expansion into UGMs for crypto positions them differently. If UGMs can scale, they can become a custom binary option-like hedge instrument, where users can choose the price at expiry rather than have it set by the platform. Once they introduce other asset classes, such as stocks and commodities, the use cases could grow. This asset class expansion also applies to other PMs.
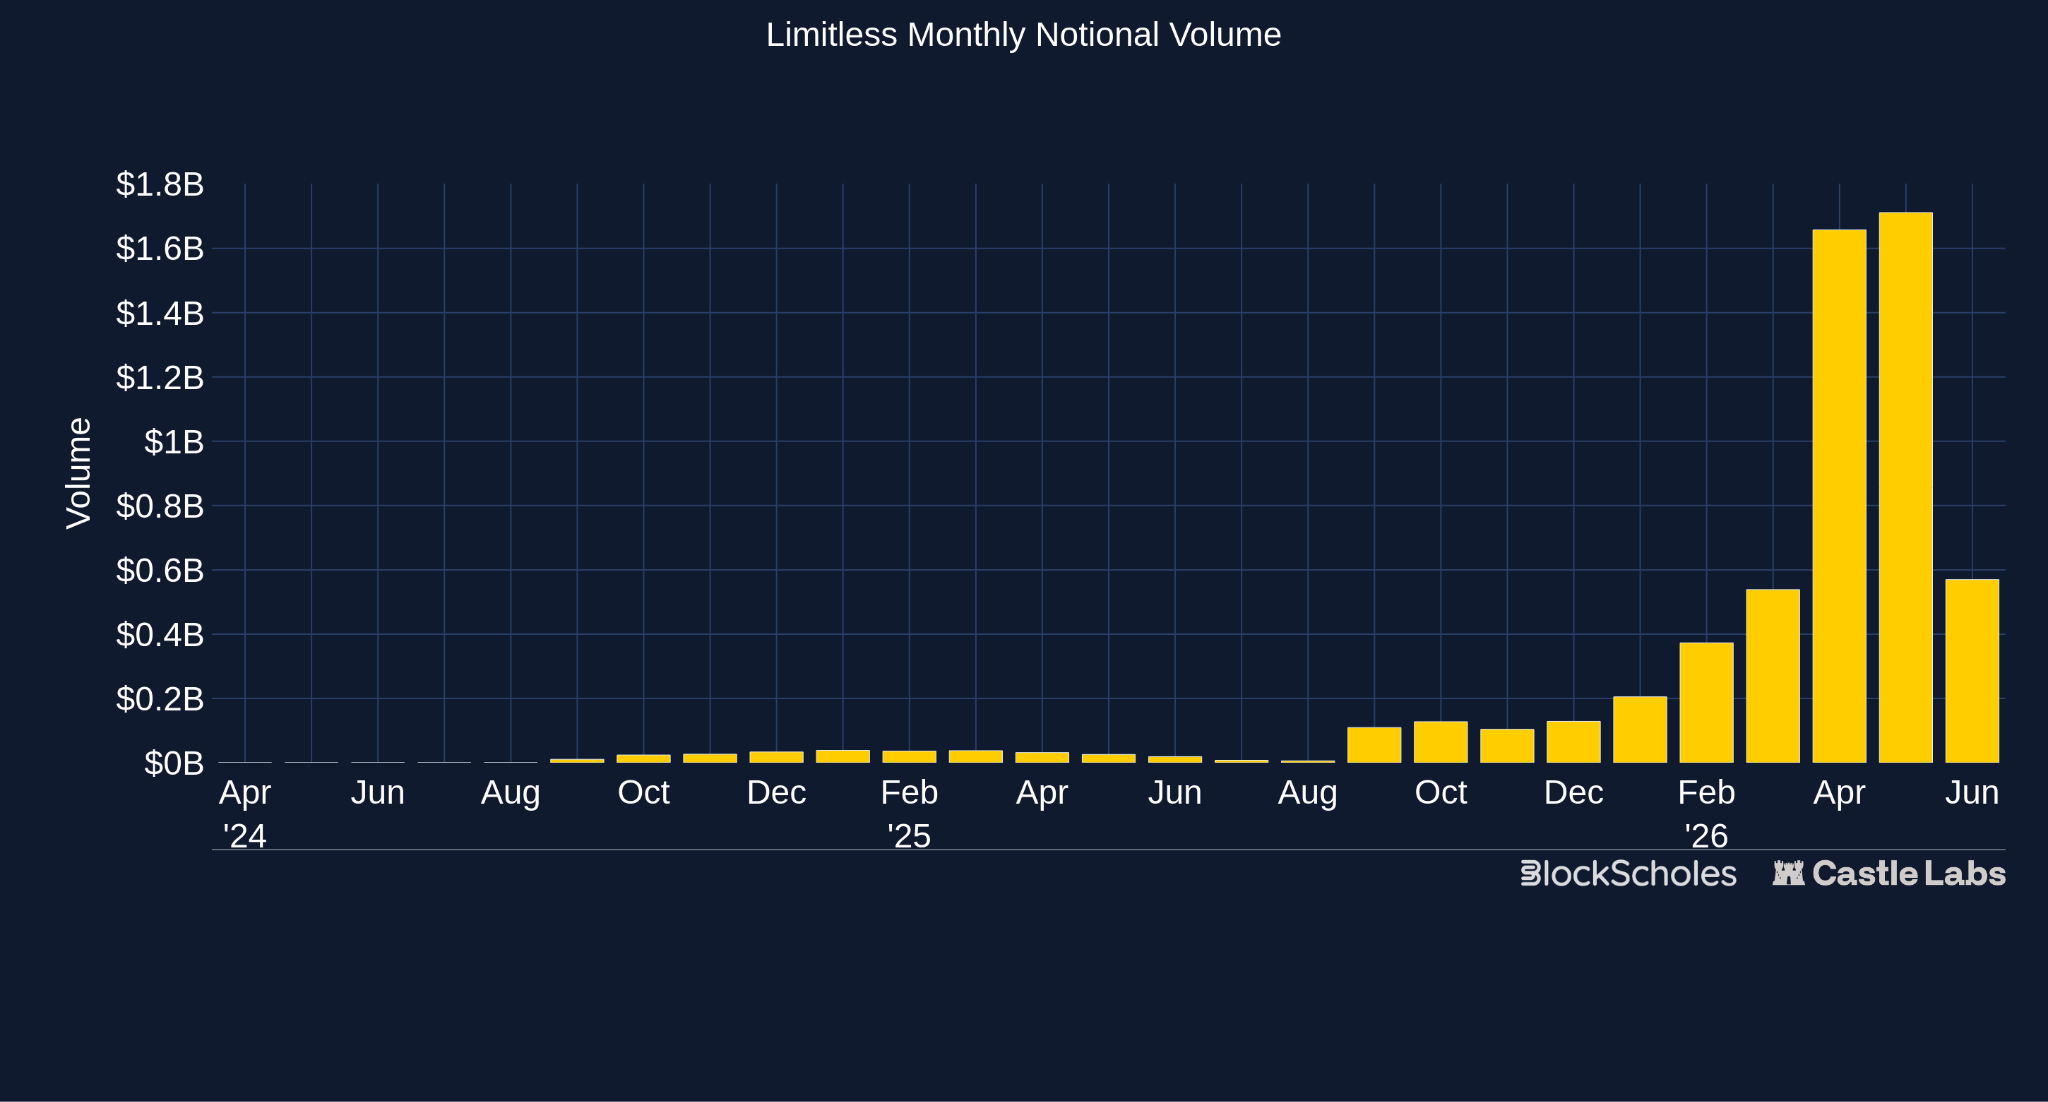
Figure 16 (CL) Limitless Monthly Notional Volume - @datadashboards
Predict.fun offers a unique twist on PMs, allowing users to earn lending yields while their positions are active. These yields come from their integration with Venus Protocol on the BNB chain; the collateral deposited to purchase the contracts is deployed in the lending protocol to earn base stablecoin yields (3-5%).
This feature is something only onchain prediction markets can enable. Suppose a user has an active hedged position on such a platform, and while they are hedging, they could also earn yield, which could effectively contribute to the overall position PnL.
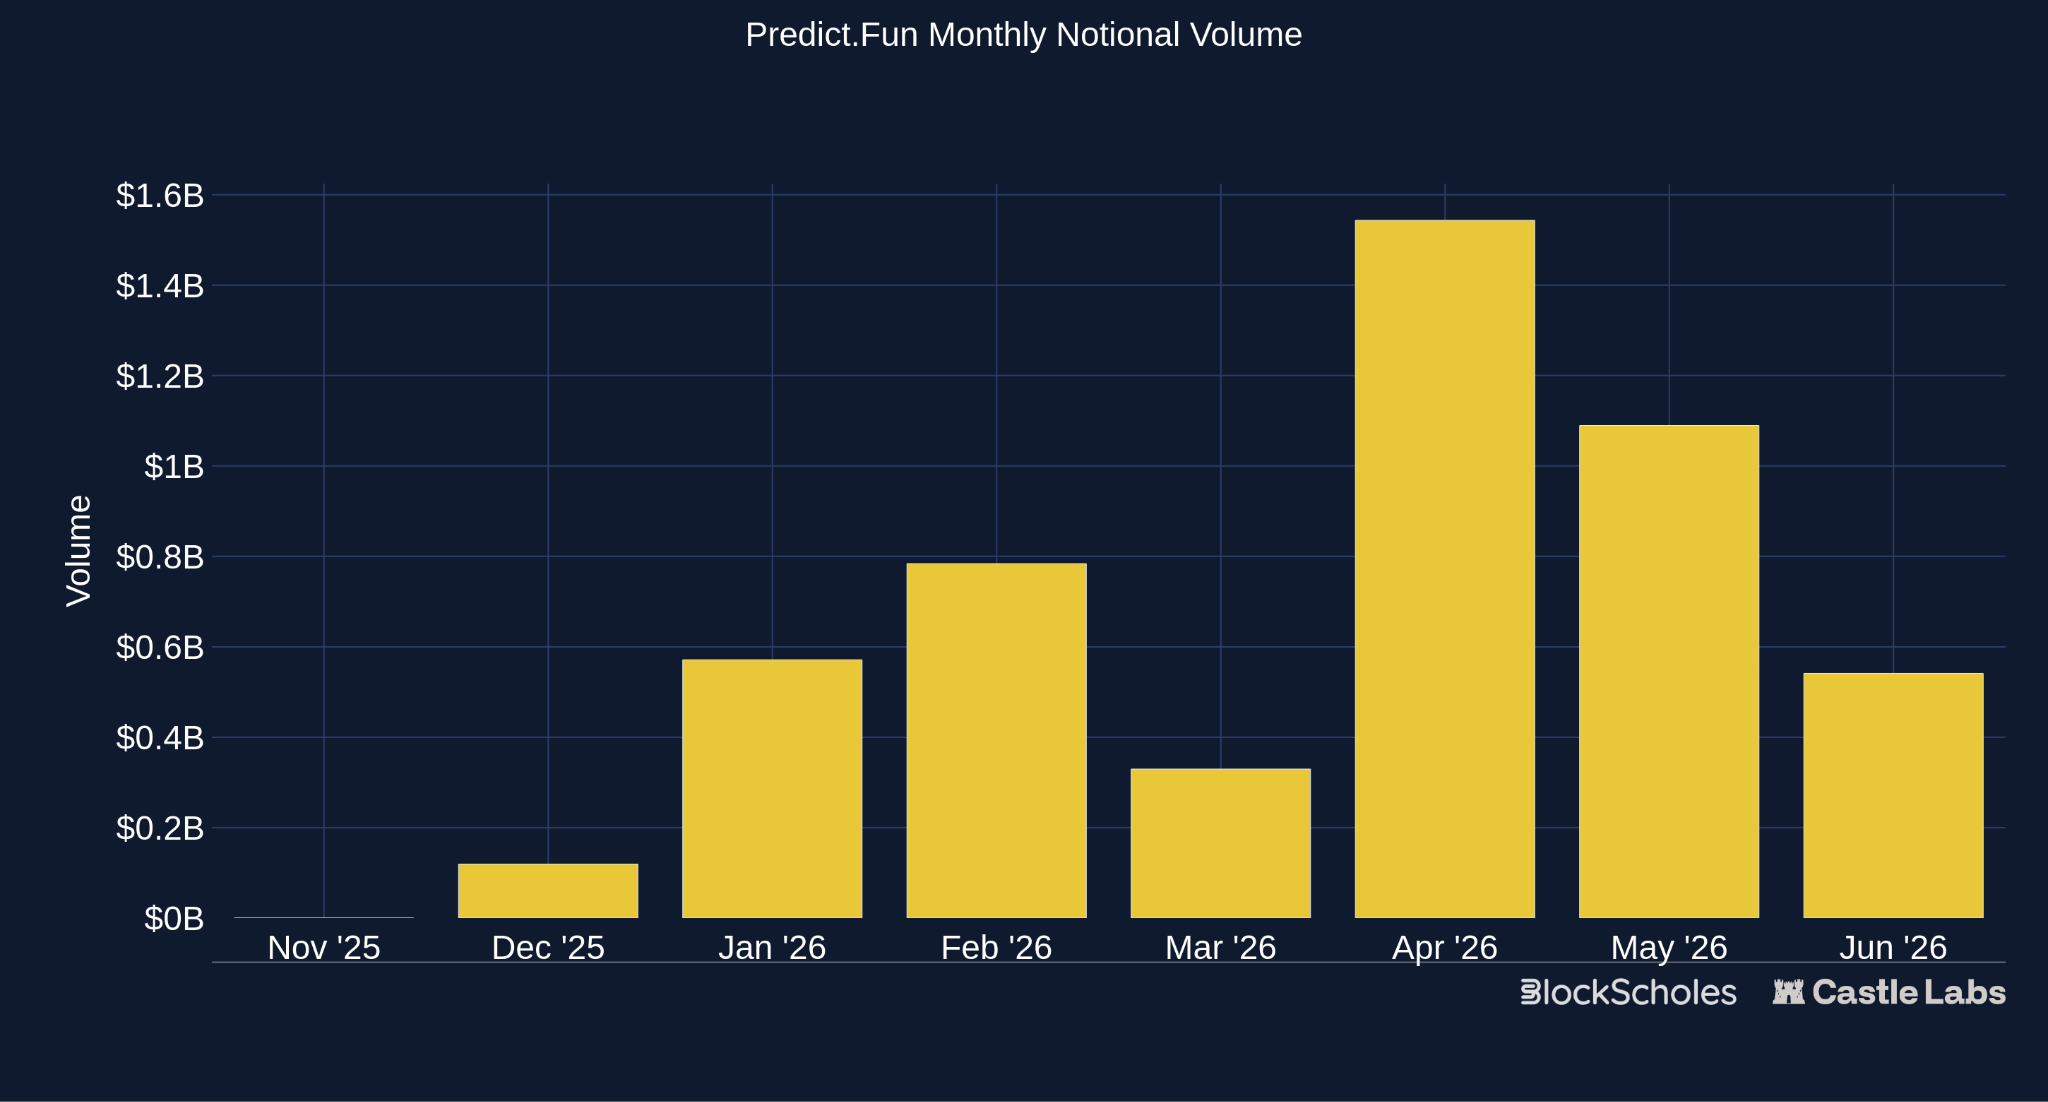
Figure 17 (CL) Predict.Fun Monthly Notional Volume - @datadashboards
Deepbook Predict is currently in whitelist mode and is developing on Sui. It is part of the expanding Deepbook Stack, which includes Spot and Margin products. Predict is where binary markets live, and because it is composable with other Deepbook products, a Predict position can be leveraged or used as collateral, making it a distinct offering from incumbents like Polymarket and Kalshi, whose positions have no additional utility.
Liquidity in these markets is sourced from LPs who deposit their assets in a shared vault, which is used to take the opposite side of traders. Depositors receive a PLP token receipt and earn interest from fees or from traders who lose bets. What sets Deepbook apart is its oracle infrastructure, as its binary outcome products reference Block Scholes, which prices binaries from a full implied-volatility (IV) surface.
PM, as a category, is consistently expanding, with newer products taking different approaches, such as offering UGMs, robust resolution infrastructure, and improved capital efficiency.
In the section that follows, we cover newer offerings that take a whole different approach to prediction markets by embedding them in their existing products.
HIP-4 went live in May 2026 and has amassed over $150 million in volume so far.
Hyperliquid’s offering is structurally different from others because it is already a well-established perpetual exchange doing billions in daily trading volume. Under the same margin account used on the perp exchange, users could access the binary outcomes offered through HIP-4, which has provided a good distribution flow from Day 1, making Hyperliquid a strong competitor to existing incumbents. Additionally, users gain exposure to options-style payoffs and hedges alongside their existing perpetual positions, enabling different strategies.
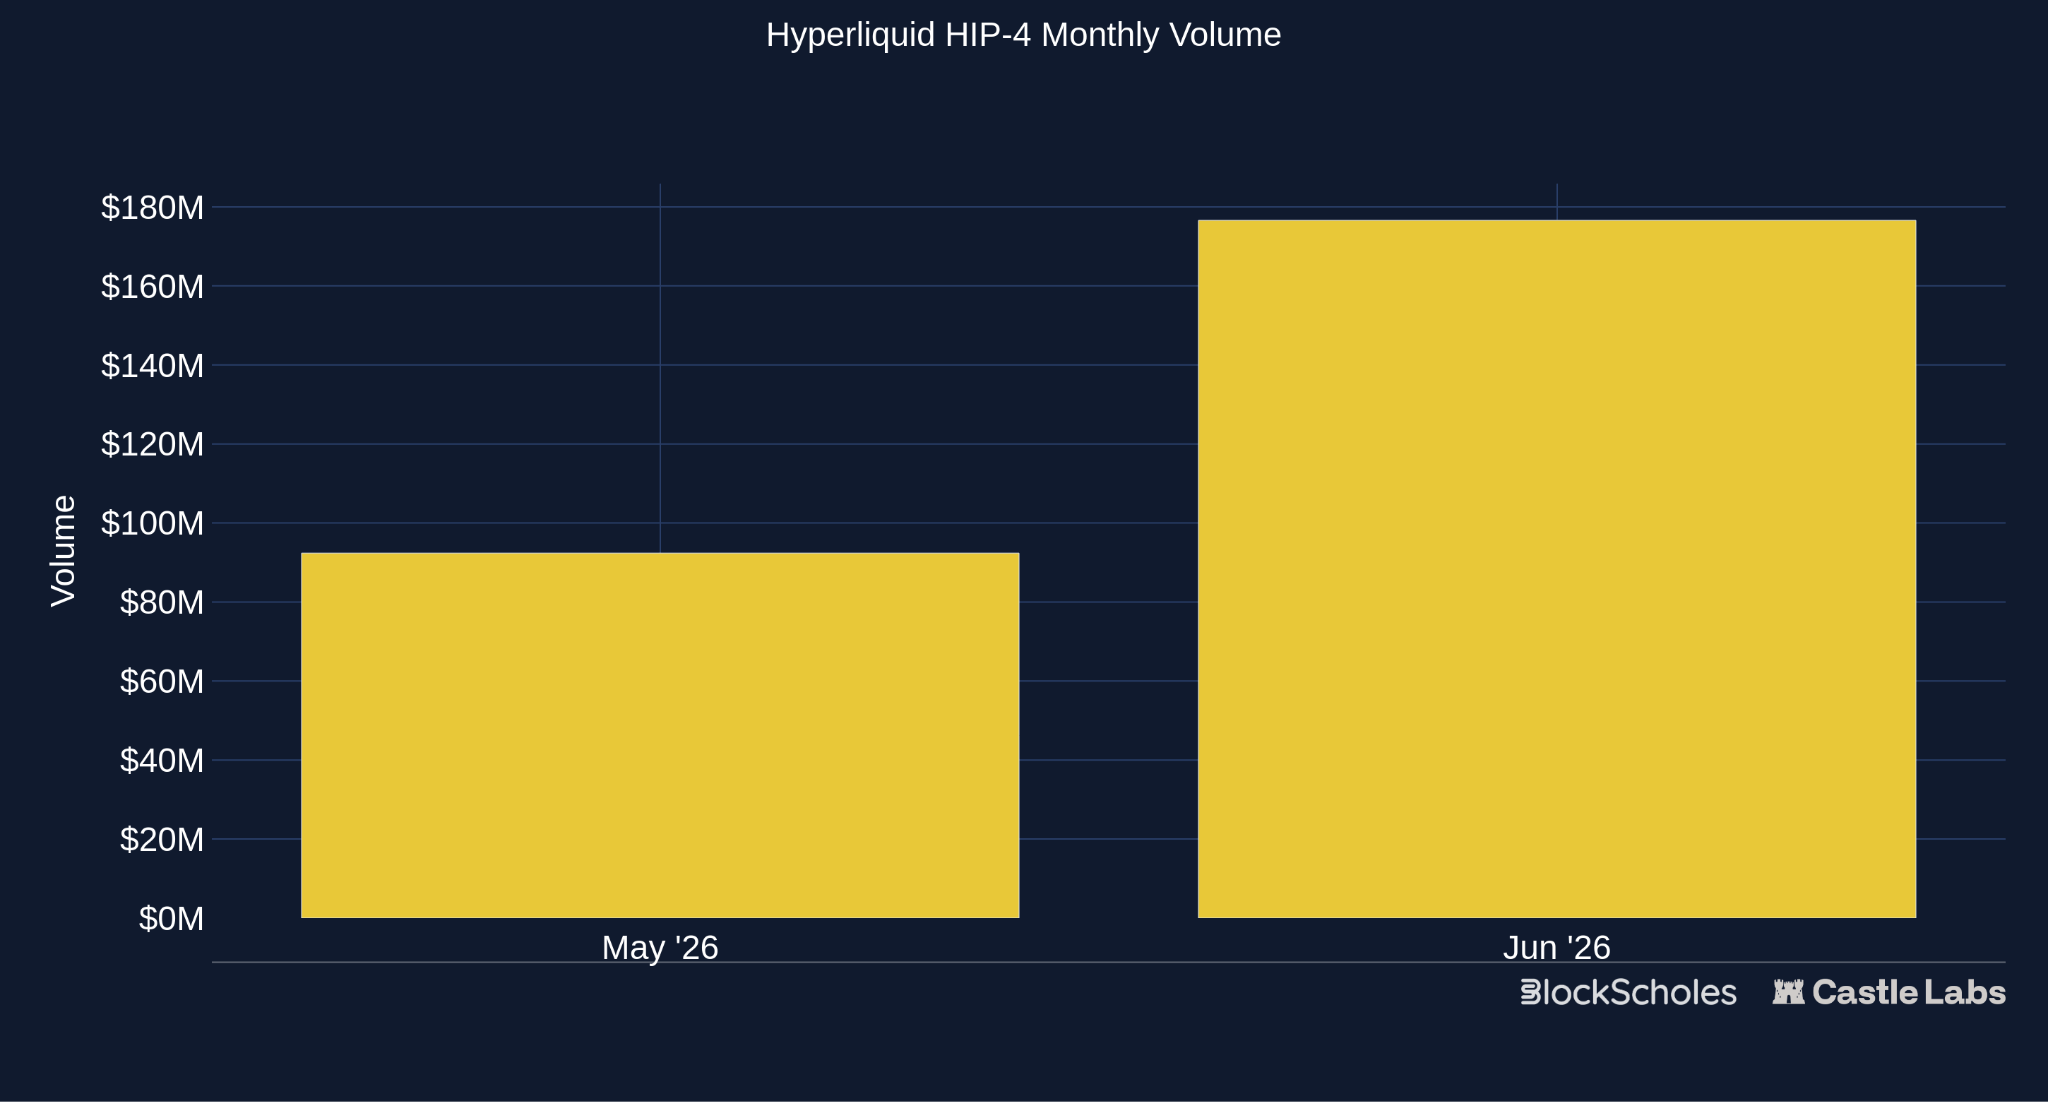
Figure 18 (CL) Hyperliquid HIP-4 Monthly Volume - @datadashboards
To launch these markets, deployers need to stake 1M HYPE (~$60 million), thereby providing a sufficient barrier to entry and maintaining market quality. Currently, markets are covering Crypto, Sports, and Economics.
Additionally, Hyperliquid is the cheaper venue for trading smaller-sized positions (due to less liquidity currently). It charges fees only at closing or settlement, not at opening; the fees are 7 bps for taker and 4 bps for maker.
In the next section, we compare binary options providers, evaluating their trading volume, spreads, and performance over the last 1 week to determine which platforms currently lead in the binary options market.
In this section, we compare the top providers for binary outcomes, including Kalshi, Polymarket, and Hyperliquid, based on the volume and spread of the BTC 1-day expiry markets they list, using data from the past 1 week (2026-06-22 to 2026-06-28).
The goal of this analysis is to quantify the quality of these different trading venues for binary-outcome markets, map the performance of a common offering (the BTC 1-day market), and assess how newer participants like Hyperliquid are catching up.
All these venues share a similar goal with this offering: a binary “above/below a fixed BTC price” market expiring in 24 hours, but they differ significantly in practice.
For BTC specifically, Hyperliquid lists exactly one 1-day binary market per day (its HIP-4 outcome markets also list many non-crypto markets mainly around economics and sports). Polymarket and Kalshi (KXBTCD) both list a ladder of multiple markets within these 1-day markets at different strike prices.
To perform this research, we mainly compare:
We source this data from multiple sources: for Hyperliquid, we use the 0xarchive API; for Polymarket and Kalshi, we use their public REST APIs (Polymarket’s Gamma/CLOB/Data APIs and Kalshi Trade API).
Within the observed window, Kalshi’s volume for the BTC 1-day binary market is the highest, averaging $4.24 million, compared to Polymarket at $2.76 million and Hyperliquid at $400k. This reflects only the BTC 1-day binary specifically; this ranking might vary across different categories.
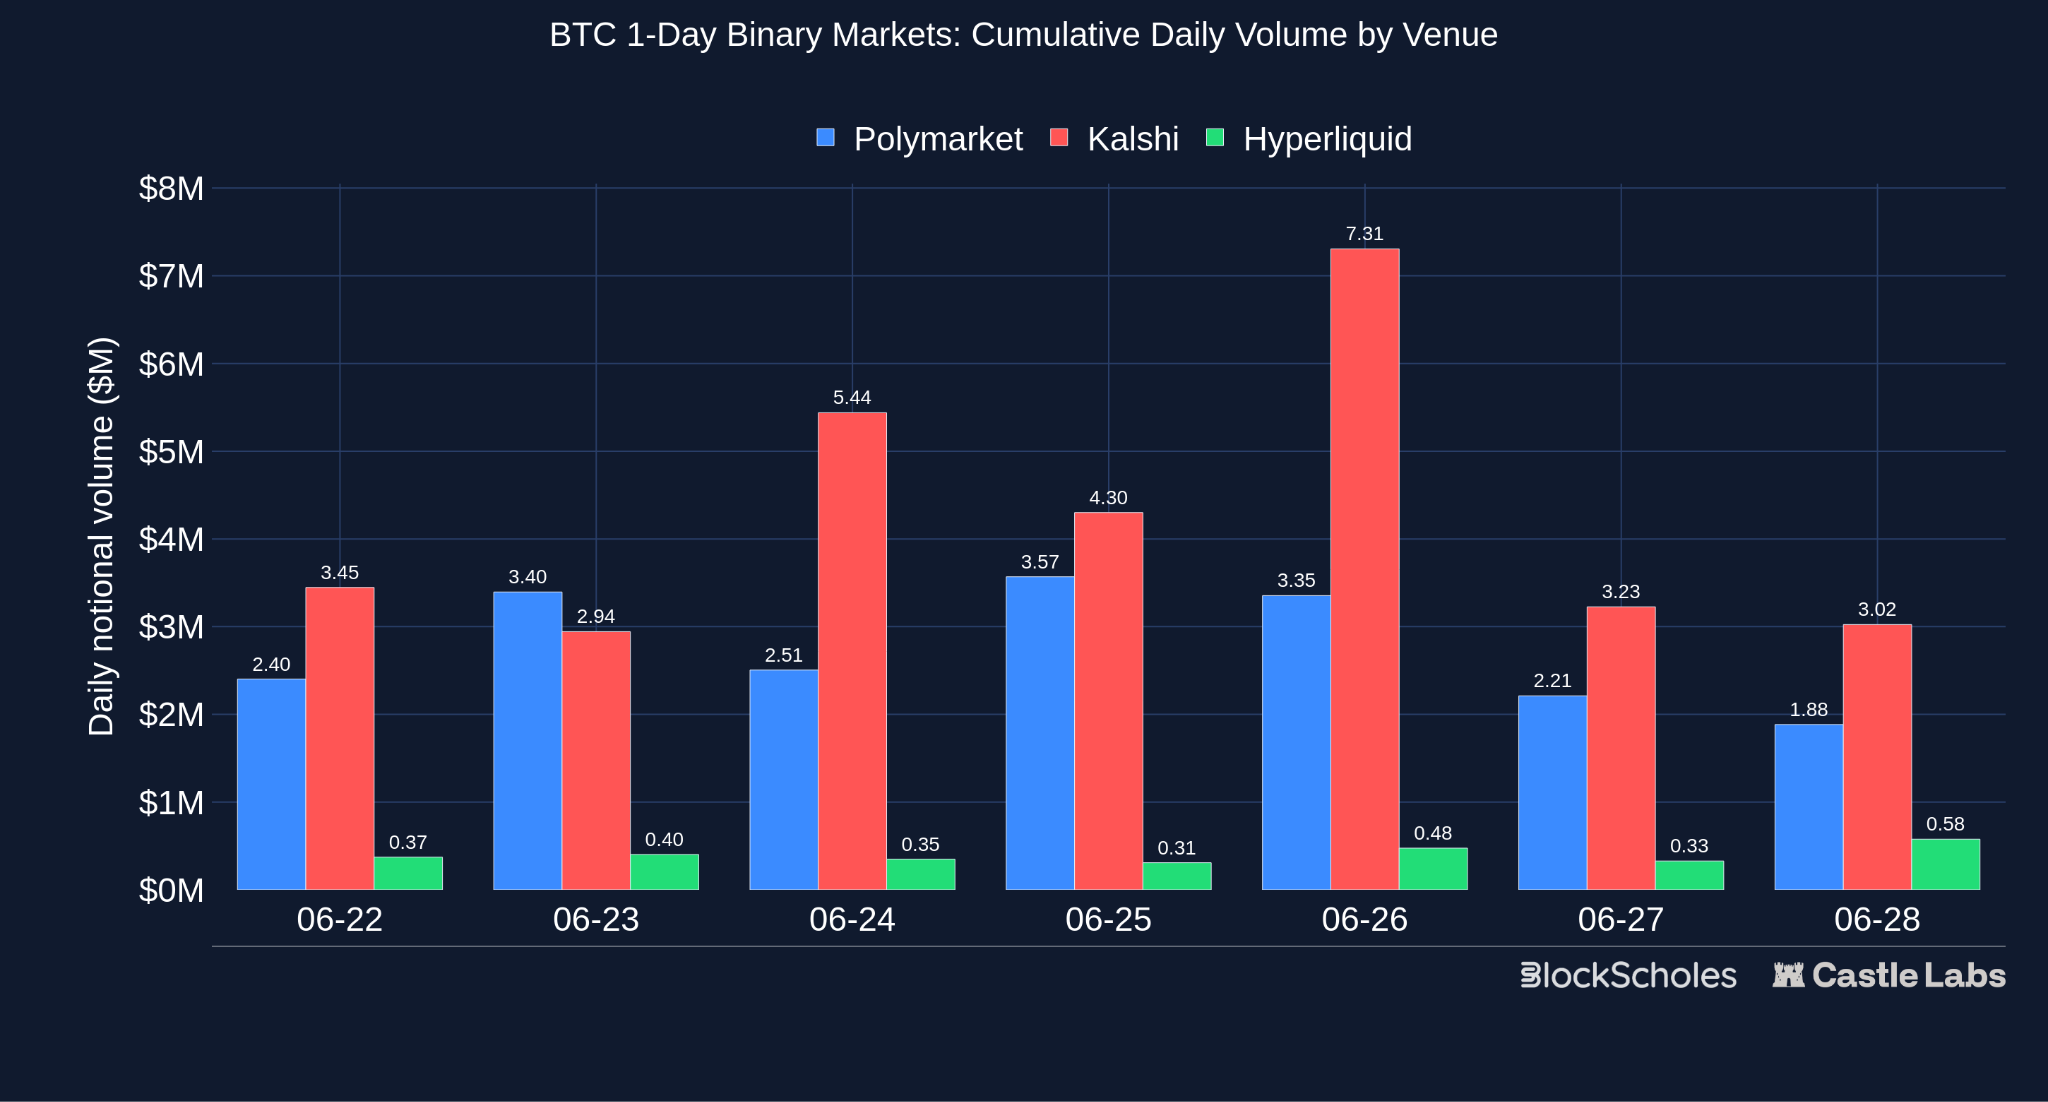
Figure 19 (CL) BTC 1-day Binary Market Volume
Spreads, on the other hand, have a different trajectory. Hyperliquid, the lowest-volume venue, also had the widest and most volatile quoted spread (50-587 bps, spiking near settlement on one day); Kalshi held a steadier 107-154 bps band despite having the highest volume. Polymarket’s reconstructed spread (5.8-19.8 bps) is the tightest of the three despite lower volume than Kalshi.
Note on Polymarket Spread: Polymarket’s spread is estimated from actual trades rather than read directly from a live order book, which can make it appear artificially tight. The reason: once BTC moves clearly above or below the strike, the outcome becomes near-certain, the YES or NO token converges toward $1 or $0, making the spread we reconstruct from trades at that point compress toward zero. In a one-day market, this phase often dominates in our data, making the median reconstructed spread for Polymarket 0 bps on almost every day, even if the mean isn’t. Additionally, there may be other reasons why Polymarket’s spreads appear tighter, including market-maker incentives or automated trading activity, but we haven’t examined these in this research.
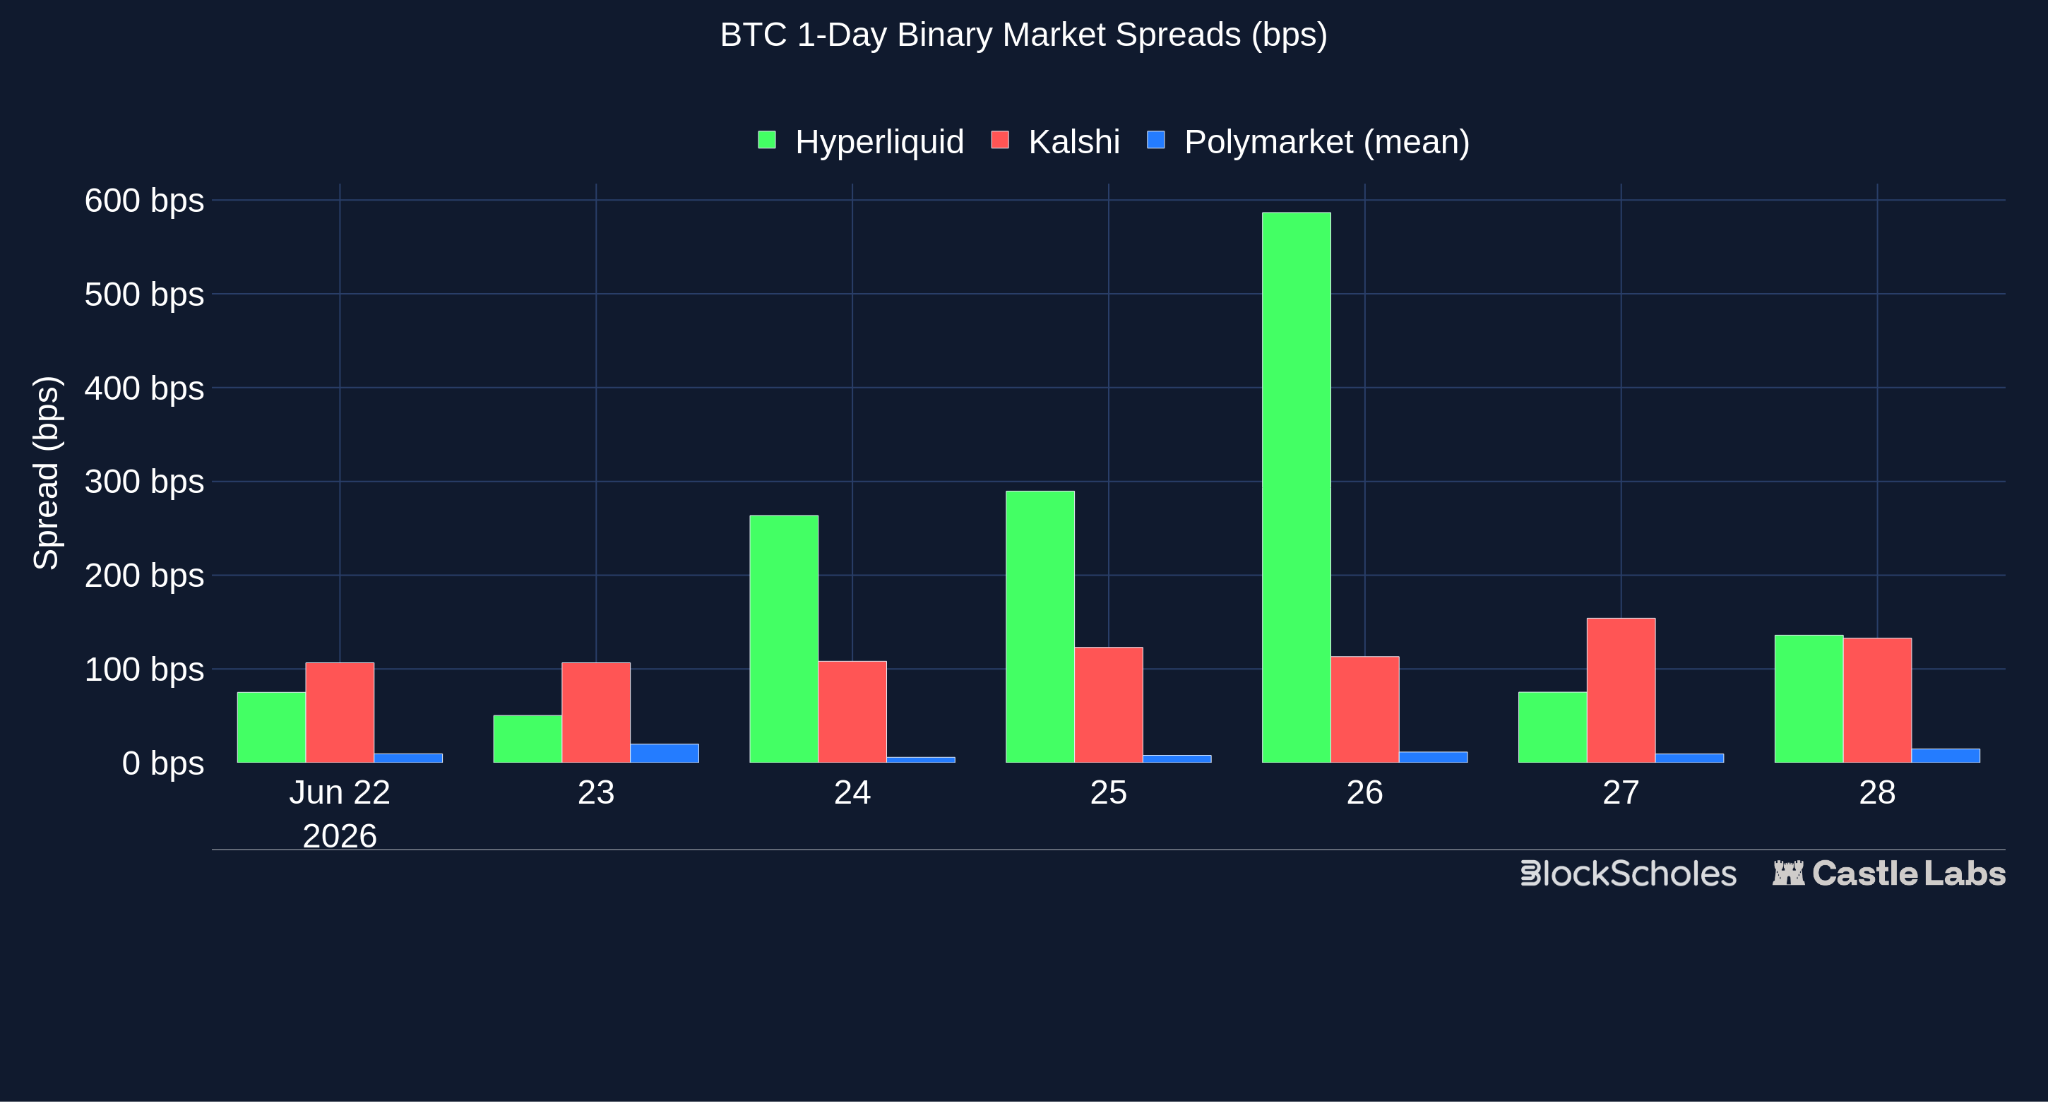
Figure 20 (CL) BTC 1-day Binary Market Spreads
Comparing protocol offerings by age makes the distinctions in volume and spread concrete, as Polymarket and Kalshi have offered binary markets longer than Hyperliquid; both platforms’ volume and spreads are generally better due to already-developed liquidity for this market type.
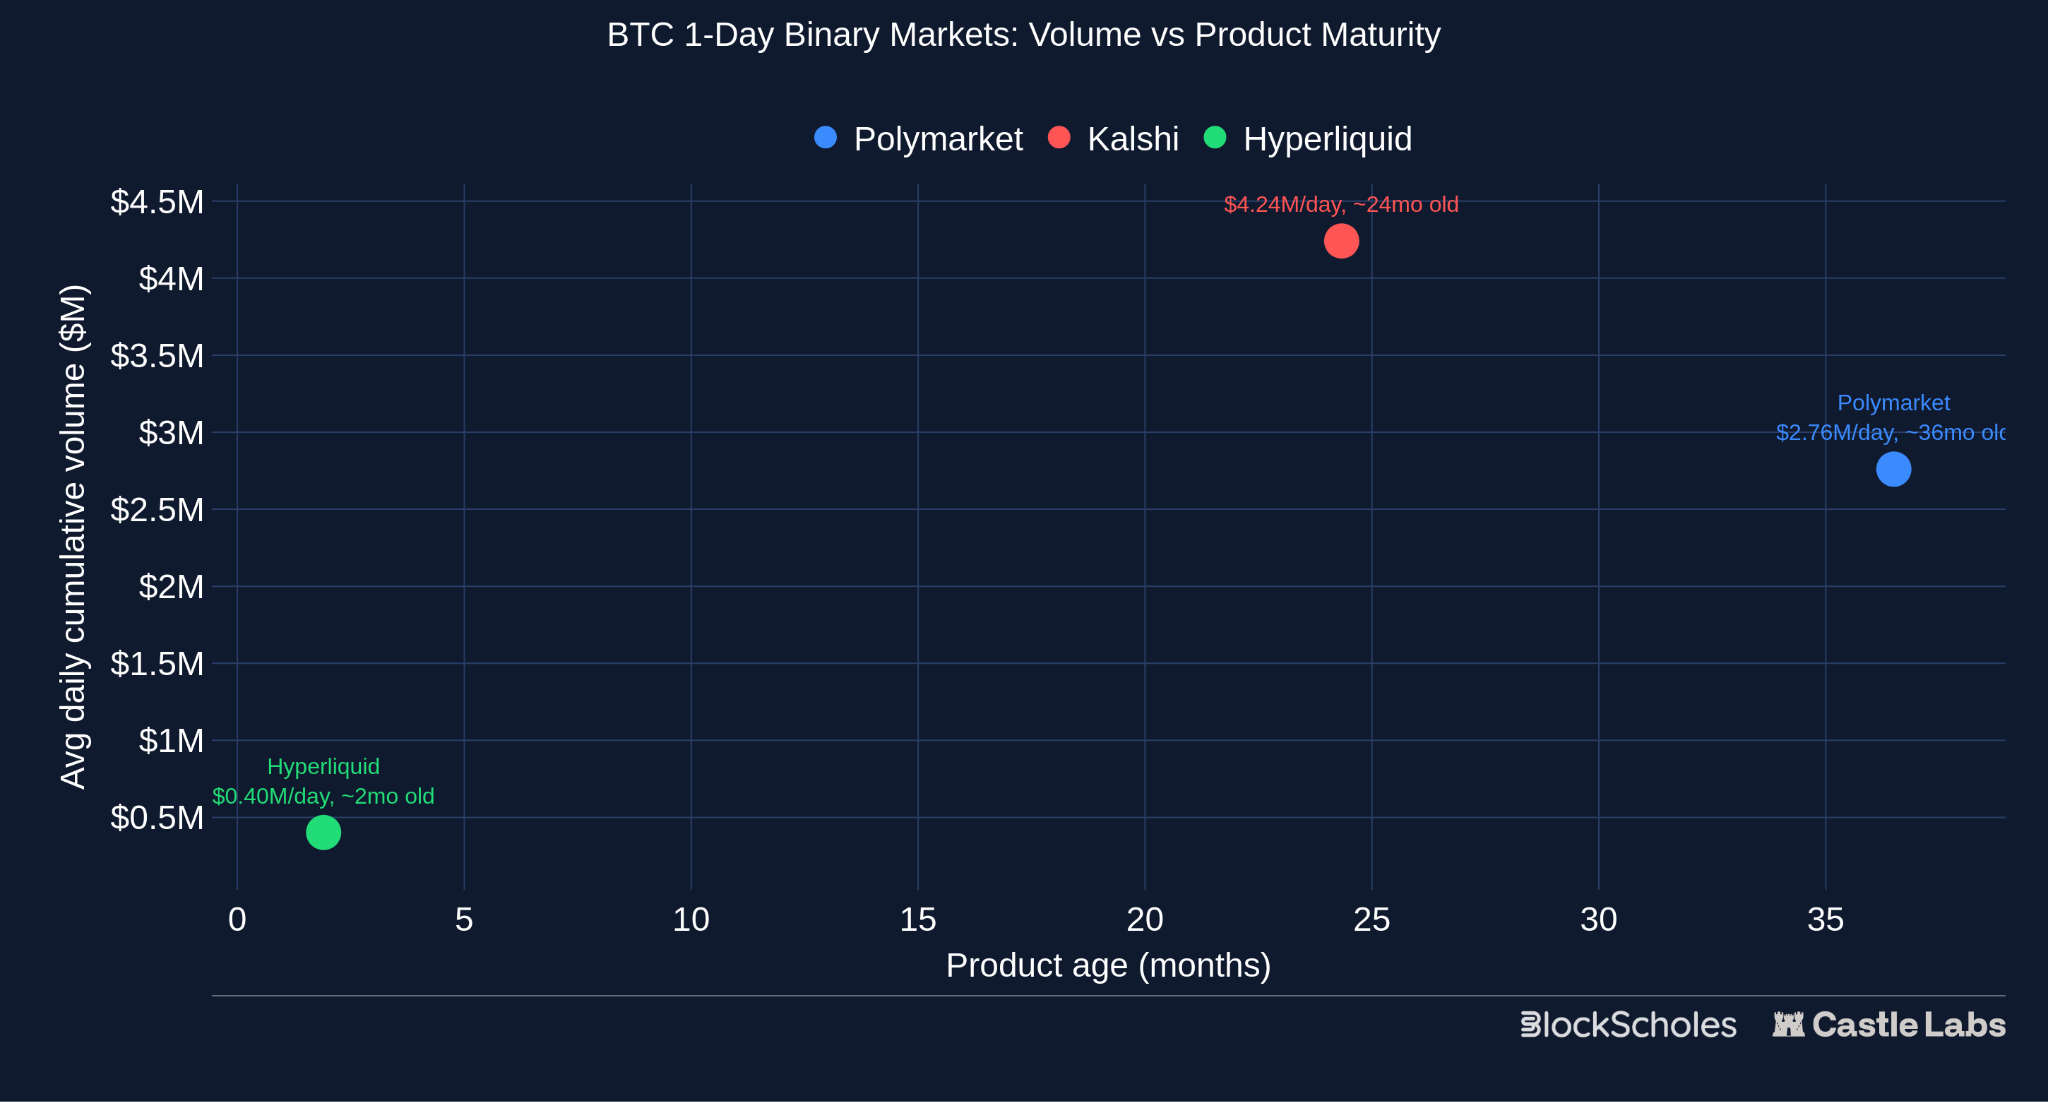
Figure 21 (CL) BTC 1-day Binary Markets Volume vs Product Maturity
Over the duration of the analysis, the 1-day BTC market has accounted for $29.6 million, $19.3 million, and $2.8 million in volume for Kalshi, Polymarket, and Hyperliquid, respectively.
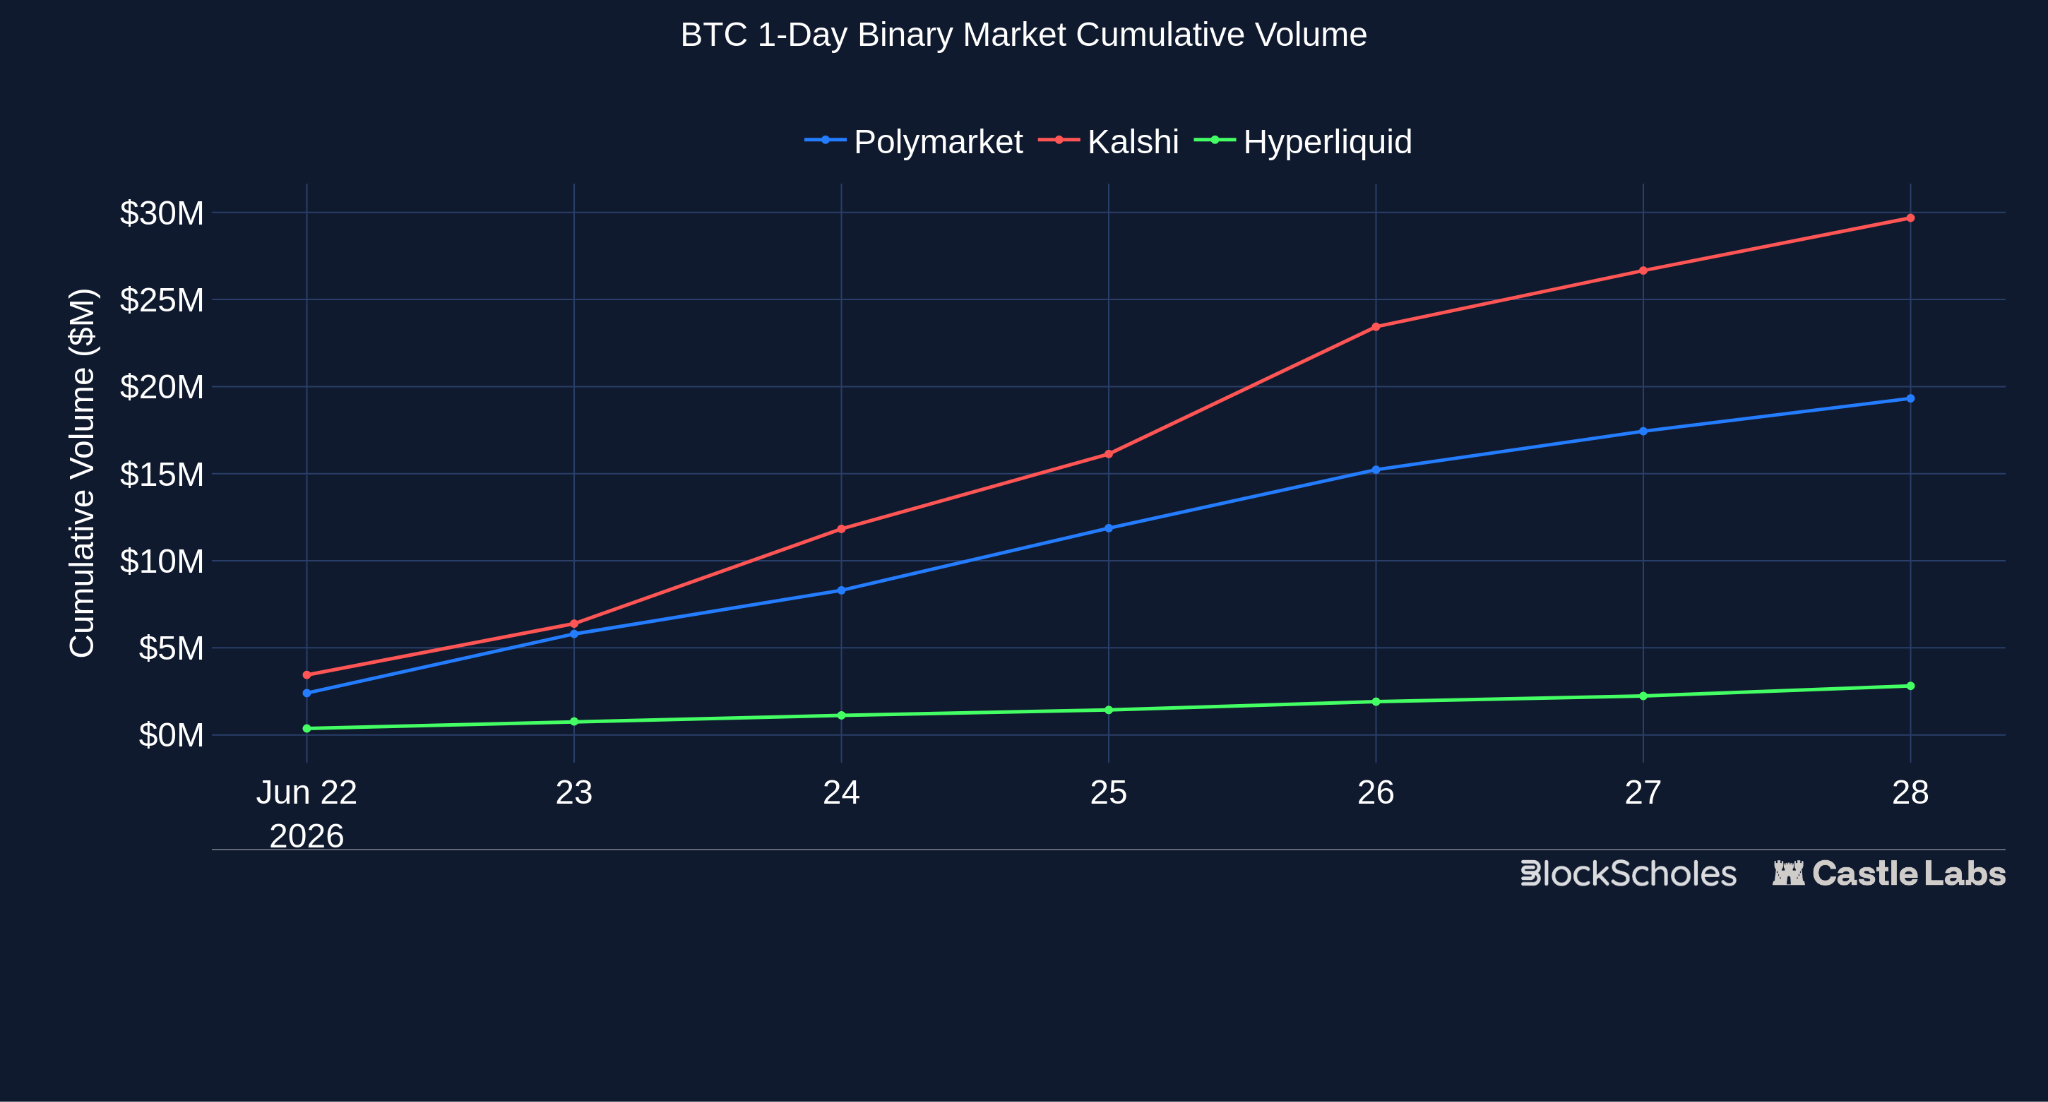
Figure 22 (CL) BTC 1-day Binary Market Cumulative Volume
A prediction market, or a binary outcome, is as good as its market-resolution mechanism. There are several different oracle mechanisms, but they can be broadly divided into three categories:
There are a few unique resolution models as well, such as the one used by XO Market, a permissionless prediction market. They have a three-layer resolution system. The first is the AI-first path through MODRA (Market Outcome and Dispute Resolution Agent), which uses AI to autonomously resolve clear-cut cases quickly. After that comes the Senate court and a Supreme Court appeal, which require human review. It has traded over $250 million so far, enabling 2800+ markets and 30,000+ trades.
Apart from this, protocols like Augur are also working on the resolution infrastructure as part of their updated roadmap under the Lituus Foundation. In their new resolution engine, participants commit their own capital in support of an outcome. Every time a dispute occurs, the commitments increase, making it progressively more expensive to sustain a dishonest position.
While there has been great work in this category, the top protocols still face challenges due to the oracles they utilise; only once they move to better oracles or improve the current ones could the category improve.
Additionally, in the context of the report, for automated crypto markets that correlate with binary options, providers like Chainlink and Pyth are used to minimise resolution risk.
PMs in the last 18 months have grown from a ~$2 billion/month category to a ~$30 billion/month category. The majority of this growth occurred after the 2024 U.S. elections, during which Polymarket posted more accurate odds than implied by traditional polling methods.
Polymarket’s crypto volume grew rapidly after it launched 15-minute and 5-minute markets, during the period from Q4 2025 to Q1 2026. These markets are similar to binary options, as traders could simply buy a “Yes” or “No” contract priced between $0.01 and $0.99 and would know exactly how much they would win if the market resolved in the direction of their position. These markets ultimately gave rise to multiple strategies that sought to exploit their inefficiencies, whether by exploiting latency arbitrage between price movements and oracle updates or by securing equal market shares at a discount, bringing the total value to $1.
Additionally, as they grew, Polymarket introduced fees on these markets and slowly rolled them out to other categories as well. Nonetheless, these markets proved to be a great short-term expiry instrument for traders who are highly invested in them, as volumes continue to rise.
This growth is also aligned with the increasing contribution in options volume from 0-day expiry options (0DTE) and short-dated options. For option buyers in this category, PMs’ crypto markets offer even shorter expirations than traditional venues, making them attractive.
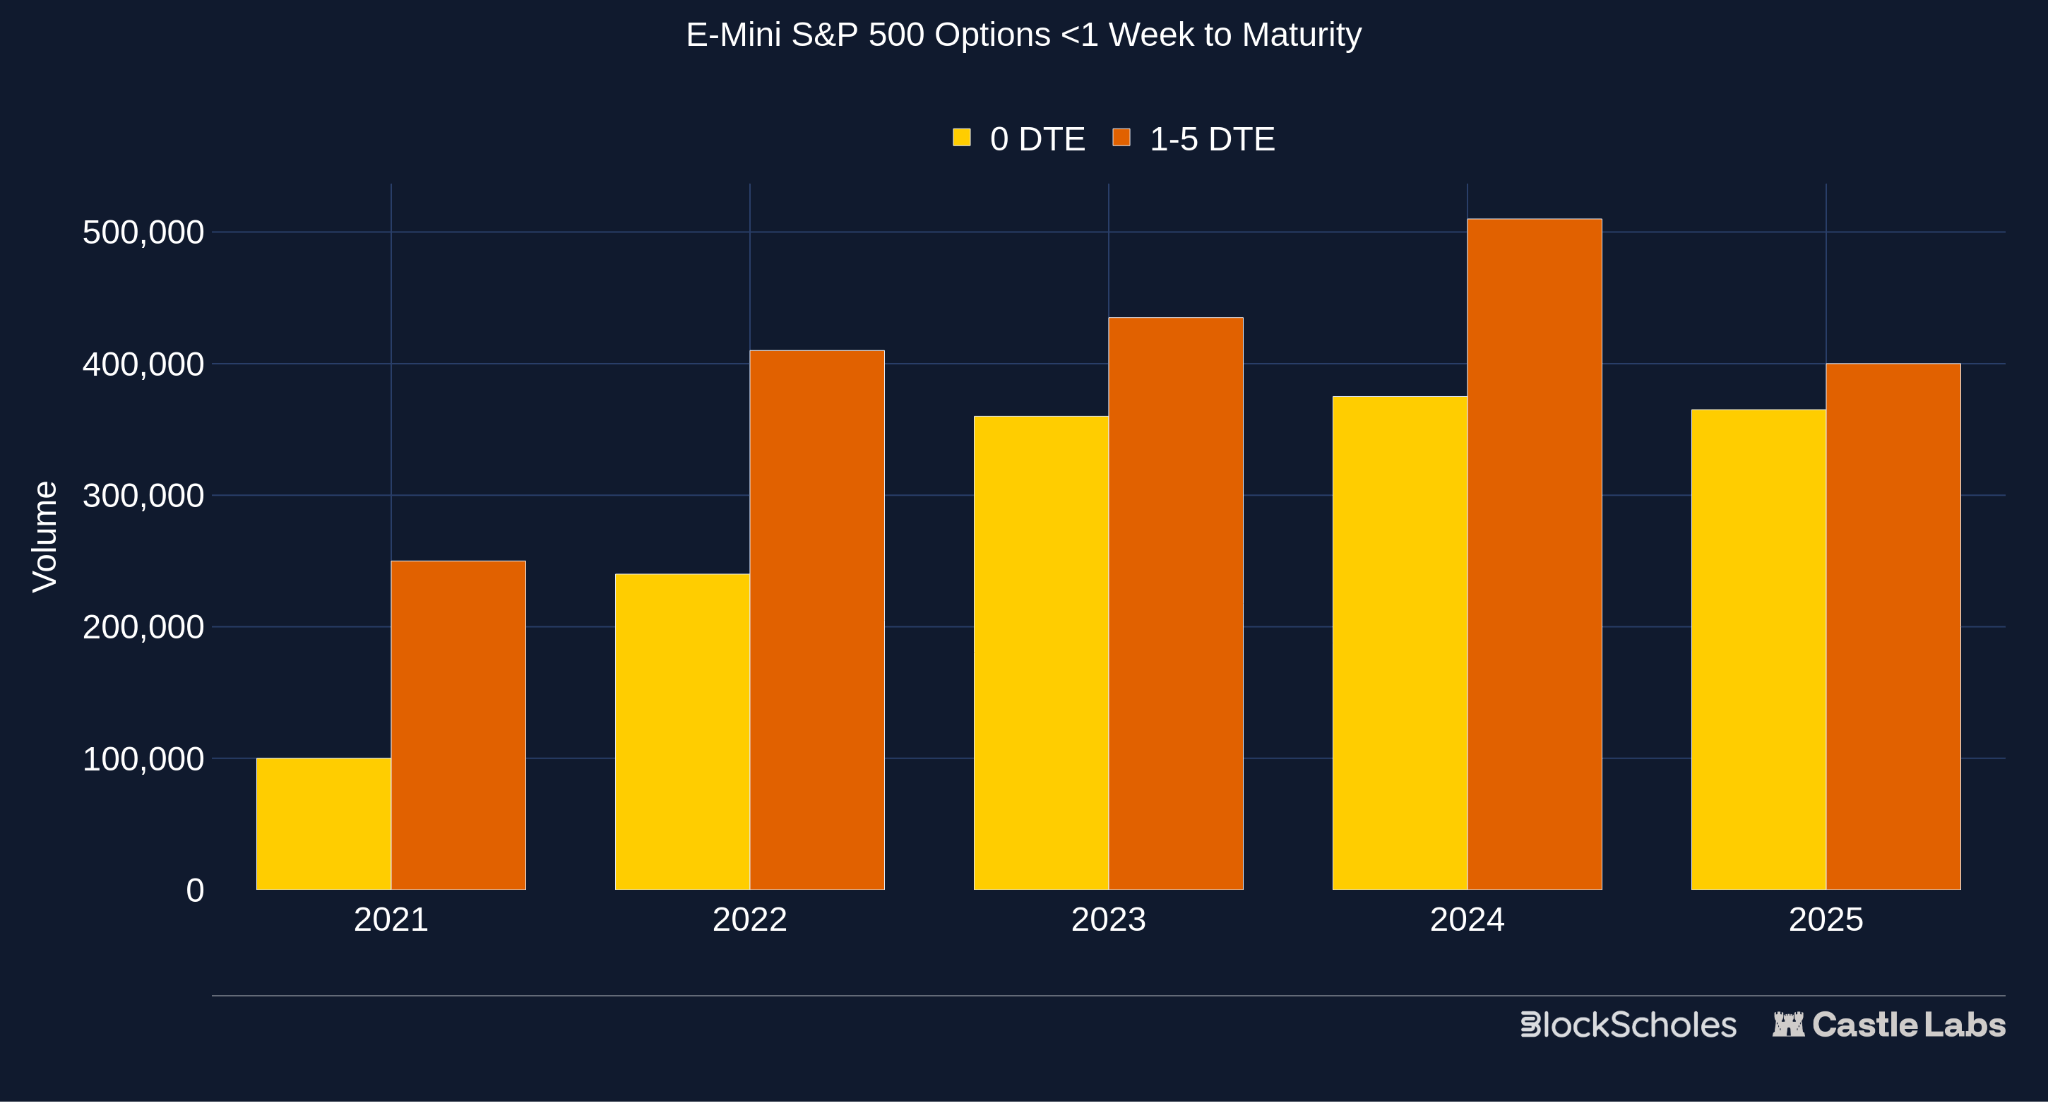
Figure 23 (CL) 0DTE vs 1-5 DTE options volume
Source: https://www.cmegroup.com/articles/2026/explore-the-benefits-of-short-dated-options.html
In terms of fees, PMs as a category generated over $300 million this month (i.e. June 2026), primarily led by Kalshi and Polymarket. For reference, this is almost double the fees of categories like Lending, making it attractive in terms of revenue as well.
PMs, as a category, have already moved towards mainstream adoption. With offerings like binary options on various crypto assets, they are also close to the traditional options market. As they grow, the gap between traditional venues and PMs is expected to close due to simpler design choices by these platforms and good UX.
We asked four teams building in this market why onchain options never saw the adoption curve of perps, what’s changed this cycle, where the real bottlenecks still sit, who’s actually using these products, and what would count as genuine traction:
Each team approaches the market from different angles with their product: Rysk packages options into income products; Panoptic builds oracle-free perpetual options from AMM liquidity; GammaSwap is moving from AMM-native volatility into binary markets; and Derive runs a professional options exchange on its own L2. Their diagnoses, on the other hand, were nearly identical.
Dan got straight into the main gaps for options, saying onchain options spent years “copying the perp model,” which was a fatal mistake. Perps combine an entire market’s demand into a single book, while an options exchange splits it across a range of strikes and expiries, fragmenting liquidity into separate, thin markets.
Guillaume at Panoptic highlighted the market maker side. They “have to update hundreds of quotes after every price move, which is quite difficult to do on a blockchain,” he says, and the fragmentation causes traders to get trapped in their trades because the liquidity for deep in-the-money or out-of-the-money positions to exit is not there. Sean at Derive says the gap between options and perps boiled down to the fact that greeks, options boards and “nonlinearity is often overwhelming and turns people off options.”
When it comes to highlighting the key change that has resulted in a revival of onchain options, they all agree it’s yield. Through 2023 and 2024, the appeal of strategies that sold volatility was limited, as other strategies, such as the basis trade and double-digit yields on stablecoins, paid out with greater simplicity. Guillaume reckons it’s “quite difficult to achieve >5% yield nowadays without resorting to looping strategies,” with Sean framing volatility as “the last product left that is unfarmed,” suggesting the category still had a lot left in the tank after only recently being ‘discovered’ by onchain users.
Crypto is a volatile industry, and is likely to stay that way, so selling that volatility is a source of yield that will continue and has yet to become saturated onchain.
Where they diverge in their thinking is on what has been missing to enable onchain options to gain more traction, which explains why each has built a vastly different product.
For Rysk and GammaSwap, the gap is closest to the user. For Dan, specifically, it’s trust. People got burned by products they didn’t understand in the past, and we shouldn’t keep trying to hide the mechanics; instead, we should focus on making outcomes transparent before a user commits. In particular, this concerns the premium shown in the protocol and the final execution by the RFQ system. “Options are not the product.” People don’t want an option; they want what the option does for them. Devin, at GammaSwap, agrees: “Complexity is the enemy. Simplicity trumps everything.” The rest will follow: “If the UX is strong and you have retail flow, market makers will inevitably come in.”
Guillaume sees the problem lower in the stack; rather than focusing on the interface or user education, he believes onchain options lack real demand and a greater range of collateral. The institutions he is targeting are not chasing 100x leverage. They need “a mature risk management layer” and “portfolio-wide margin,” in which deposits, assets, and options positions can be netted against each other rather than fully collateralised in isolation. That is also why he is focused on tokenised assets. If stocks, funds and RWAs move onchain, they will need hedging markets where those assets are issued.
Sean sits closer to the exchange view: liquidity has historically been the biggest blocker, because strikes and tenors fragment markets and widen spreads. Some of that has improved, especially as Derive found demand around HYPE options, but education remains a major gap. “Reading an options board for a newbie is impossible,” he says.
So, as expected, there isn’t a single gap, and each one’s perspective is shaped by their own experiences building, but we do keep coming back to the same core themes: UX, demand, collateral, and education.
Each product has a separate core group of users. Rysk’s are holders earning income on what they already own, from individuals to treasuries, DAOs, and institutions. Panoptic has advanced users and market makers for now, but aims to widen that through its vaults. GammaSwap has historically been for sophisticated retail investors, but it wants to expand beyond crypto by offering non-crypto-correlated assets and a simpler interface. Derive was built for professionals but recently rose to prominence due to retail demand for HYPE options.
They also define success differently. Dan wants to see volatility yield widely referenced and quoted on terminals, alongside lending and staking. Guillaume wants funds and treasuries to use options to manage risk rather than retail chasing pure speculation. Sean wants onchain volume to increase to a level comparable to CEXs, the way Hyperliquid now stands next to Binance. Devin thinks options have already found PMF onchain through prediction markets, but nobody noticed, as they are binary options in all but name. He now wants to see substantial growth in fees across the sector.
The demand for options is growing. Traditional markets show this across both retail and institutional channels, while recent onchain traction suggests the same demand can emerge when the right strategy is paired with the right asset and presented to the right user, with HYPE options being a prime example of this
The first iterations of option protocols focused on education, teaching users the value of options. In the current forms, protocols are instead focusing on simplifying options and framing them in terms of their utility and what they can do, ideally reaching the point where users don’t even know they are using options in the back end, while fully understanding each outcome.
Everything to this point has been a map. We have shown where onchain options and prediction-market activity sits, how each venue packages volatility into income, protection, leverage or a short-dated bet, and where the people building these products think the gaps still are. We also broke down how options and prediction markets are the same instrument in different clothing.
The harder question remains: what are these markets pricing underneath? Where is demand concentrated? Are traders paying more for upside or downside? How expensive is protection? Which expiries carry the most risk premium? Volume data alone cannot answer that.
This is where a volatility surface comes in. It shows how implied volatility changes across strikes and expiries, where demand is concentrated, how expensive protection is, and what kind of risk the market is rewarding.
The product map shows how different products are packaging volatility, but the volatility surface itself can tell us what the market actually believes. The following section, from Block Scholes, turns to the surface itself: a look at volatility for 2026 so far, what BTC and ETH volatility is pricing today, and what that says about the months ahead.
2.1 The state of volatility — BTC & ETH
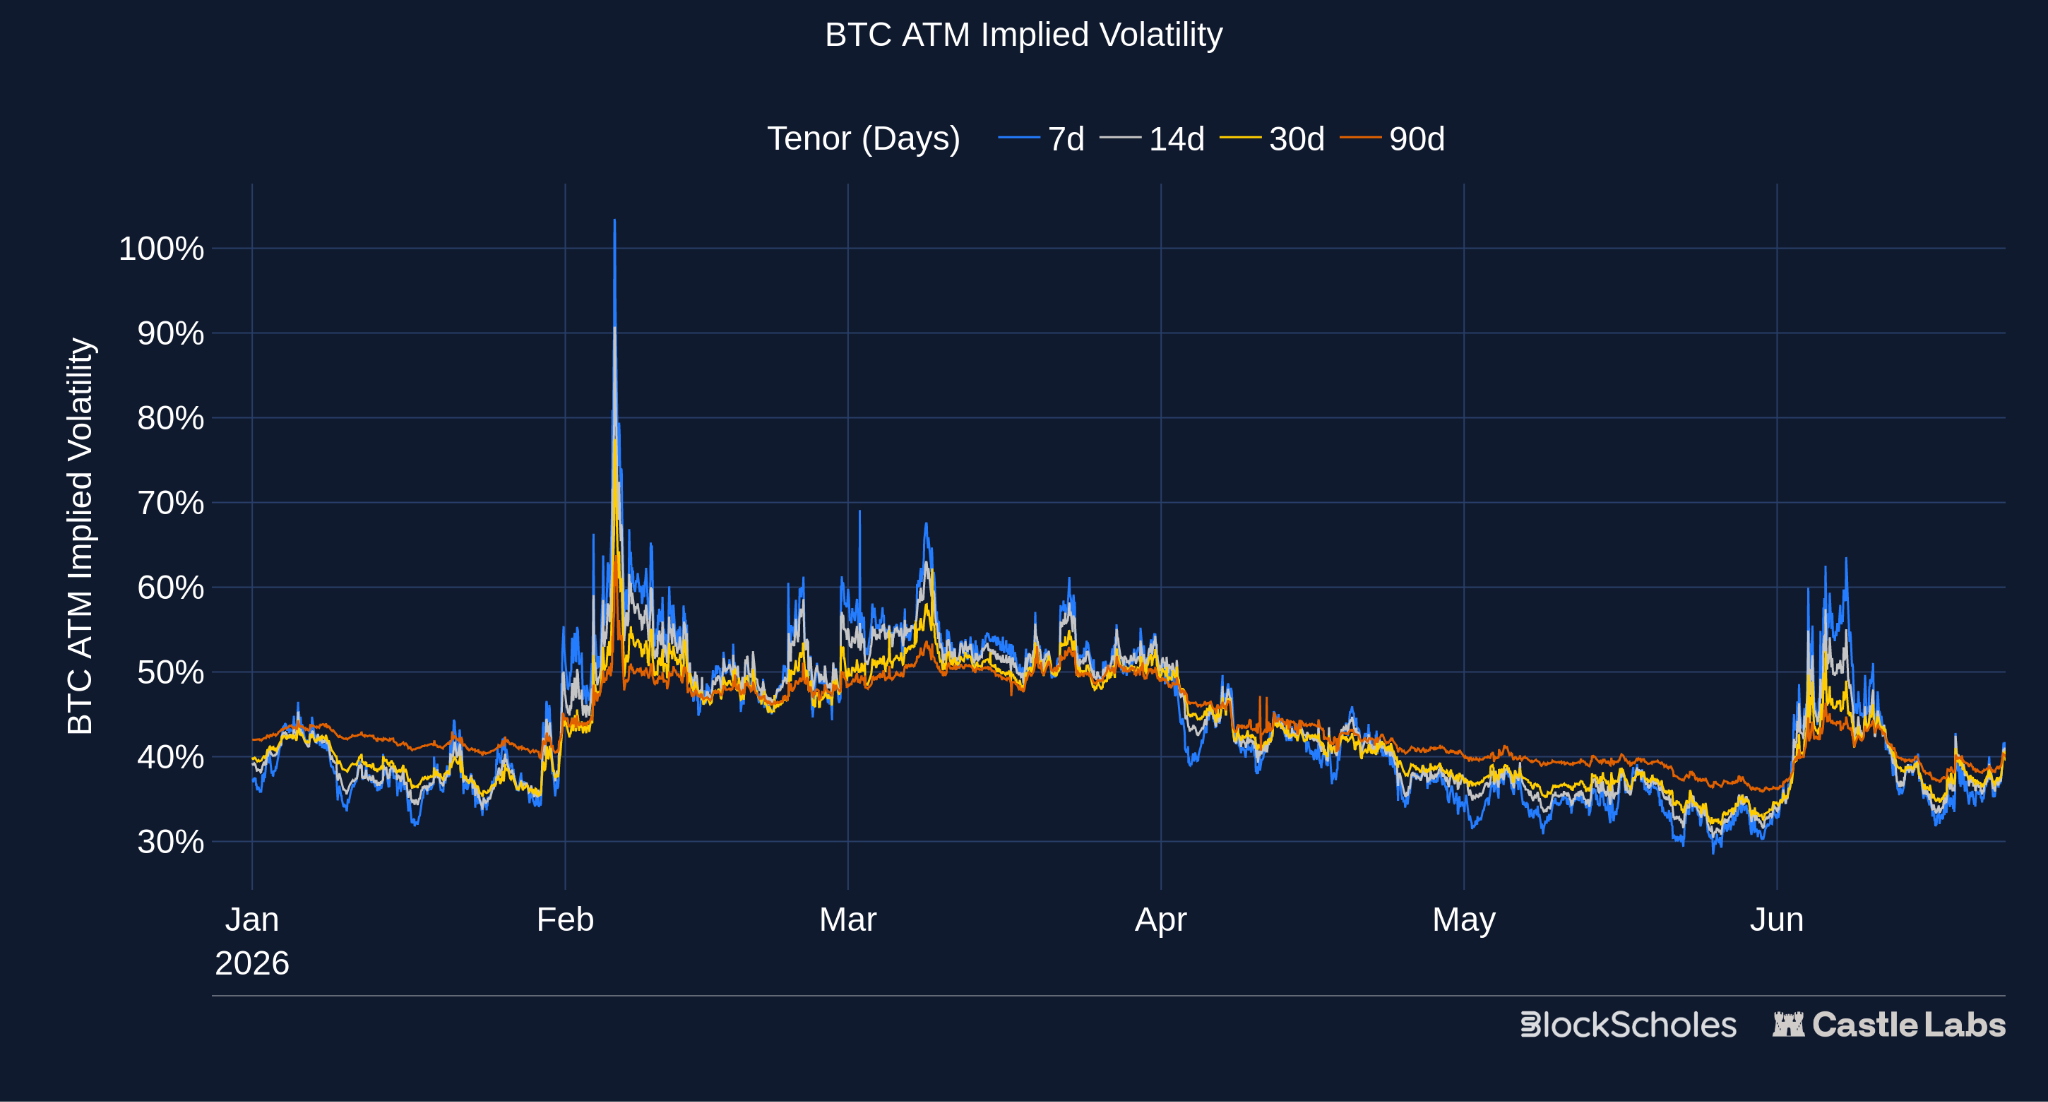
The price of an option reflects the volatility traders expect the underlying spot price to exhibit until the option’s expiration. An implied volatility of 50% for a 7-day BTC option means the market expects BTC’s spot price to move with an annualised volatility of 50% over the life of the option (or, scaled to the 7-day horizon, a one-standard-deviation move of ±6.9%).
We can extend this beyond just a single tenor option. The term structure of implied volatility shows the level of volatility traders expect to be realised over different time horizons, e.g., 7, 30, and 90 days from now.
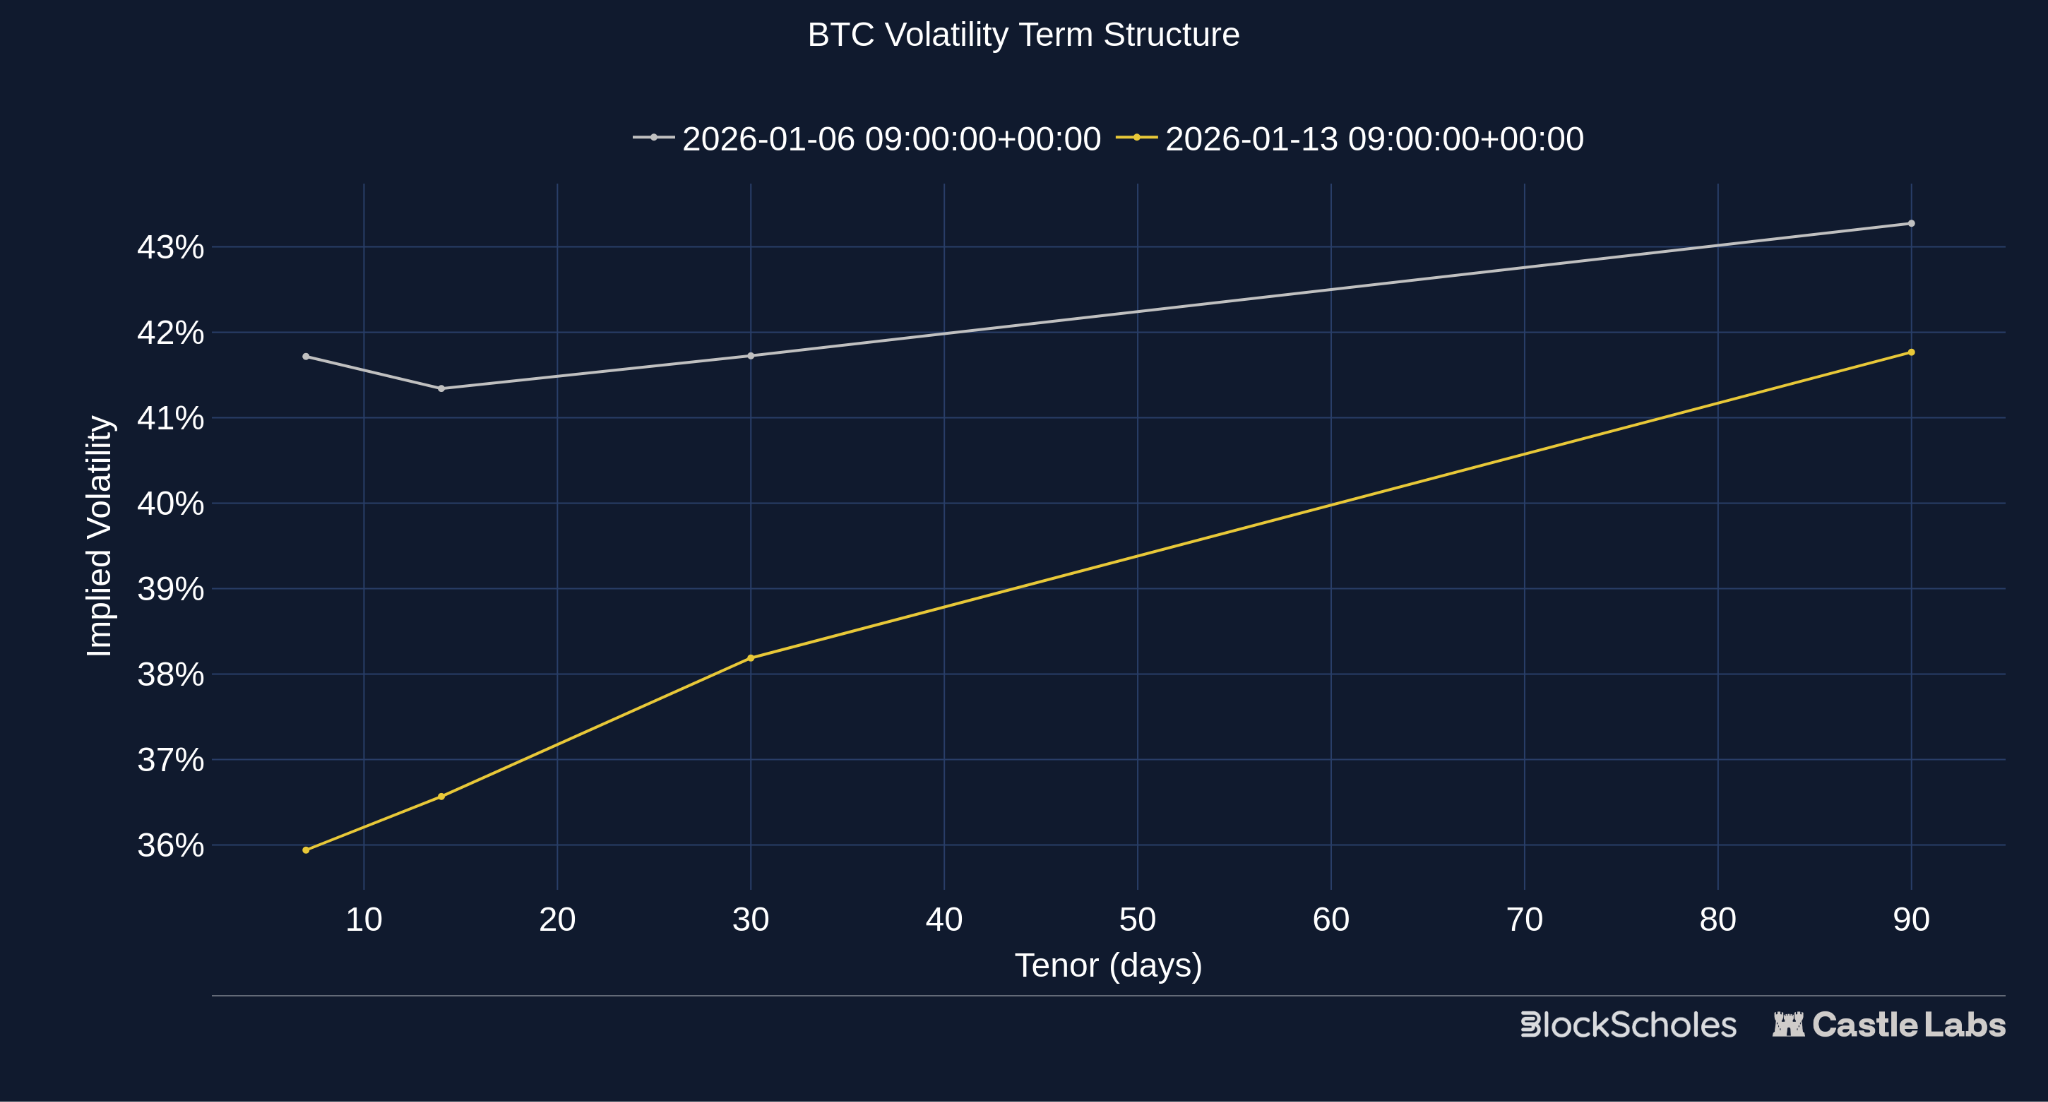
The typical term structure shape exhibits an upward, positive slope (see the dark yellow line above): short-dated options trade at a lower implied volatility than longer-dated options. This shape is in part driven by the fact that volatility traders’ near-term expectations are often influenced by volatility delivered in the recent past. On the other hand, volatility expectations over a more distant horizon are less certain, leading traders to demand a higher volatility premium above the most recently observed level.
However, in early June, short-dated implied volatility in BTC options jumped above that of longer-dated options, resulting in an “inverted” term structure of implied volatility (see the dark yellow line below).
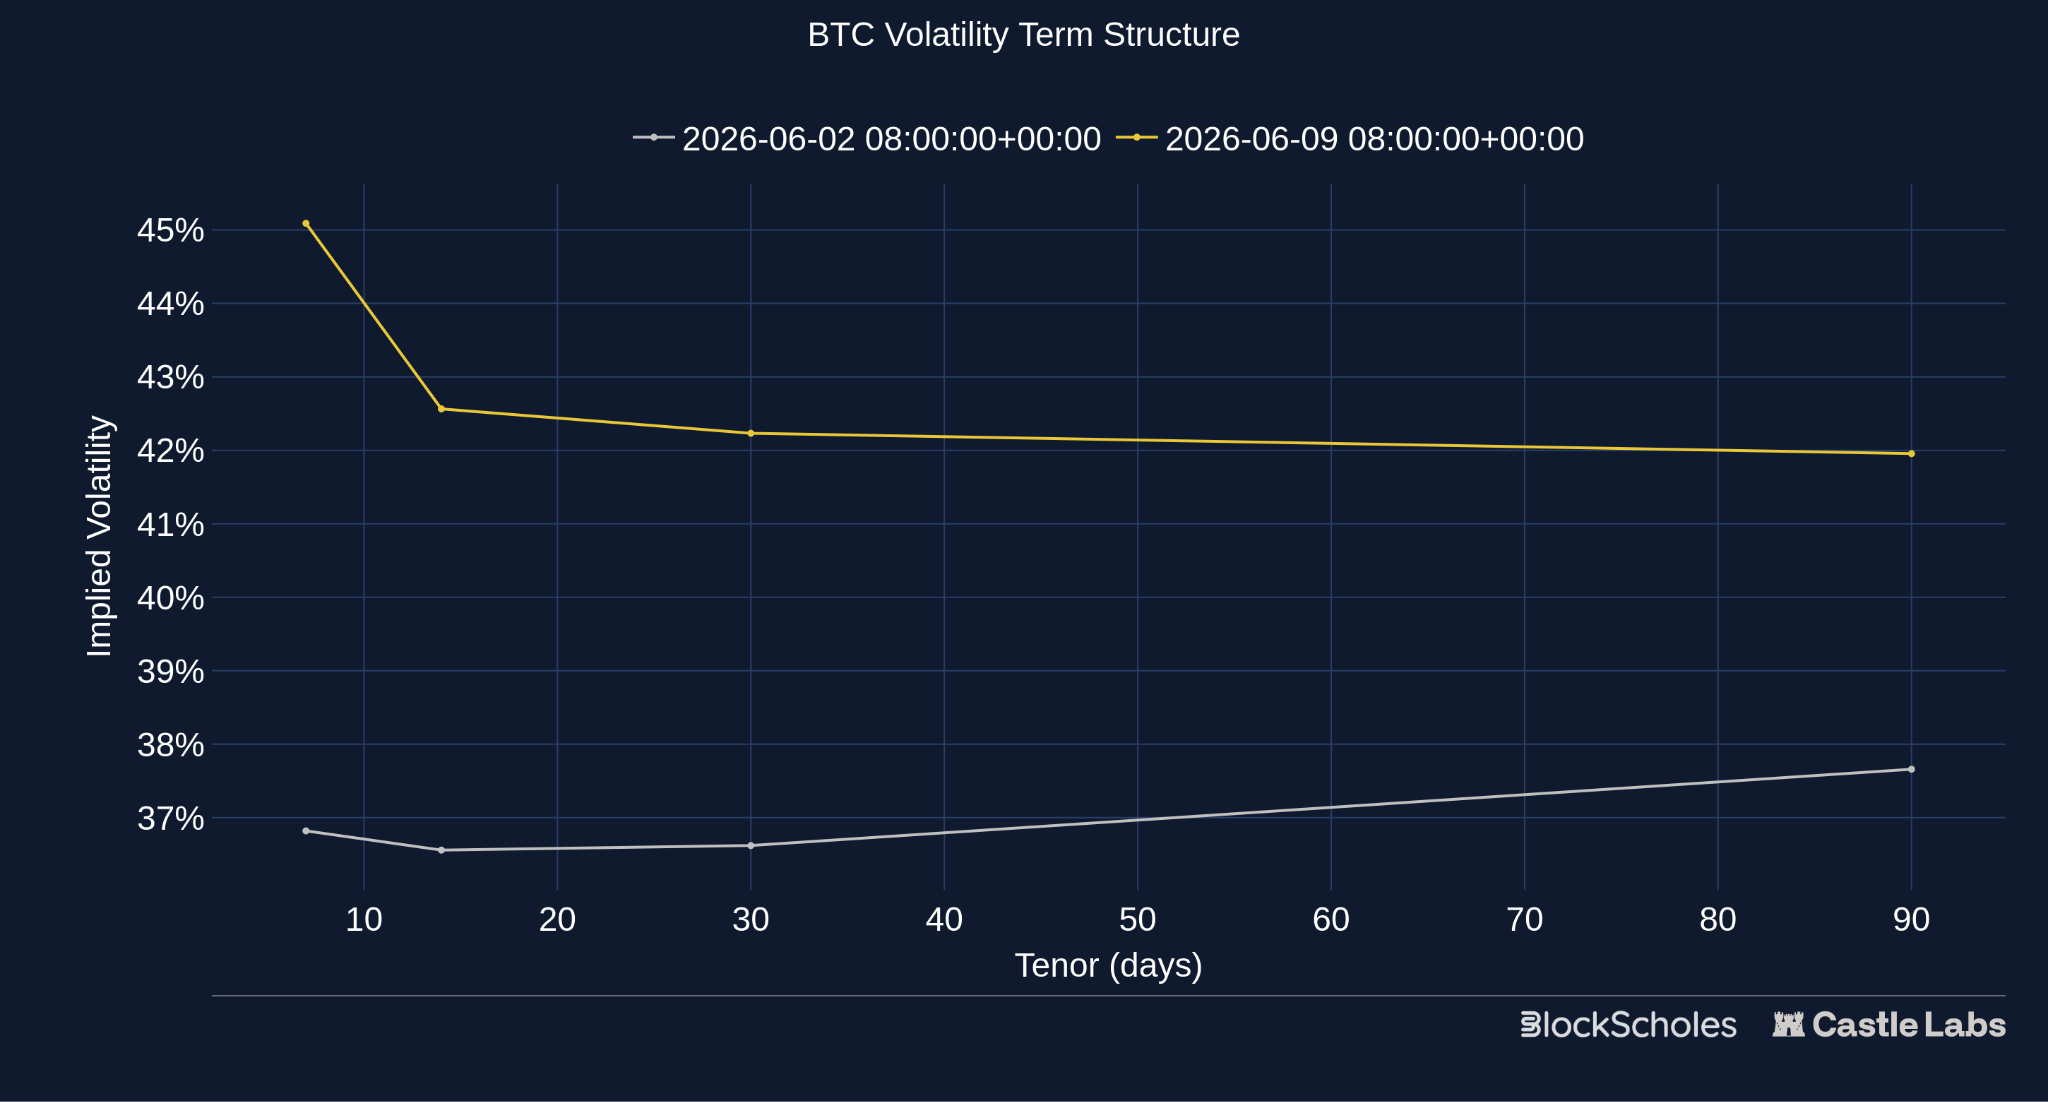
These inversions are typically driven by two factors:
June was the latter — the term structure inverted sharply in response to volatile moves in the underlying asset. On Friday, Jun 5, 2026, cross-asset volatility reverberated across markets: the Nasdaq-100 sank 5%, a blockbuster US jobs report pushed treasury bond yields higher across the yield curve, and BTC fell below $60K for the first time since October 2024.
The volatility in spot prices more than doubled, from 30% to 70% (on a 7-day rolling basis) — its second-highest level year-to-date. With the spot price tumbling to a 2024 low, realised volatility spiked higher, and, as such, options market participants repriced their expectations for future volatility. 7-day at-the-money BTC implied volatility spiked sharply on that Friday and over the subsequent weekend to 65%.
Want the data in this report?
For full access to the options IV, skew, term-structure and volatility-surface data used here — plus a much wider universe of crypto derivatives data, including perpetual swap funding rates and futures yields — subscribe via the BlockScholes API.
Start with Core for hourly REST composites, Prime for minutely data and WebSocket access, or Enterprise for live (~200ms) and custom source coverage. Data plans available here:
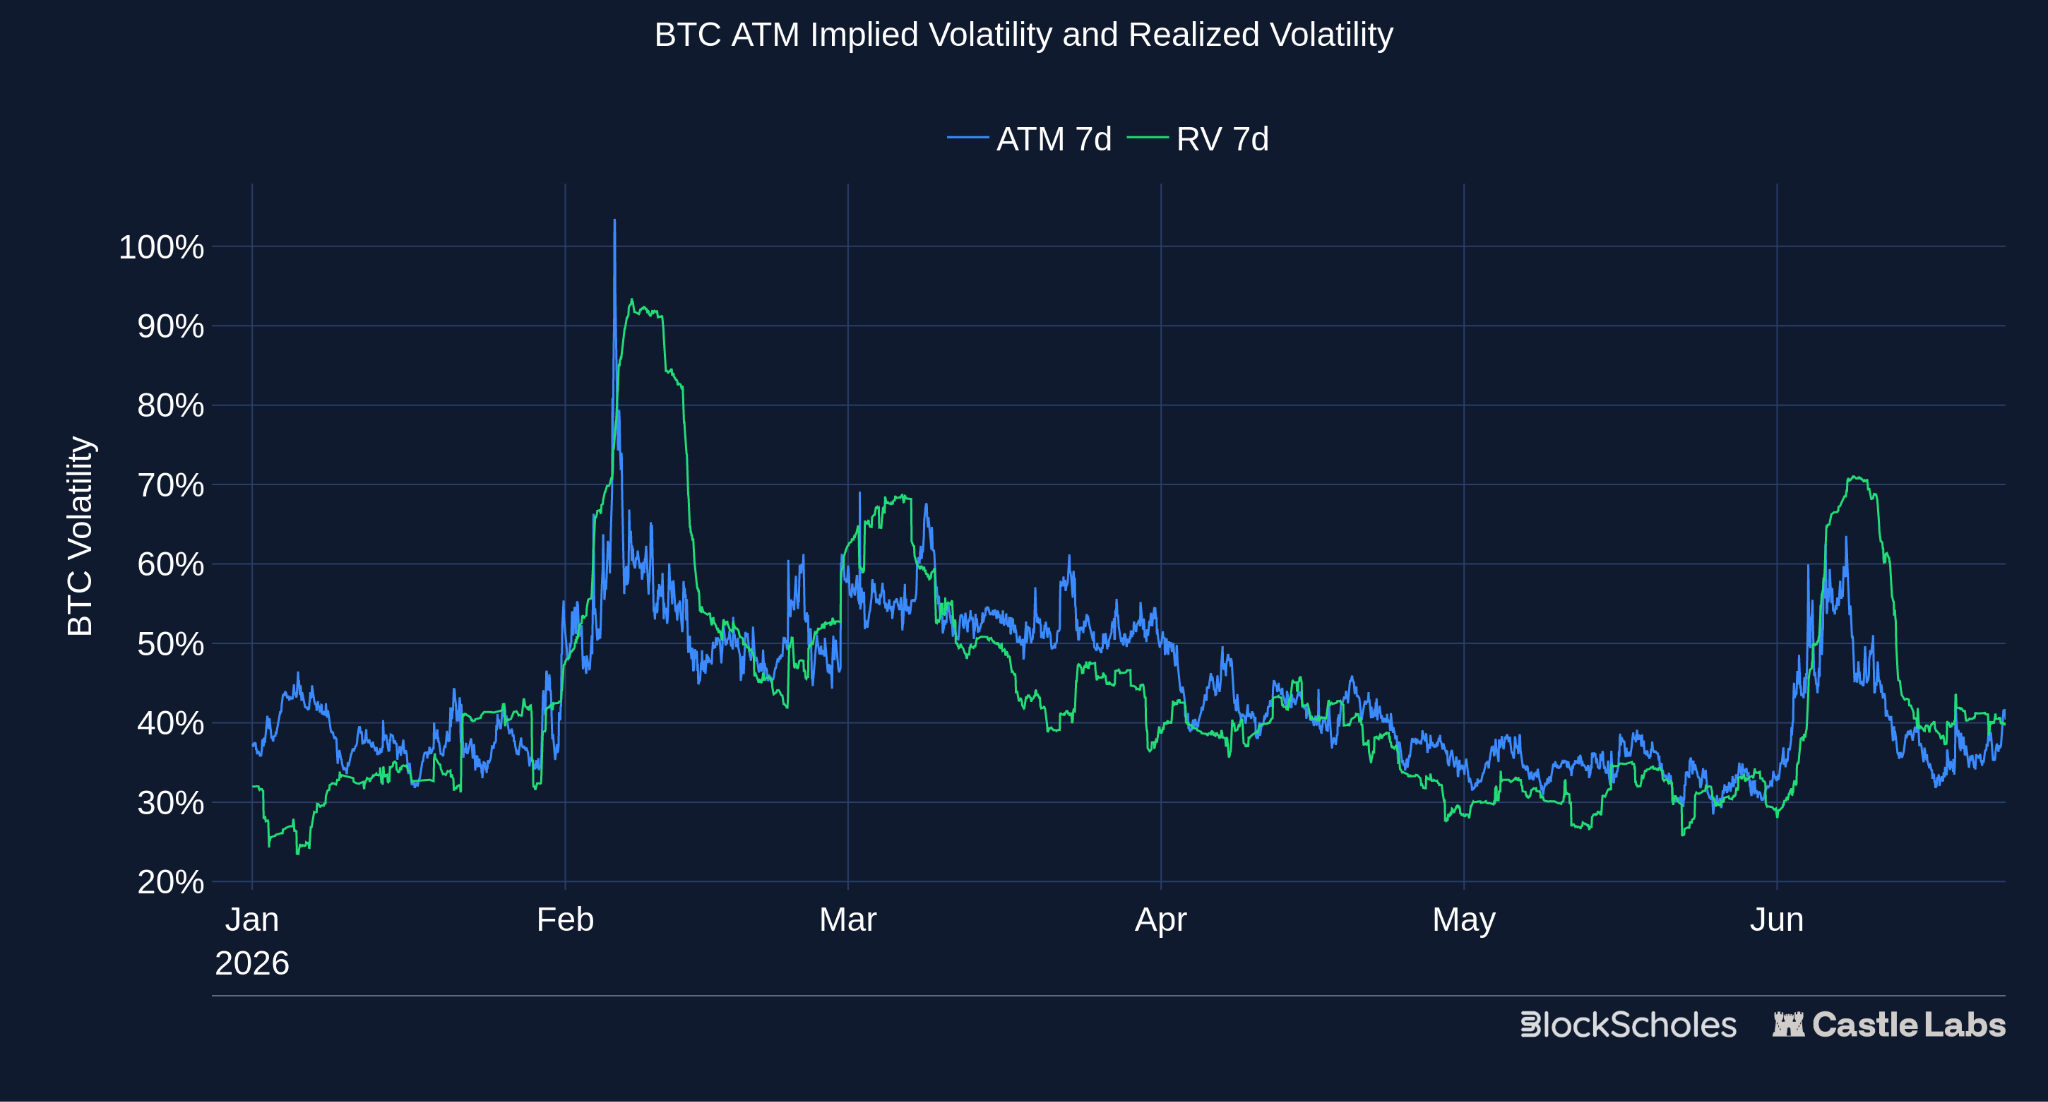
Realised volatility is, by definition, backwards-looking, calculated from the underlying asset’s past returns — that is, it shows traders the volatility BTC spot actually delivered. Implied volatility, by contrast, is forward-looking, representing what the market was willing to pay to be protected against those moves.
The difference between the two is the volatility risk premium. Typically, this is positive, i.e., implied vol sits above realised because market participants demand optionality. Buyers pay up for the protection (or leverage) that options provide, and persistent demand often lifts IV above the volatility the spot price actually delivers.
When ATM IV trades above the volatility delivered over the trailing seven days, options are embedding this premium over recently realised vol. This rewards sellers of optionality, so long as spot doesn’t subsequently deliver realised vol higher than the level options priced in. Conversely, when IV trades below realised vol, options are pricing a lower level of volatility than has recently been delivered, which rewards buyers of optionality if that elevated vol persists, i.e. if spot goes on to deliver more than options priced in.
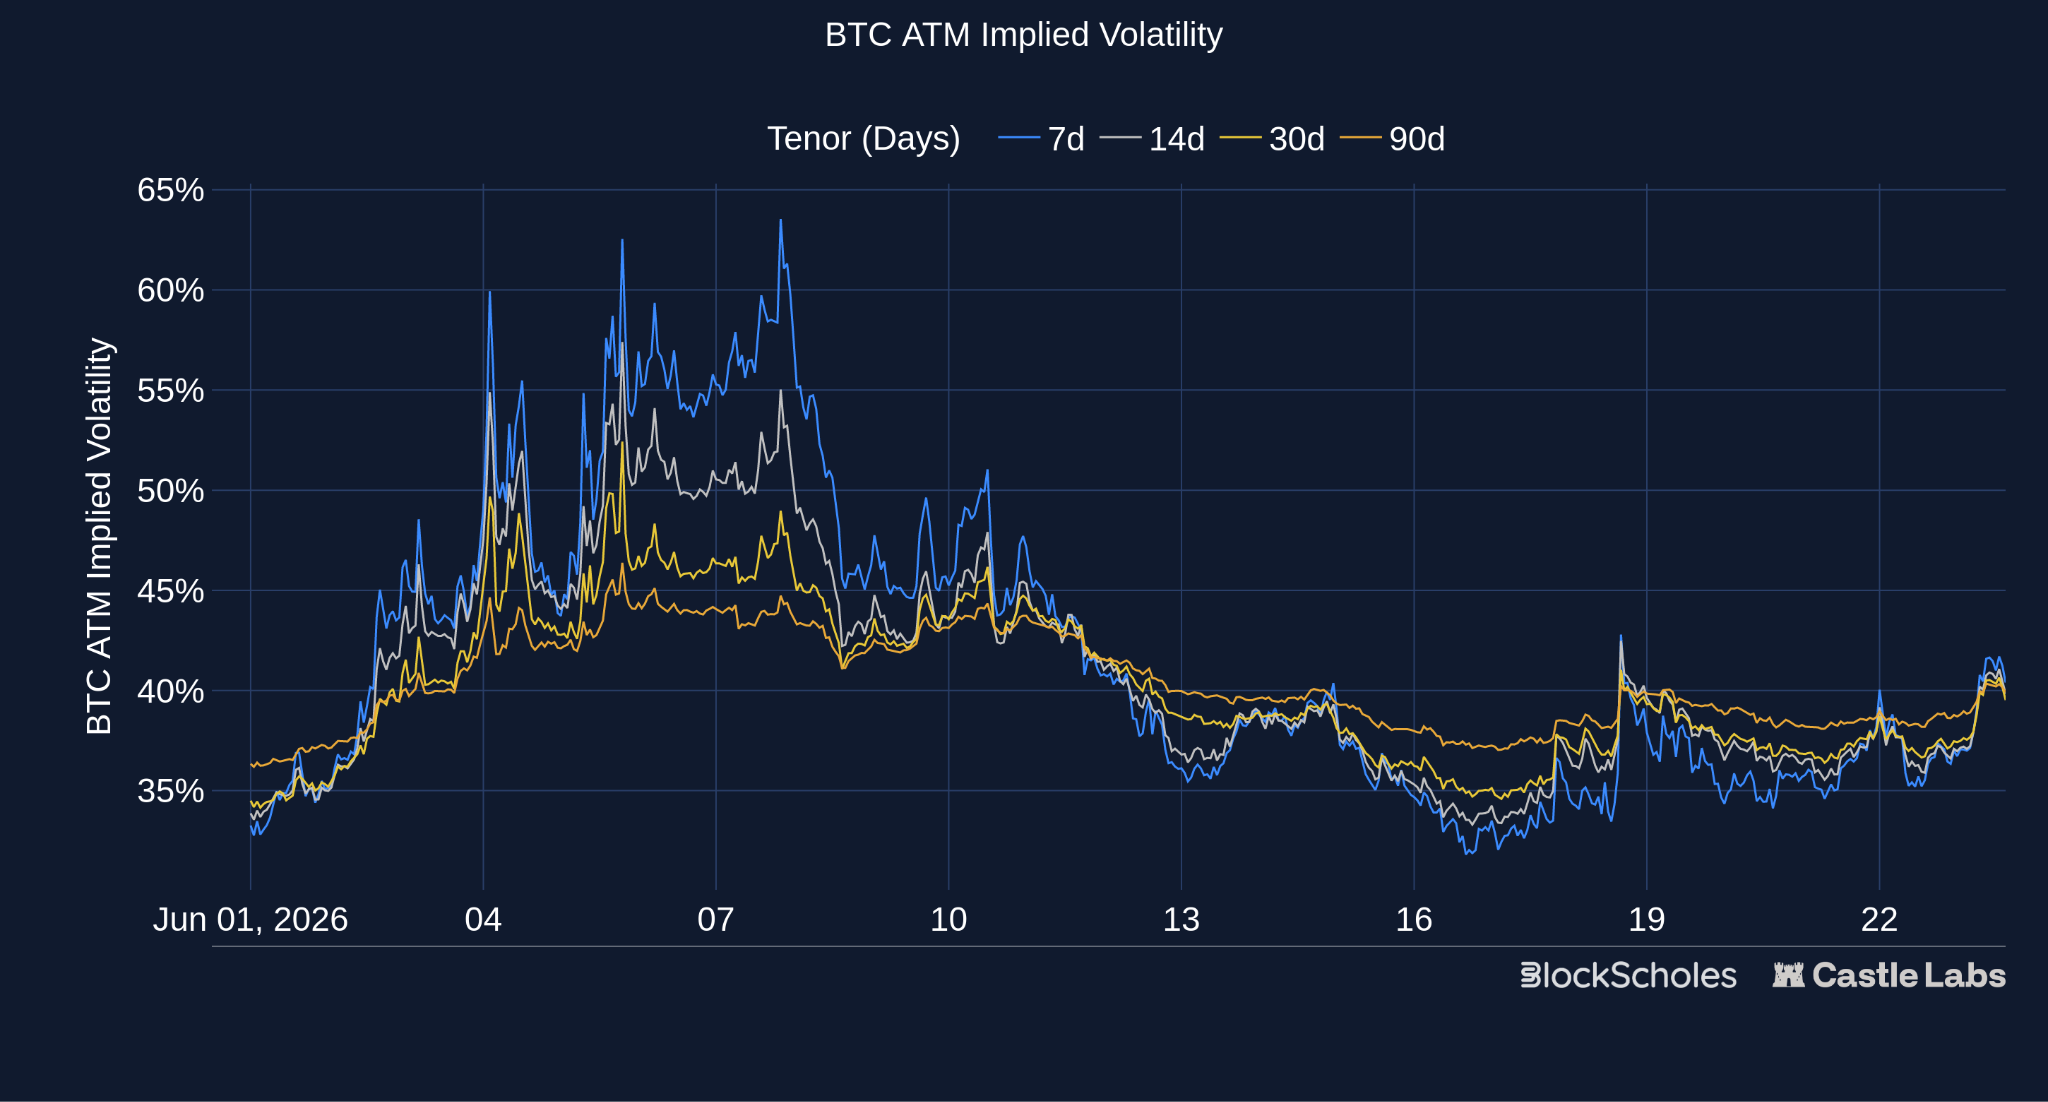
June was not just characterised by that sharp term structure inversion, however. Only a week after that sudden step-up in volatility, short-tenor BTC ATM IV collapsed back towards a multi-year lower boundary of 30%, in line with the year-to-date low in implied volatility reached in the preceding month of May.
Implied volatility for ETH options showed a similar pattern, though not as extreme on the way down. 7-day at-the-money IV spiked to 80% during the early June sell-off and quickly plunged by 30 vol points to 50% afterwards. Unlike BTC, however, 7-day ETH IV traded sideways around that 50% range and didn’t fall towards its May year-to-date low of 36%.
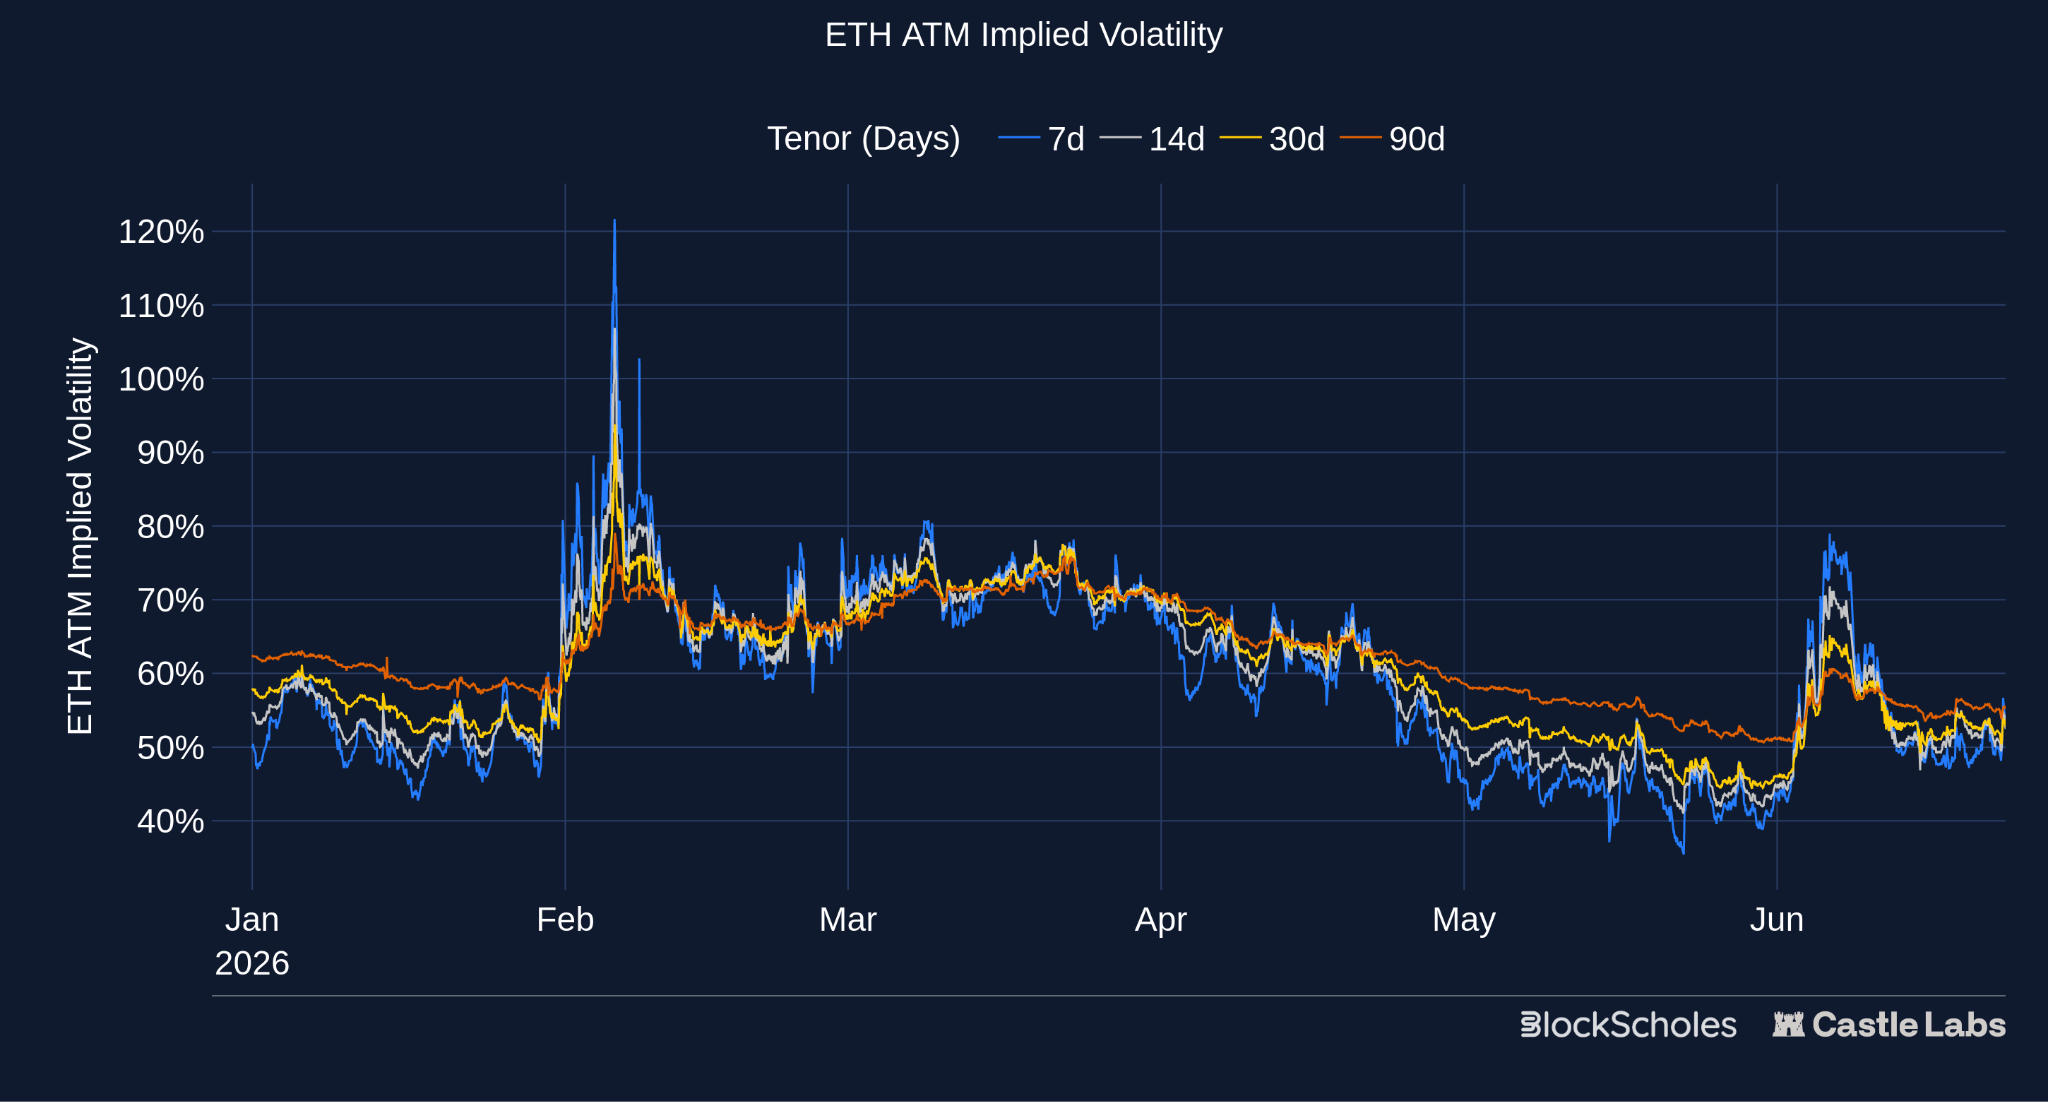
Such spikes and subsequent reversions highlight how volatile volatility itself can be.
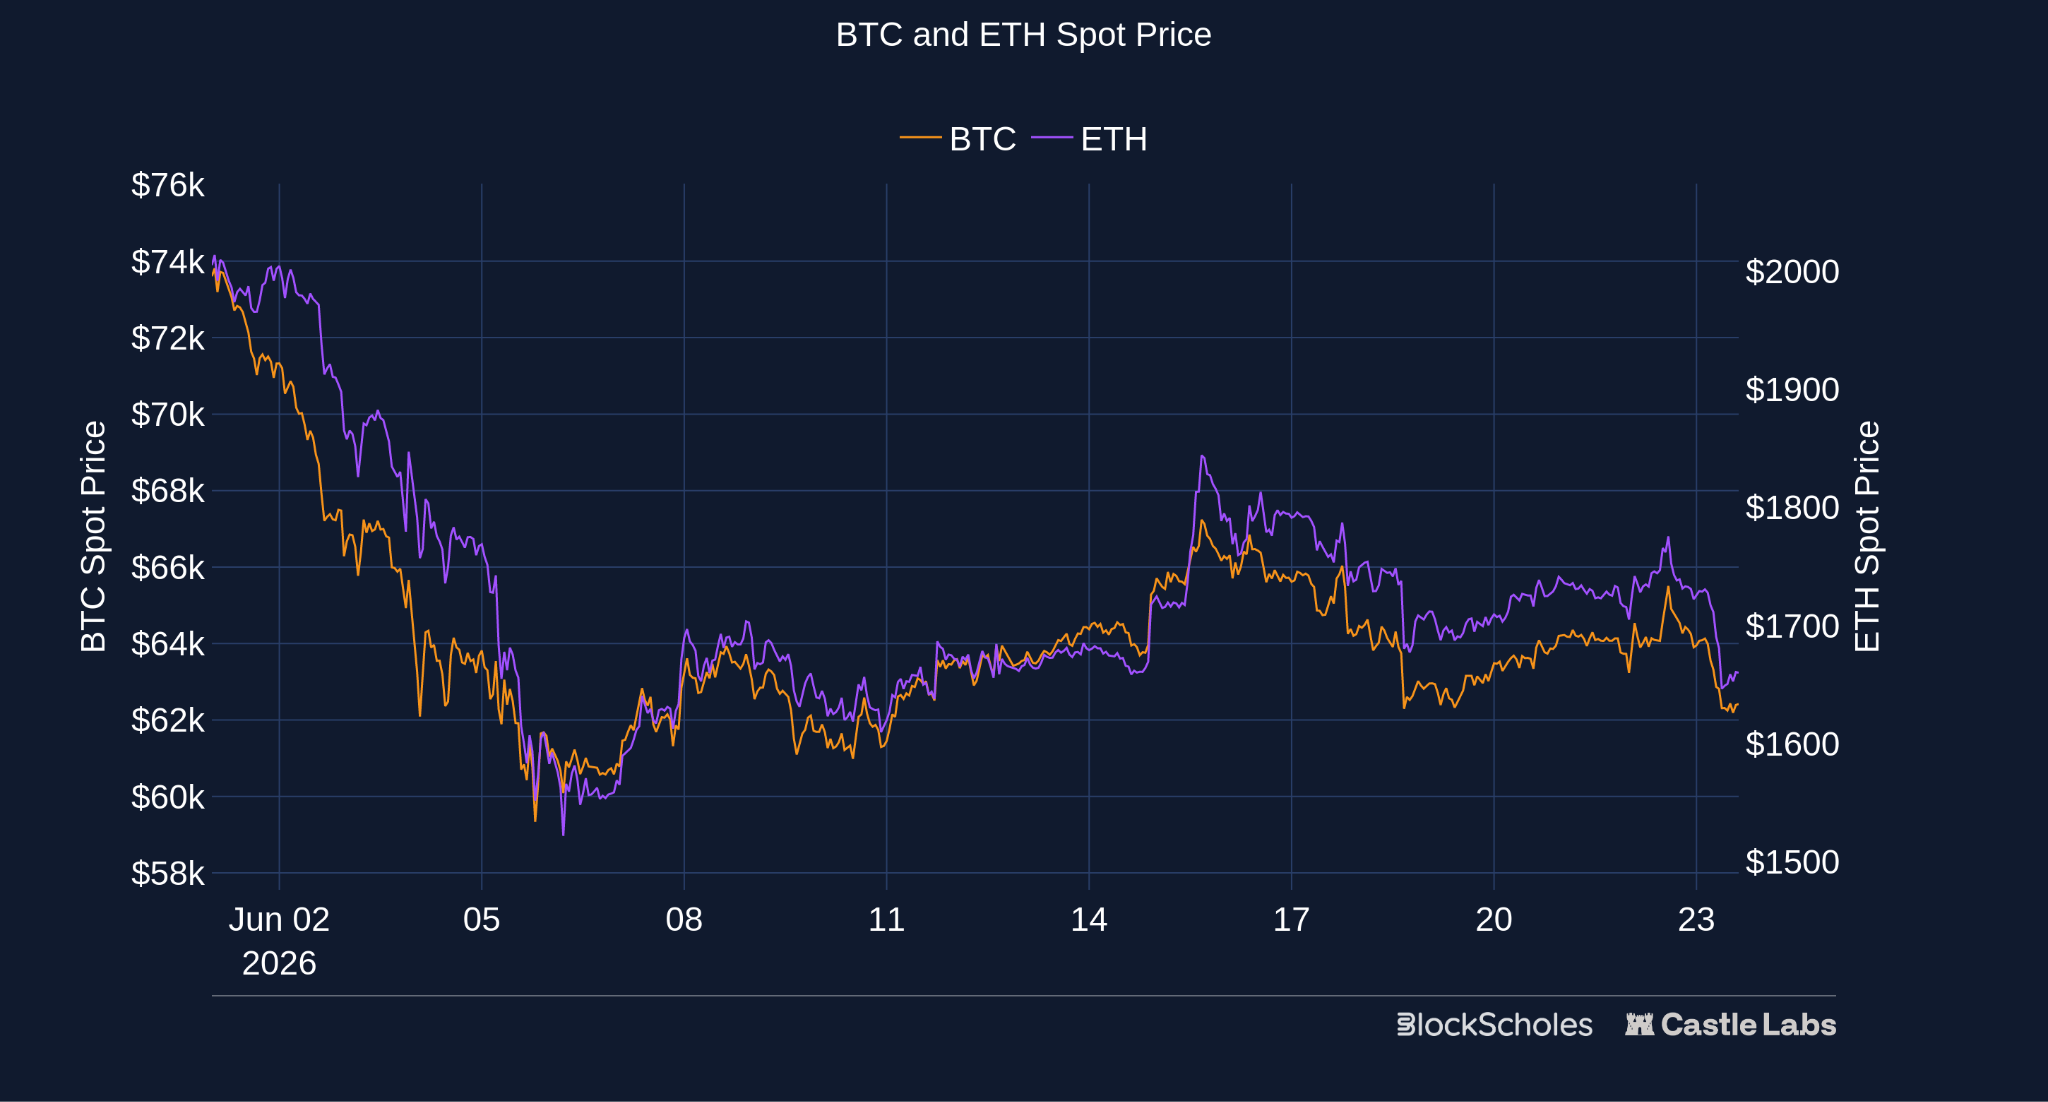
High volatility-of-volatility typically occurs against a market backdrop where sideways trading in spot price is suddenly punctuated by aggressive spot moves in either direction. We saw BTC exhibit this exact type of behaviour in June.
The beginning of the month saw a sharp plunge lower in spot price coinciding with the longest spot Bitcoin ETF outflow streak since their January 2024 launch and a symbolic 32 BTC sale from the largest Bitcoin digital asset treasury firm, Strategy. June 5, 2026, then saw the aforementioned asset-wide de-risking, which pushed BTC below $60K.
After hitting a local bottom shortly after, spot traded sideways before taking another leg lower from $67K towards $62K as risk-assets sold off once more, following the first FOMC meeting under new Chair Kevin Warsh. In that meeting, nine policymakers expected at least one interest rate hike from the Federal Reserve before the end of the year, a sharp contrast to the median projection of one rate cut in the March 2026 meeting.
One by-product of a high vol-of-vol market environment is often a steeper volatility smile. This occurs when options that are deeper out-of-the-money trade at a higher volatility premium relative to options struck at-the-money. Up to now, we’ve focused on the at-the-money level of volatility — a single point on the surface. A volatility smile (as shown below) plots implied volatility across a full range of strikes for a single tenor (7-days here). 50-delta can roughly be thought of as the ATM level, with the upward-curving wings representing out-of-the-money puts (left side of the smile) and out-of-the-money calls (right side of the smile).
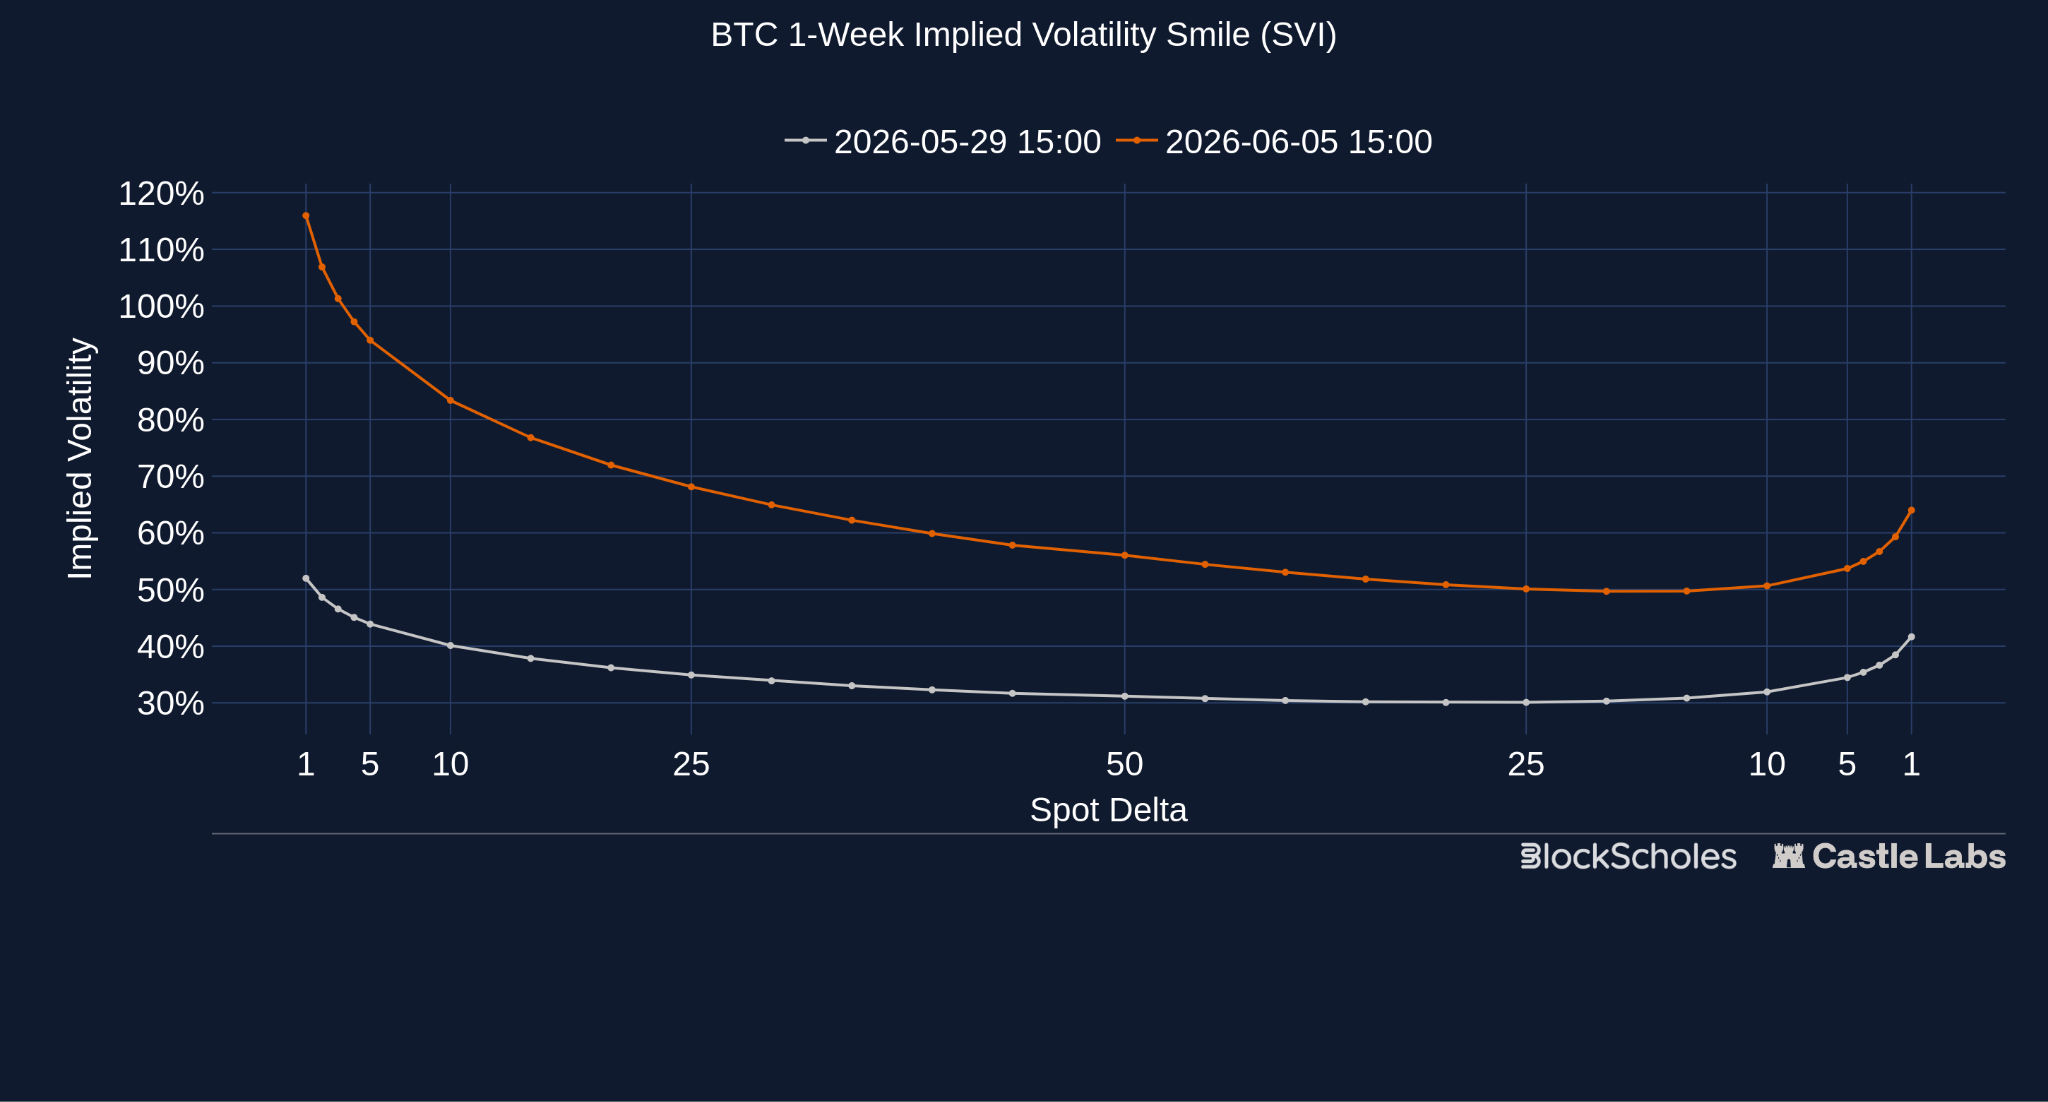
During the June 5 de-risking, the entire smile, including the ATM IV, lifted higher relative to the preceding week (as we described earlier).
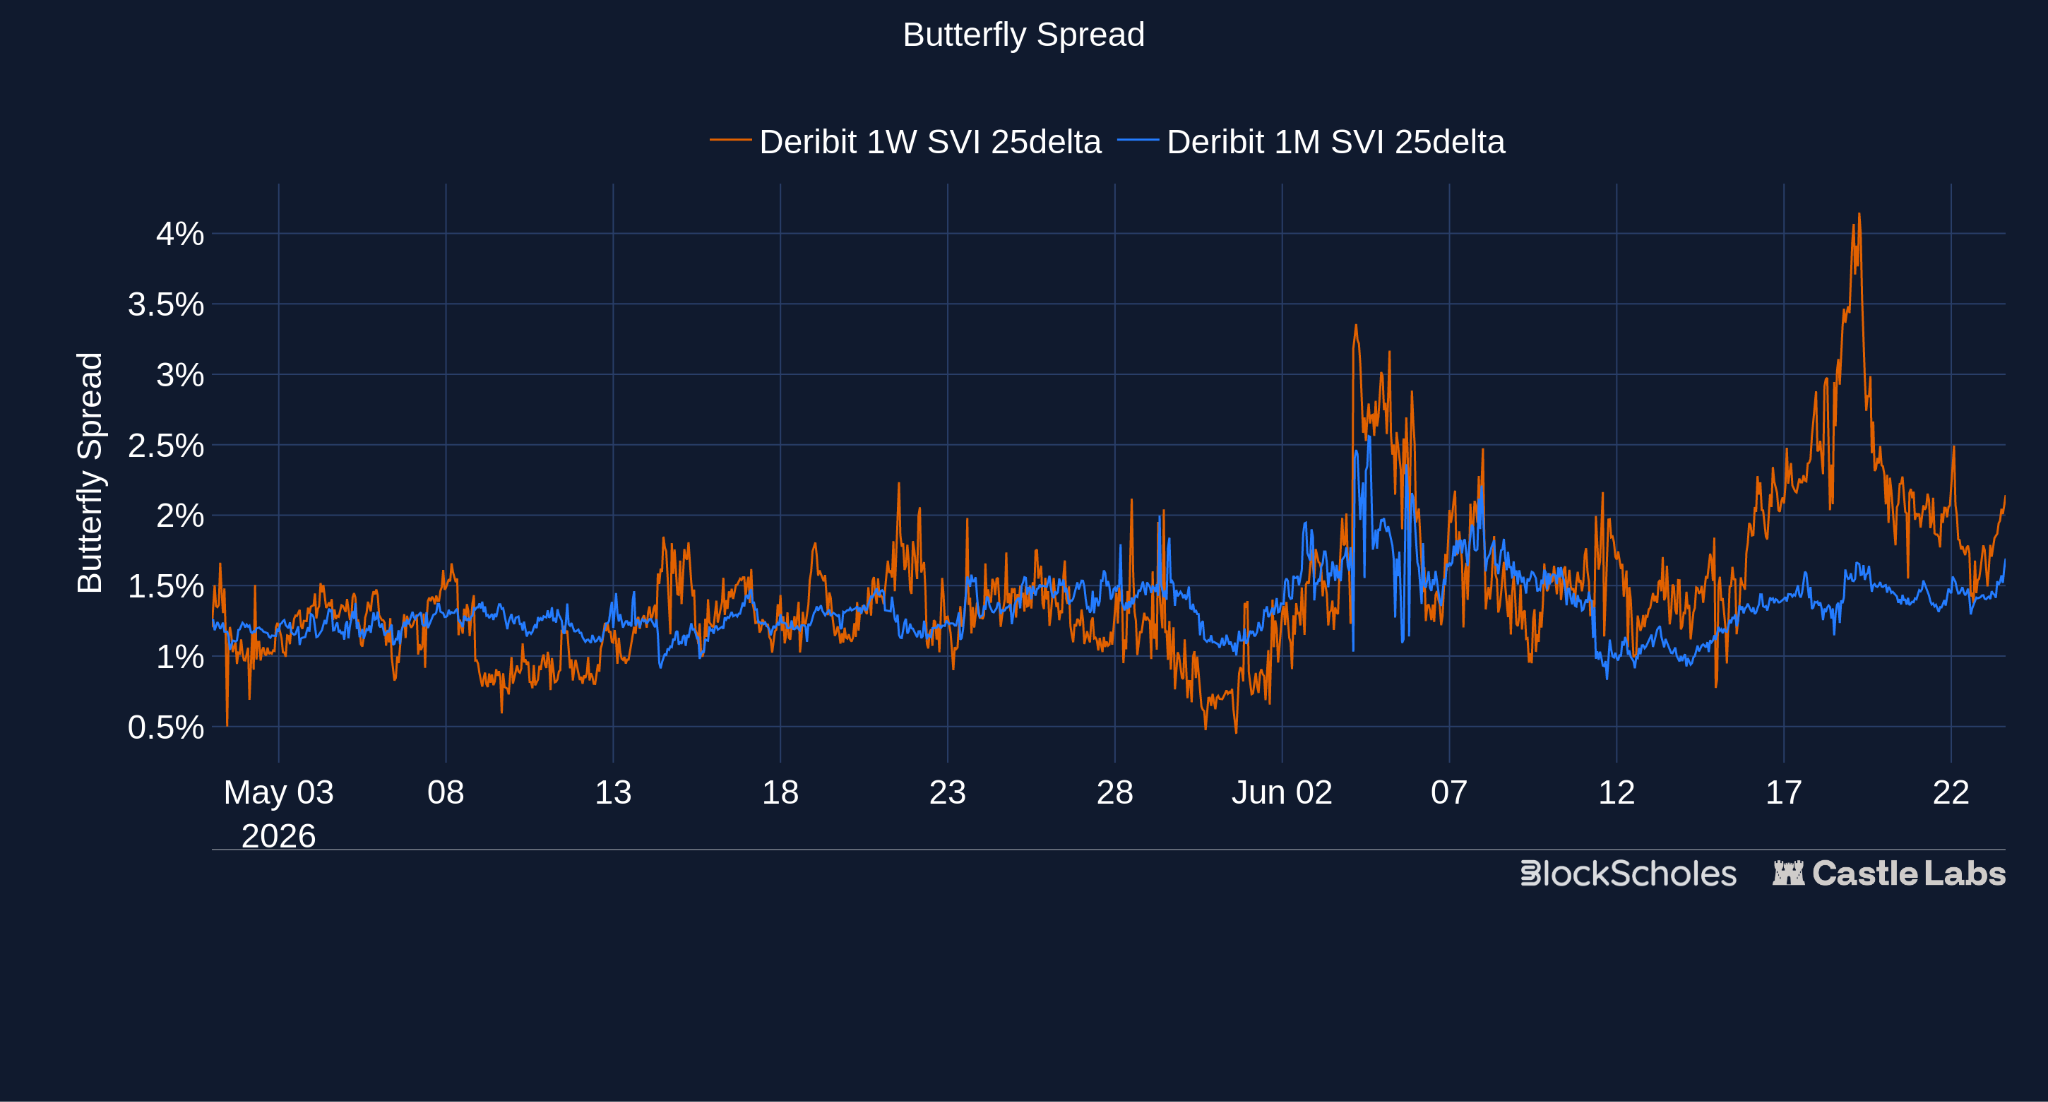
The smile also visibly became more convex: one way to measure this is the butterfly spread, which is computed as the average implied volatility of the 25-delta call and 25-delta put minus the at-the-money implied volatility. A larger butterfly means the wings of the smile are bid up relative to the ATM — i.e., a more convex smile, and a higher market-implied probability of large moves in either direction.
Consistent with the elevated vol-of-vol, BTC’s 1-week butterfly spiked repeatedly through June, toward 3–4% around June 4 and again between June 15 and 19. The selloffs in spot price around each of those dates resulted in options traders pricing in a higher probability of further swings in spot price, making both higher-strike calls and lower-strike puts more attractive.
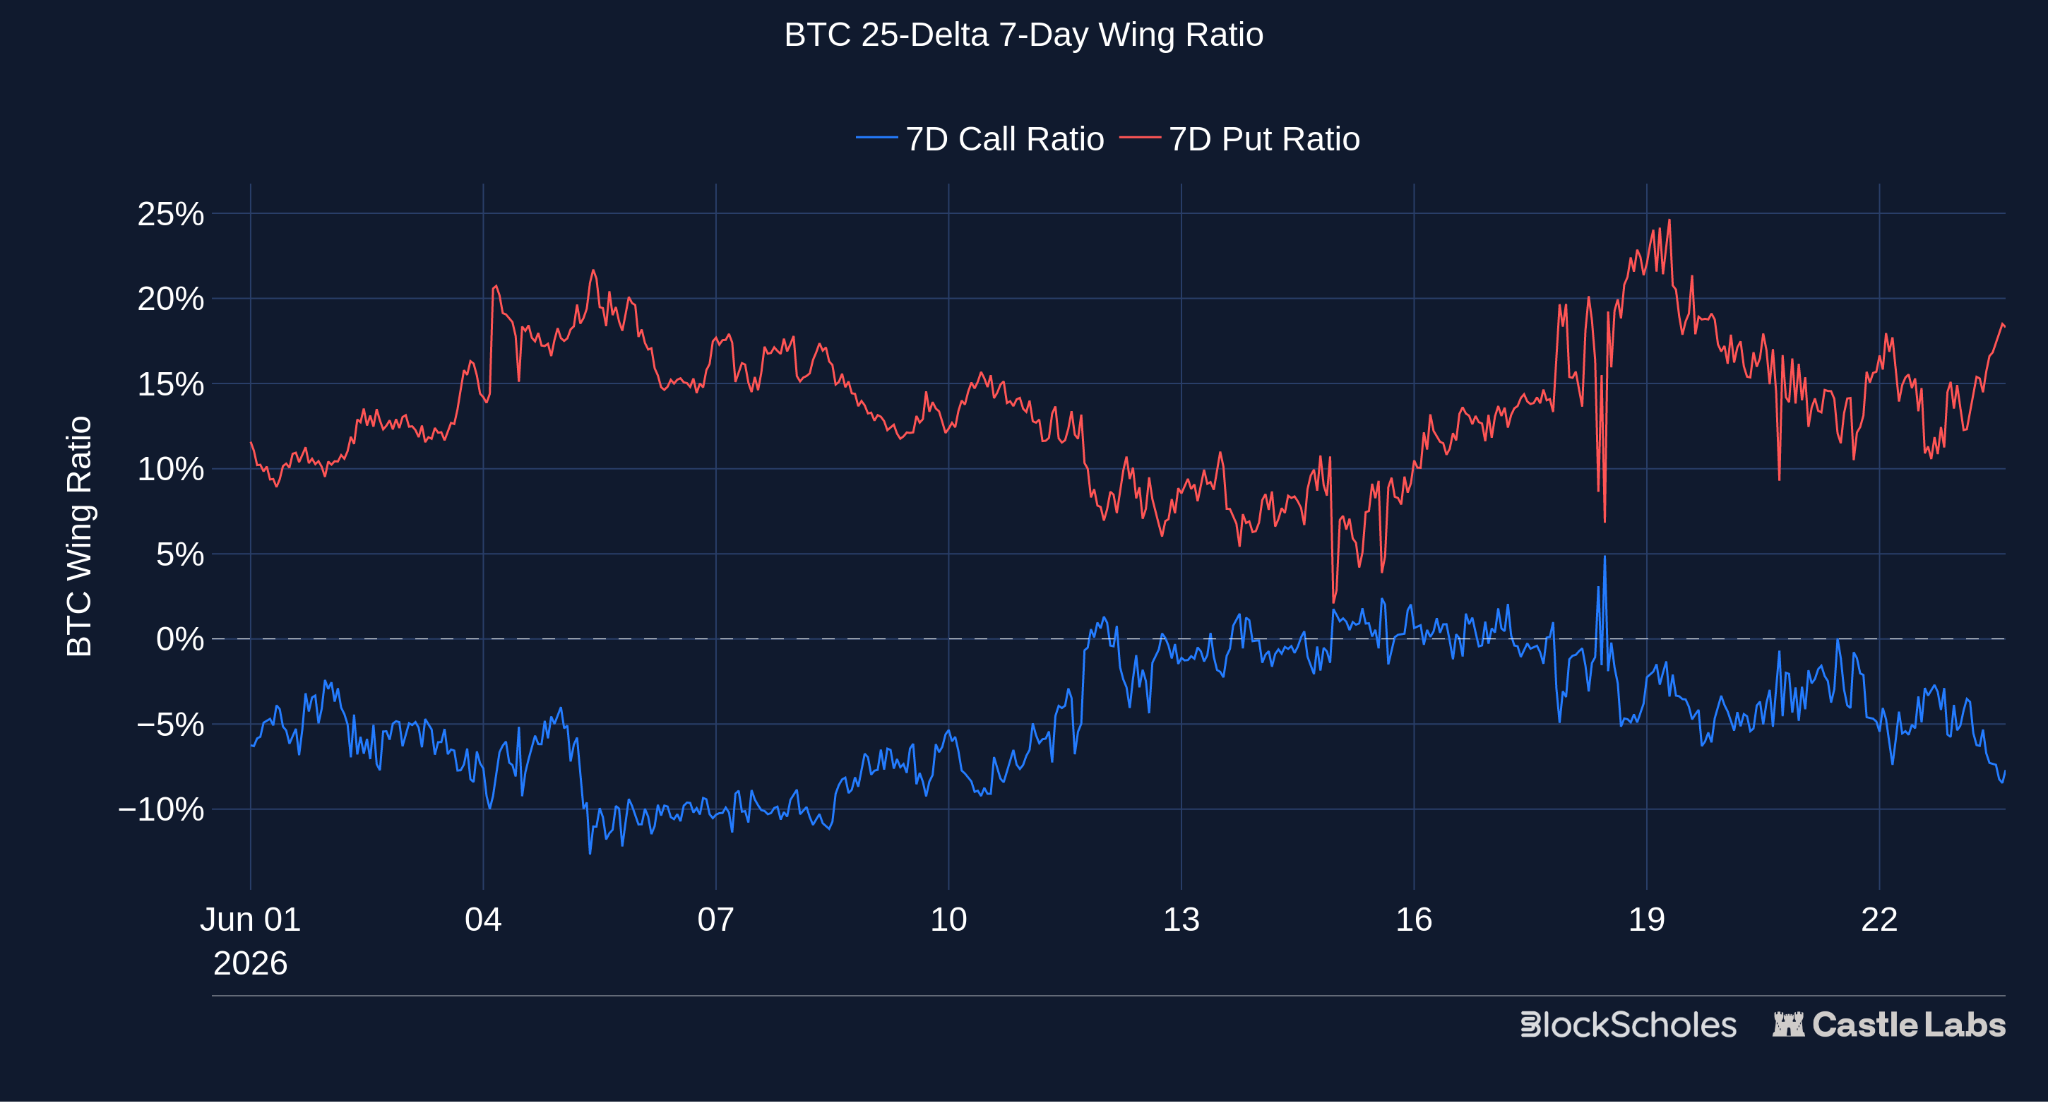
Decomposing the steepening in the butterfly reveals whether the wing demand was two-sided, i.e., for both calls and puts, or directional. The chart below plots each wing’s implied volatility as a premium to ATM and shows that, through June, the put wing traded a persistent 10–25% above ATM, while the call wing traded 5–13% below ATM. The steepening of BTC’s smile was therefore mostly driven by downside demand for out-of-the-money optionality, with little appetite for upside calls.
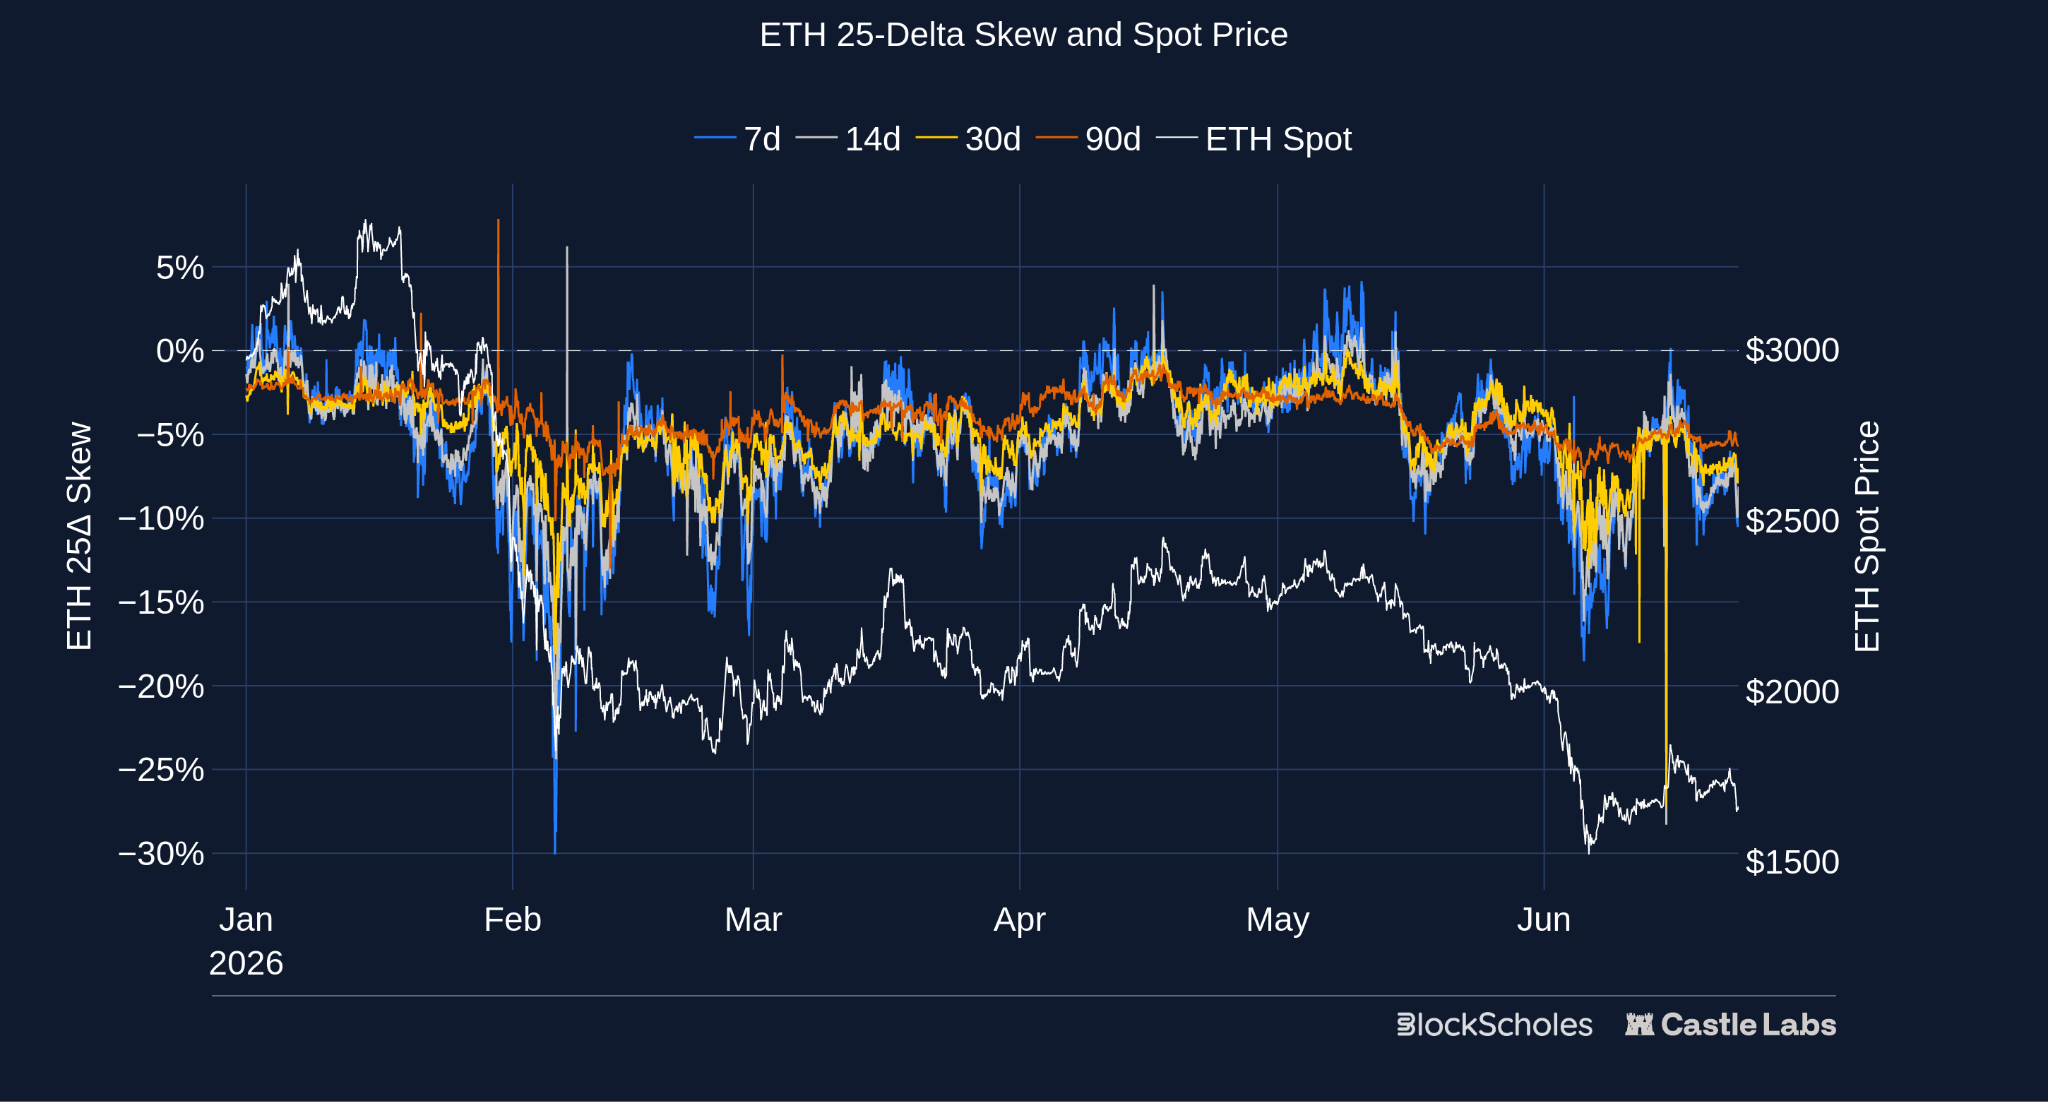
While the level of the volatility smile indicates the absolute volatility expected by traders, the skew of the volatility smile is an important directional indicator of market sentiment. Here, we define the volatility smile skew as the difference between the implied volatility of an out-of-the-money call and an equally out-of-the-money put (for example, at the 25-delta level).
For most of 2026, BTC’s 25-delta put-call skew has traded firmly negative – a bearish indication that markets prize put options over call options. During the February meltdown, when the spot price fell the most in a single day since the collapse of the FTX exchange in 2022, 7-day skew dropped to -30% — a sign that markets were willing to pay steep premiums for downside protection.
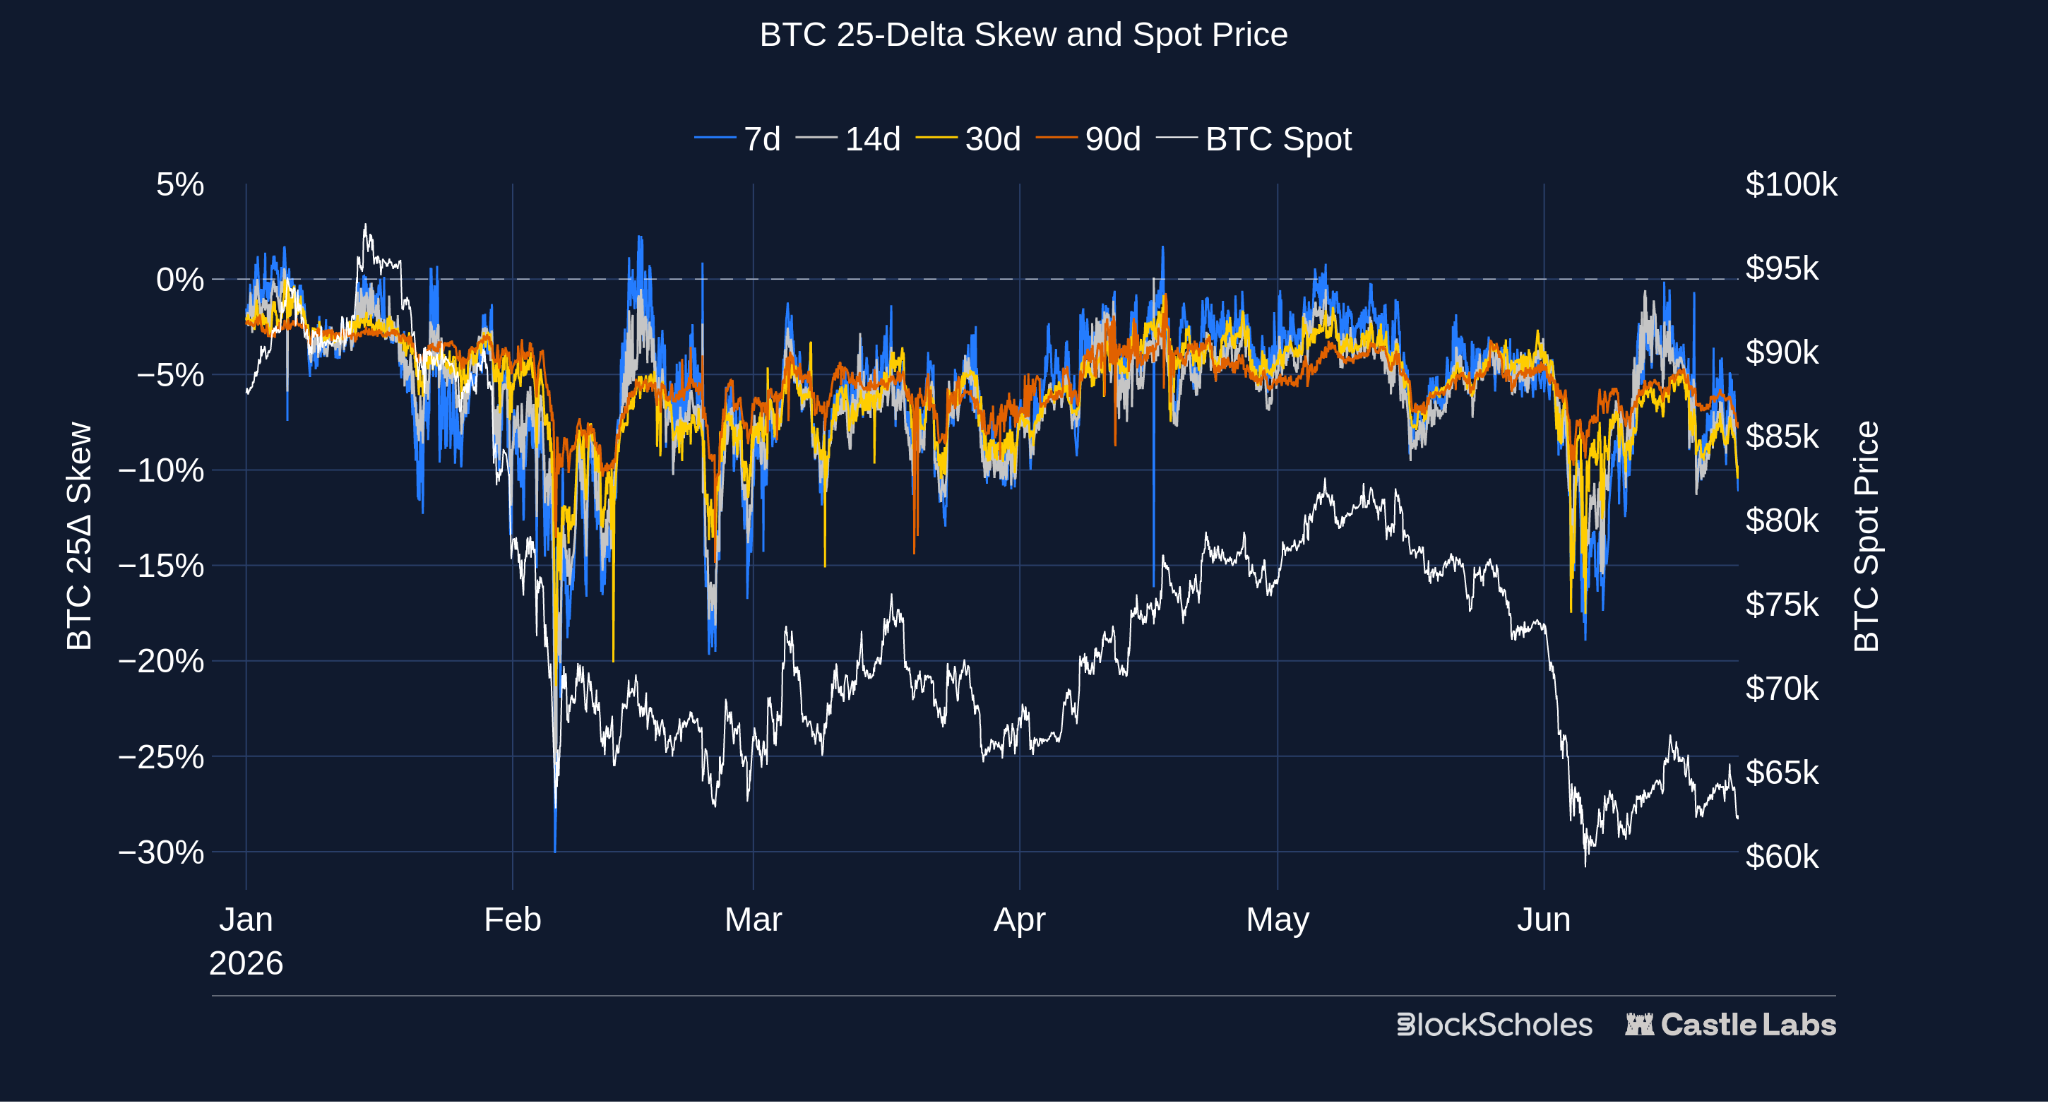
Interestingly, for both BTC and ETH, skew has failed to remain meaningfully above 0% (a bullish sign that call options are in demand) at any point this year. Even during brief spot price rallies, demand never rotated back toward upside calls for a sustained period, with the skew often failing to even reach neutral levels.
Skew and butterfly are just two features of the volatility smile, however. The smile itself (for each expiration date) encodes something else which is very important: a complete probability distribution for where BTC could be trading at expiration. The chart below plots the market-implied distribution of spot price drawn as a probability cone, mapped to the last listed Deribit expiry of the year, 25 December, 2026.
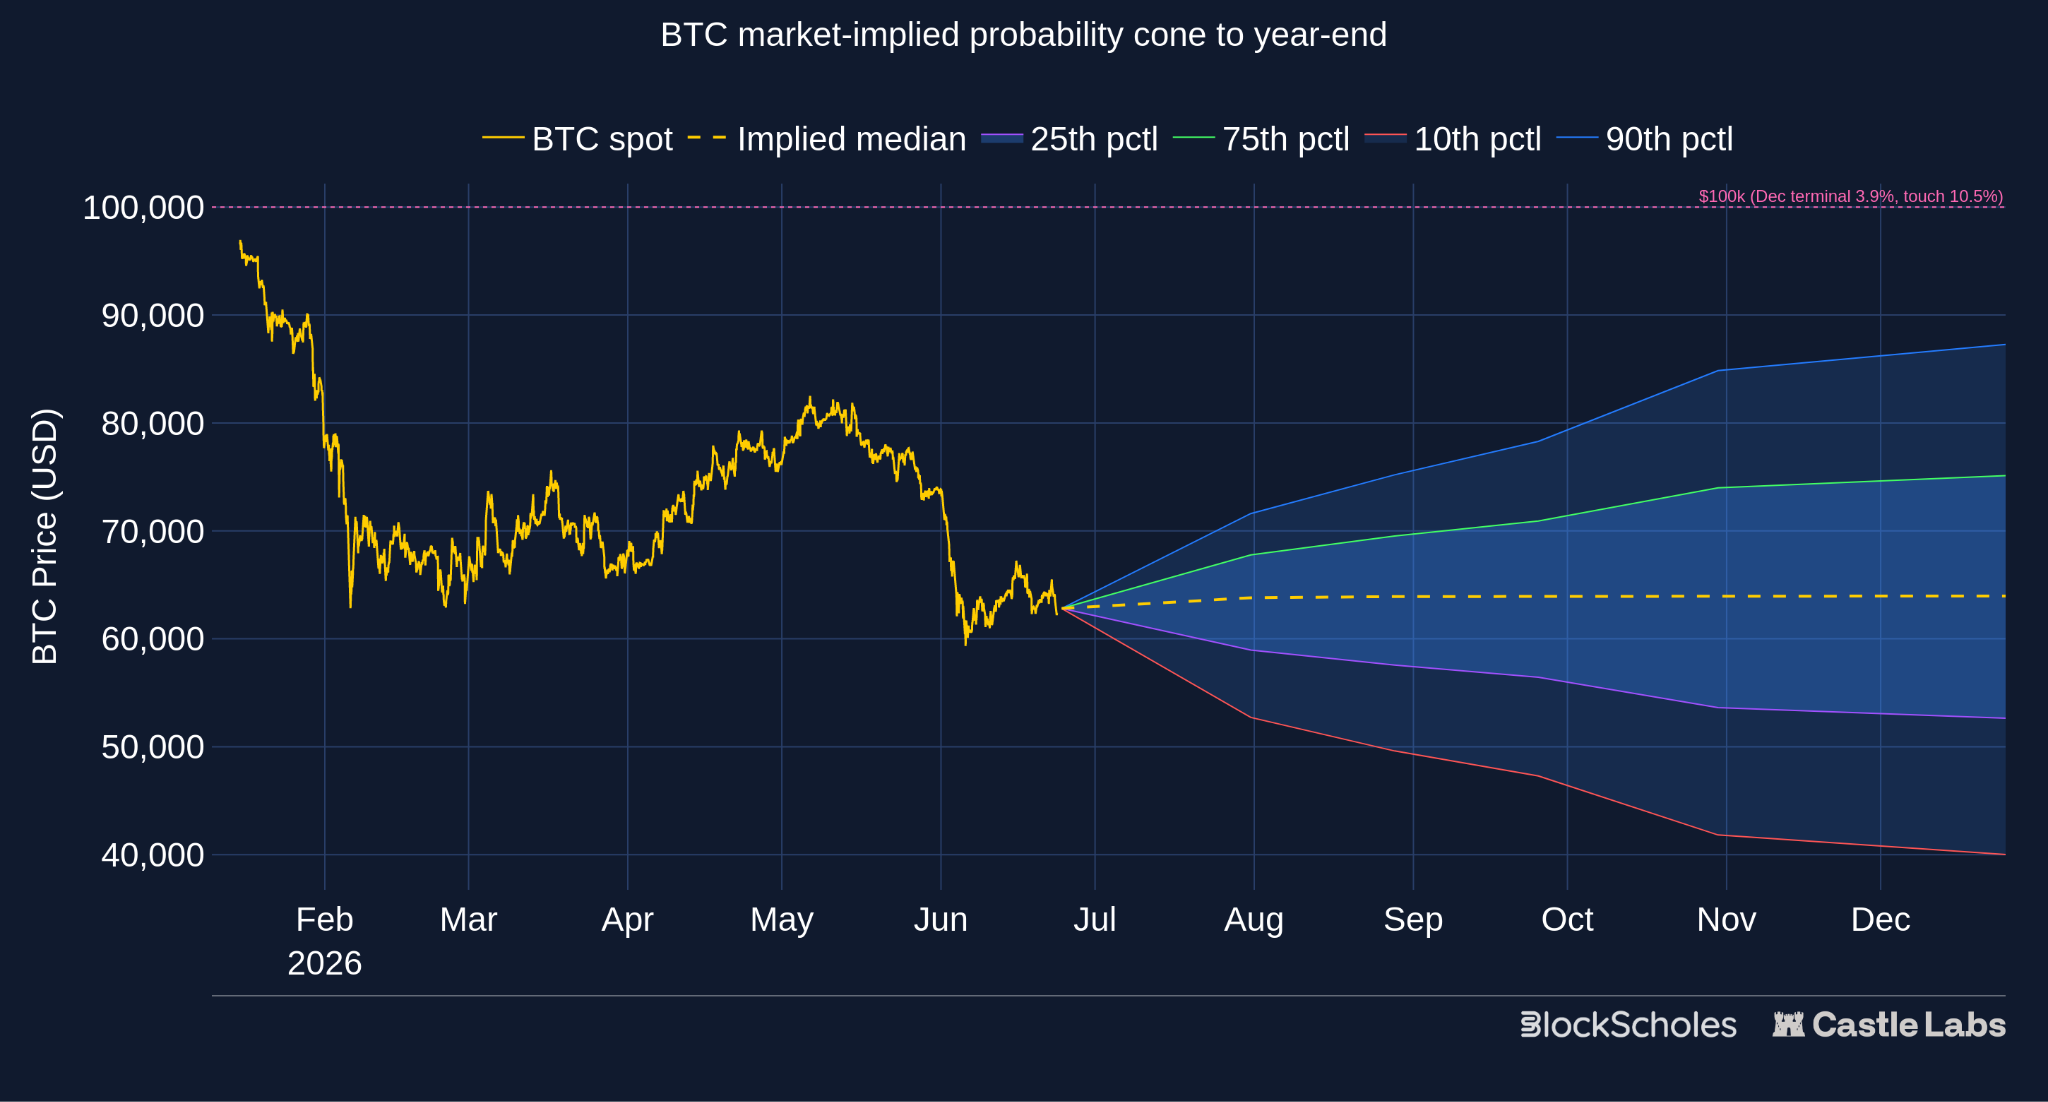
The shaded regions show the market-implied range for year-end BTC. The inner dark-blue band spans the 25th–75th percentiles while the wider light-blue band spans the 10th–90th percentiles. It shows that the market is pricing a very low probability of being above $100K by year-end — only 3.9%. Additionally, current market prices imply a 90% probability that BTC will be below $87K by the end of the year (phrased differently, only a 10% chance BTC will be above $87K) and a 75% probability that it will be below $75K. That is, based on current pricing, an all-time high close by year-end is a long shot in the options market.
From the surface, we can also calculate a one-touch probability — the chance that BTC trades through $100K at any point before the end of the year, even if it slips back — is roughly 10.5%. This is slightly below the probability priced in by traders on prediction markets. The “will BTC reach $100k before 2027” contract on Polymarket, which resolves to Yes if BTC touches $100K at any point before year-end, currently prices the outcome at 14.5%, about four points above the options-implied 10.5%.
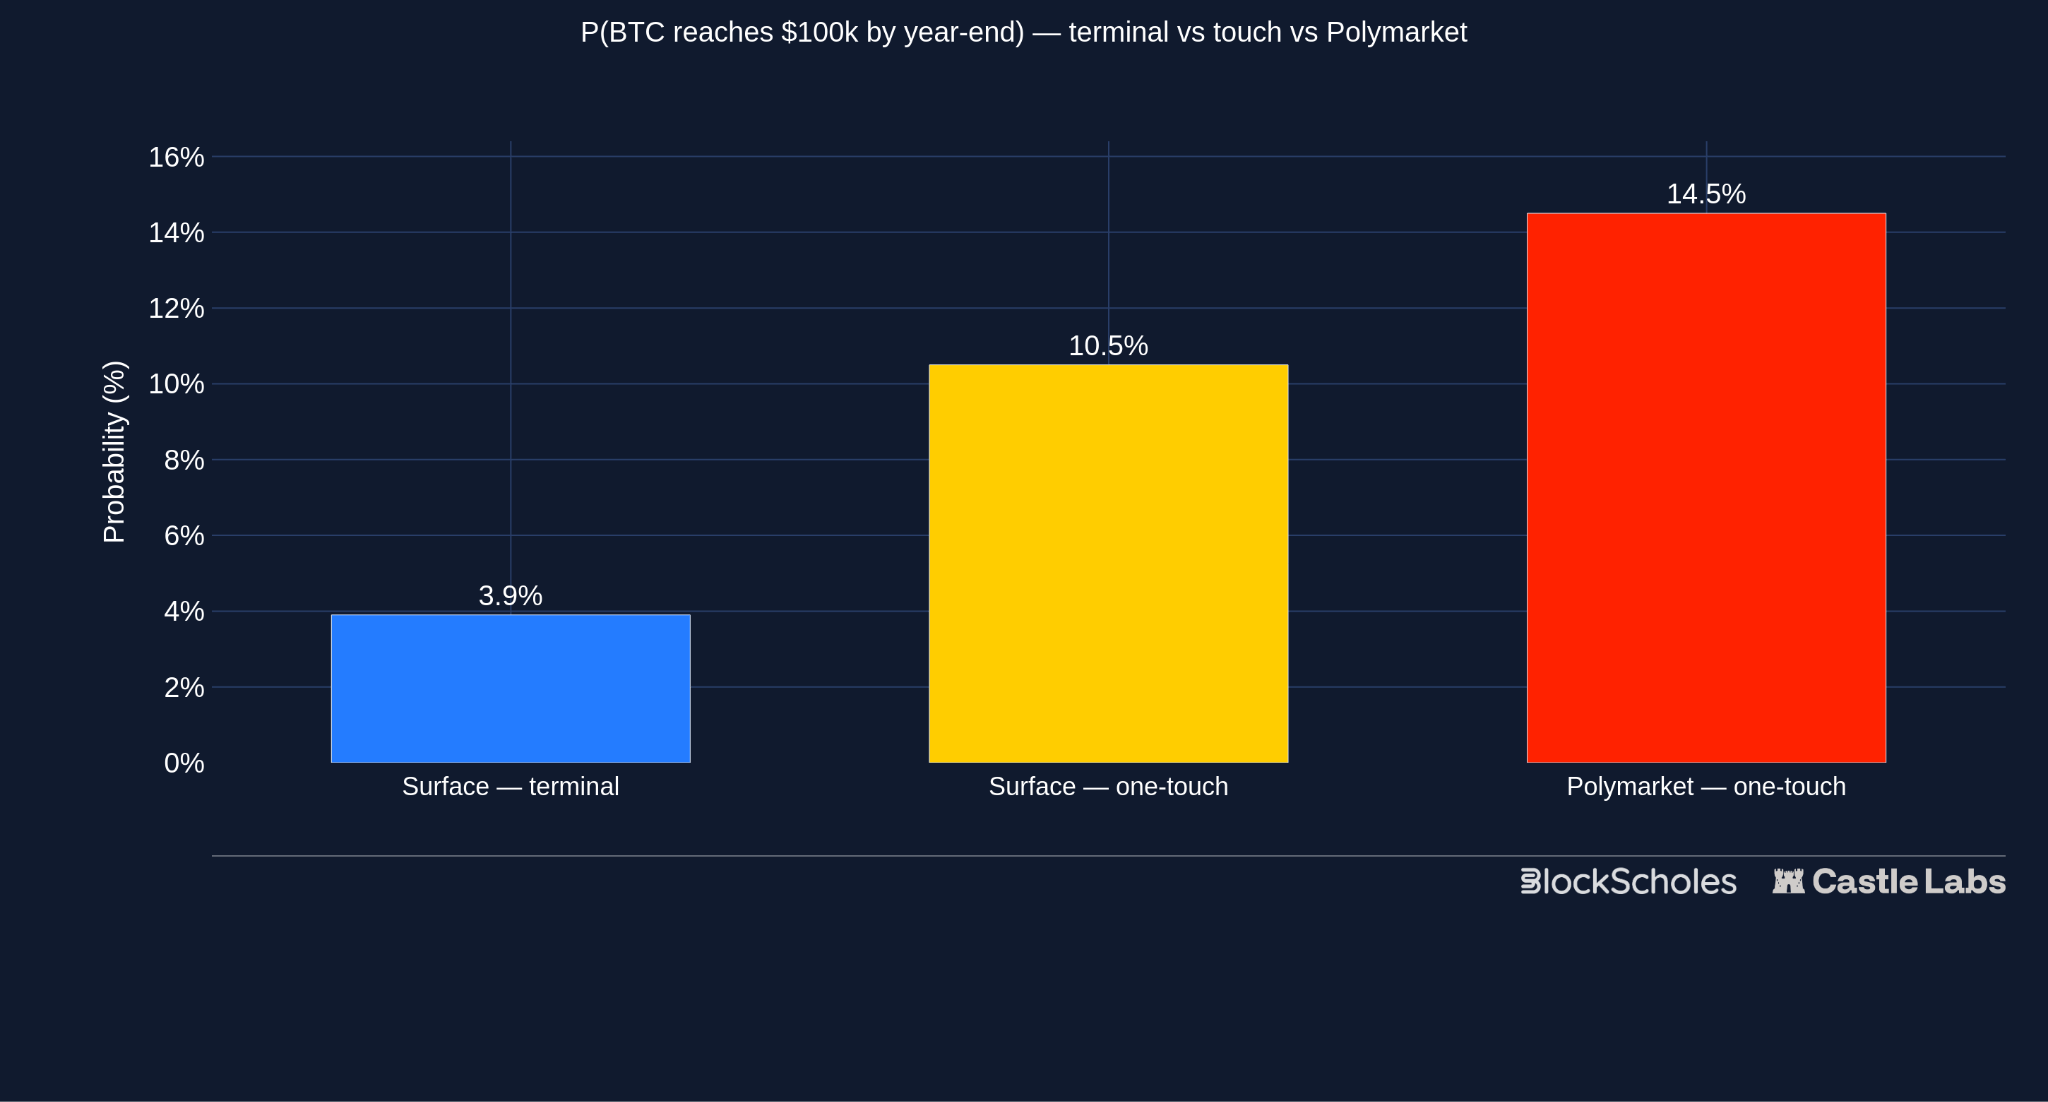
This section compares the market-implied probability of BTC touching $100K at any point in 2026 and BTC being above $100K by year-end — similar instruments but different payoff structures. Next, we compare the same instruments: a binary that pays $1 if BTC is above a given strike at a specific time, priced on Polymarket and derived from the Block Scholes composite surface.
Prediction markets and the options market both price outlooks on where an underlying asset will trade at a future date. Here, we examine a live prediction market, the probability distribution it implies, and compare it with the general market’s implied probability, derived from the Block Scholes composite volatility surface, to empirically demonstrate the analytical connection between these markets.
For this purpose, we will look at the recurring market on Polymarket titled “Bitcoin above _ on June 28” which has a ladder of strikes:
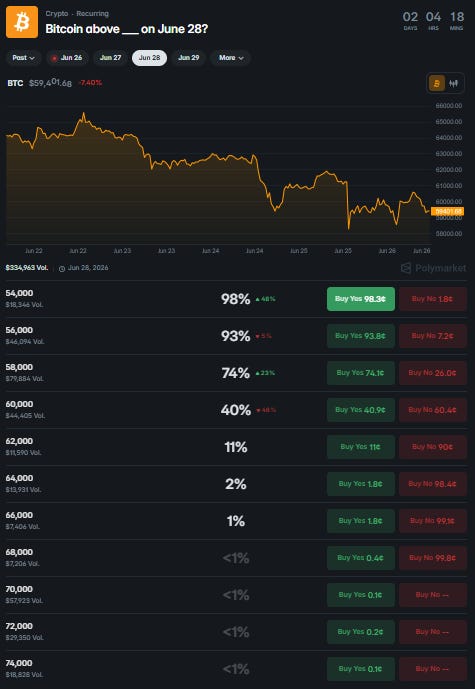
“Market will resolve to ‘Yes’ if the Binance 1 minute candle for BTC/USDT 12:00 in the ET timezone (noon) on the date specified in the title has a final ‘Close’ price higher than the price specified in the title. Otherwise, this market will resolve to ‘No’.”
Both prediction-market contracts and binary options have a step-function payoff: a fixed amount if a condition is met at expiry. For prediction-market contracts, the price reflects the probability that the market believes the underlying asset will resolve above a strike price. ‘Yes’ trading at 44¢ implies a 44% chance of the underlying trading above the strike price by expiry. This is because these contracts are standardised at $1, allowing the price to be read as an implied probability. The same interpretation applies to binary prices extracted from the options surface, also standardised to a $1 payoff.
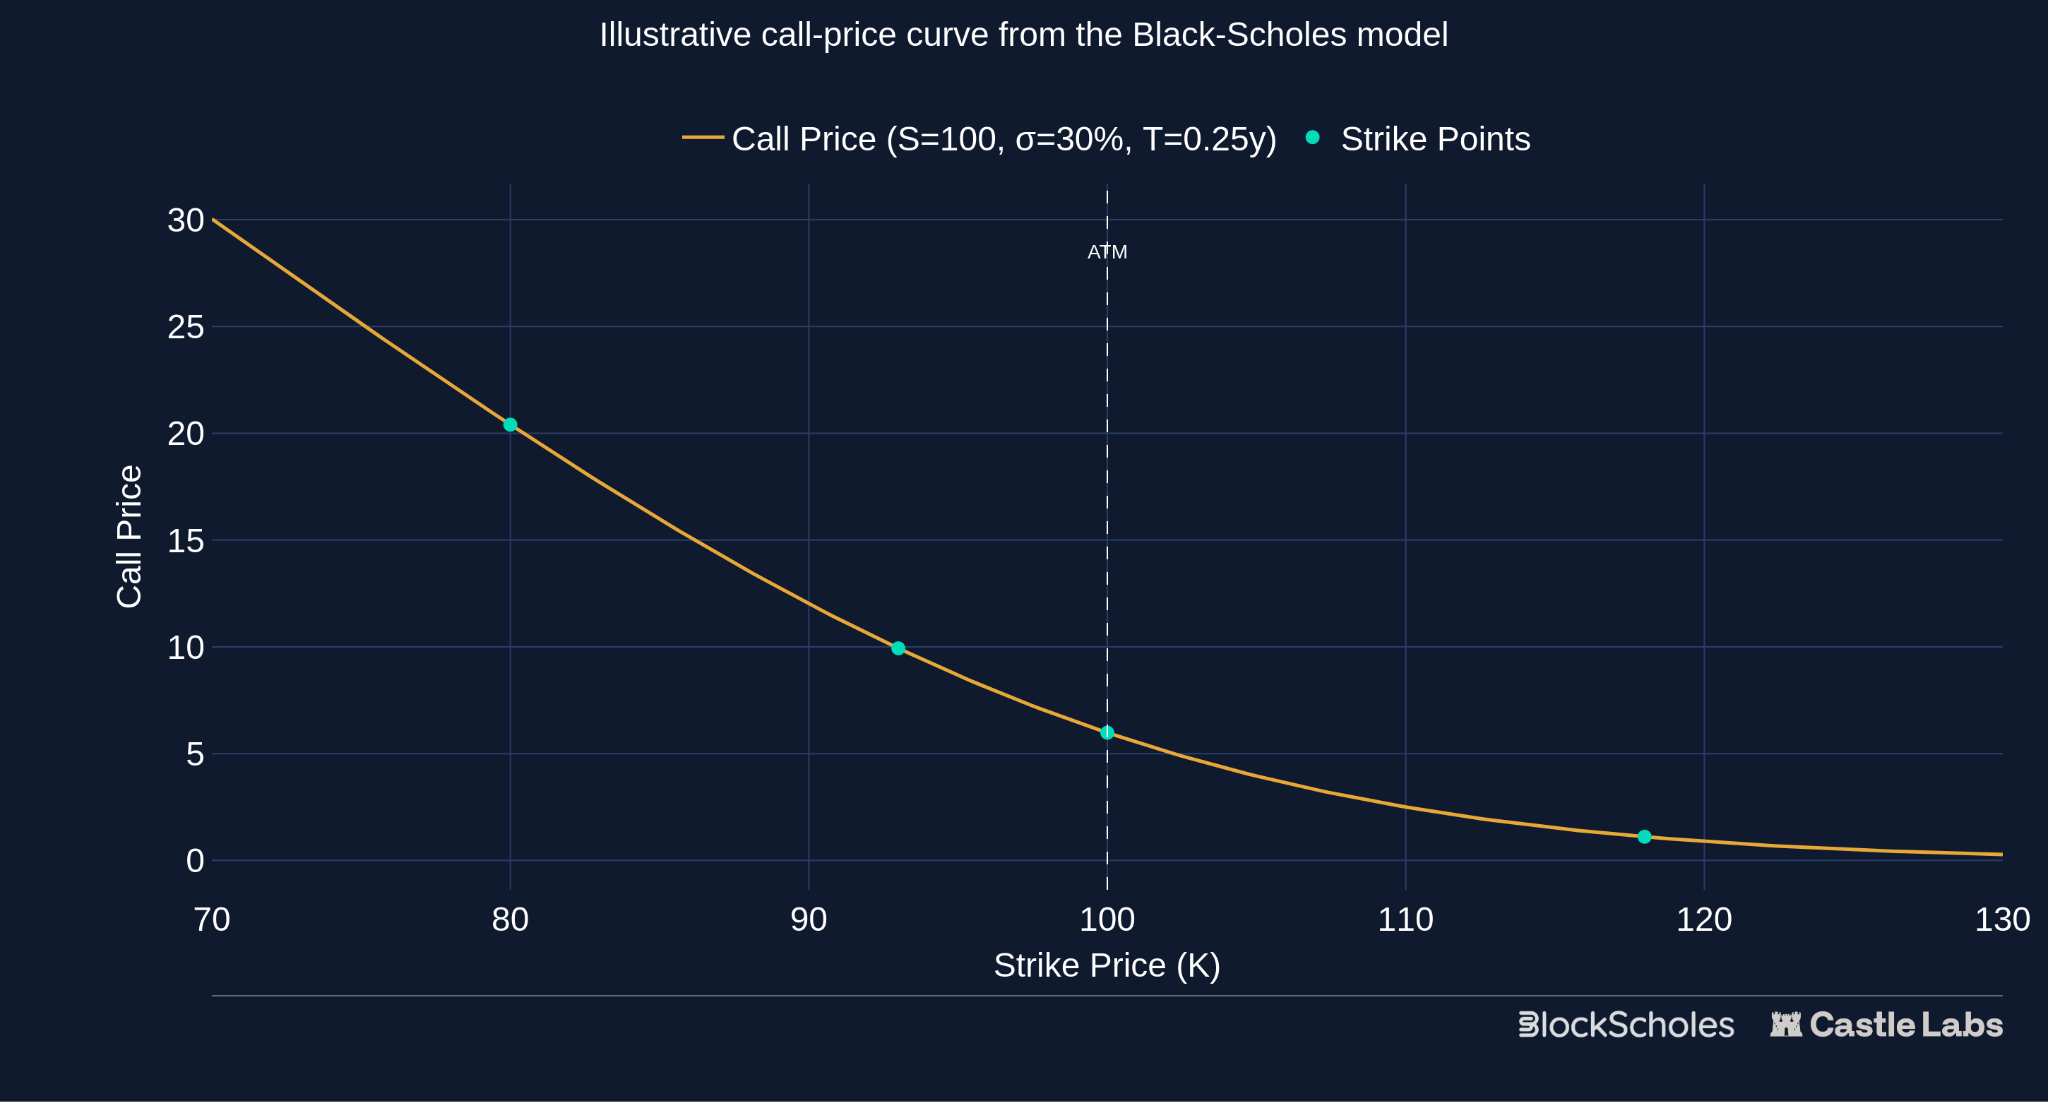
To compare the implied probabilities of prediction markets with those of the options market, we need the implied probabilities for binary options at the same strikes. In real markets, call prices aren’t quoted at every strike: they are listed across a wide range of strikes. Plotting these quoted call prices against their strikes produces this ‘call-price curve’. We extract the equivalent probability from vanilla call option prices, marked as ‘Strike Points’.
When the strike for the binary we want to price sits between quoted calls, we have no prices to plug into the binary price formula, so we must fill in the gaps. This must be done so that the curve’s gradient is smooth and free of sharp kinks. This means fitting a Stochastic Volatility-Inspired (SVI) calibration to the volatility implied by the quoted option prices.
Block Scholes’ composite volatility surface is a continuously constructed and maintained surface which makes it possible to extract the digital probability at any strike and tenor.
What results is a smooth, kink-free curve through the quoted points that ensures no-arbitrage is satisfied along the static volatility smile. If instead the smile were interpolated piecewise linearly, the resulting kinks would cause the implied prices of two binaries on either side of the discontinuity to differ markedly, resulting in a non-unique price for the binary option.
Remember the cost of the spread is the difference in call prices between the two strikes: the slope of the call-price curve across that gap. ‘Squeezing’ together strikes to obtain a binary call payoff means that the binary’s price at any strike is the slope of the call-price curve at that exact point.
A binary’s price is the steepness of the call-price curve at the strike of interest — The steeper the curve at that point, the more expensive the binary.
At low strikes far below the current spot price, the curve is steep, and call prices change almost dollar-for-dollar with the strike, meaning the binary is expensive — close to $1 as there is a high probability of expiring in-the-money.
At high strikes, the curve flattens out as call prices barely change with increases in strike. The binary is cheaper — close to $0 as the market sees low probability of expiring in-the-money.
Now we can interpolate to get the price of a binary option at a specific strike, allowing us to make a straightforward comparison – Polymarket Implied probability vs the Block Scholes surface-implied probability, at the same strikes and tenors:
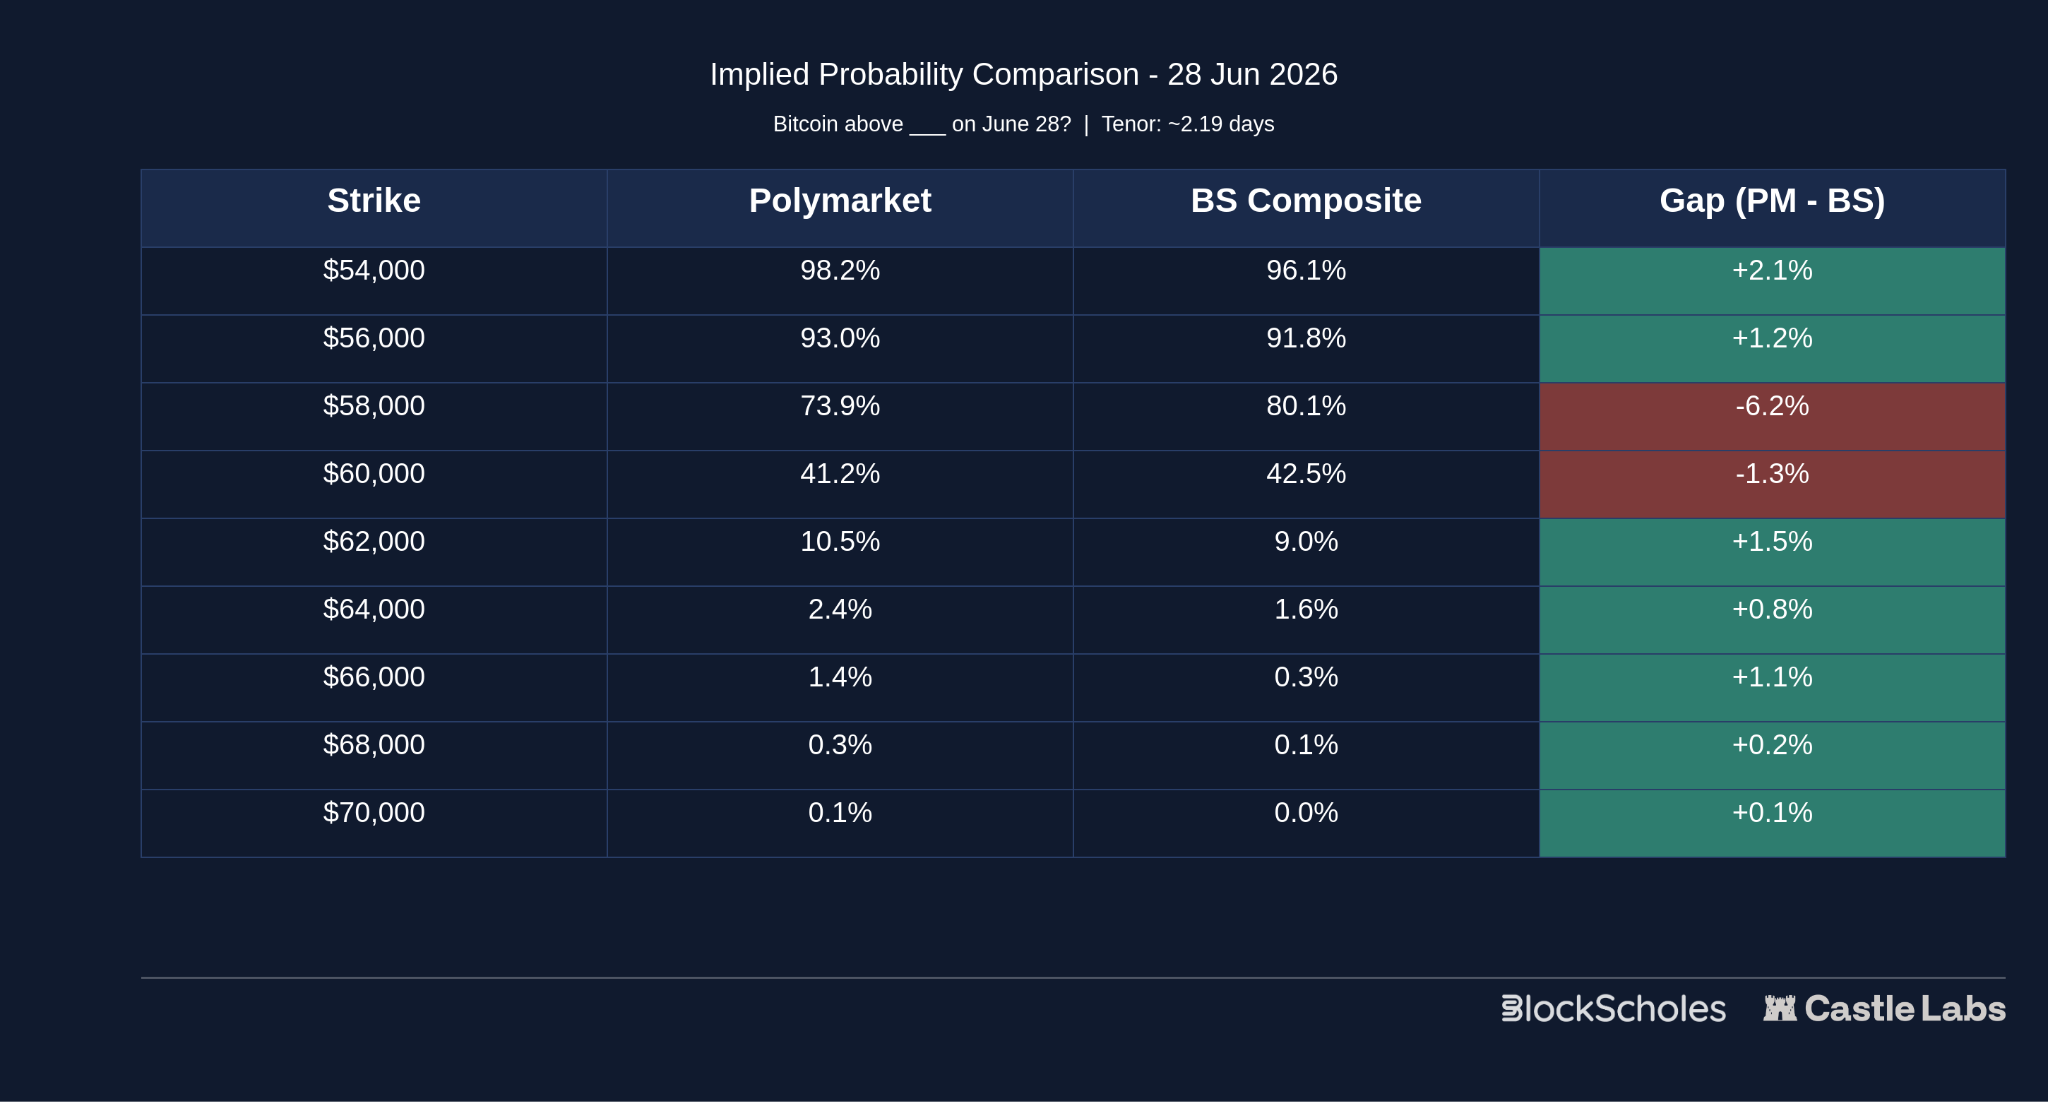
Each row in the table presents the same information, with Polymarket data priced by Polymarket-specific market participants and the Block Scholes column representing the general market probability implied by the Block Scholes composite options surface, calibrated using Block Scholes’ SVI parametrisation. Both datasets are aligned to the same resolution time: 12:00 ET (16:00 UTC) on 28 June 2026.
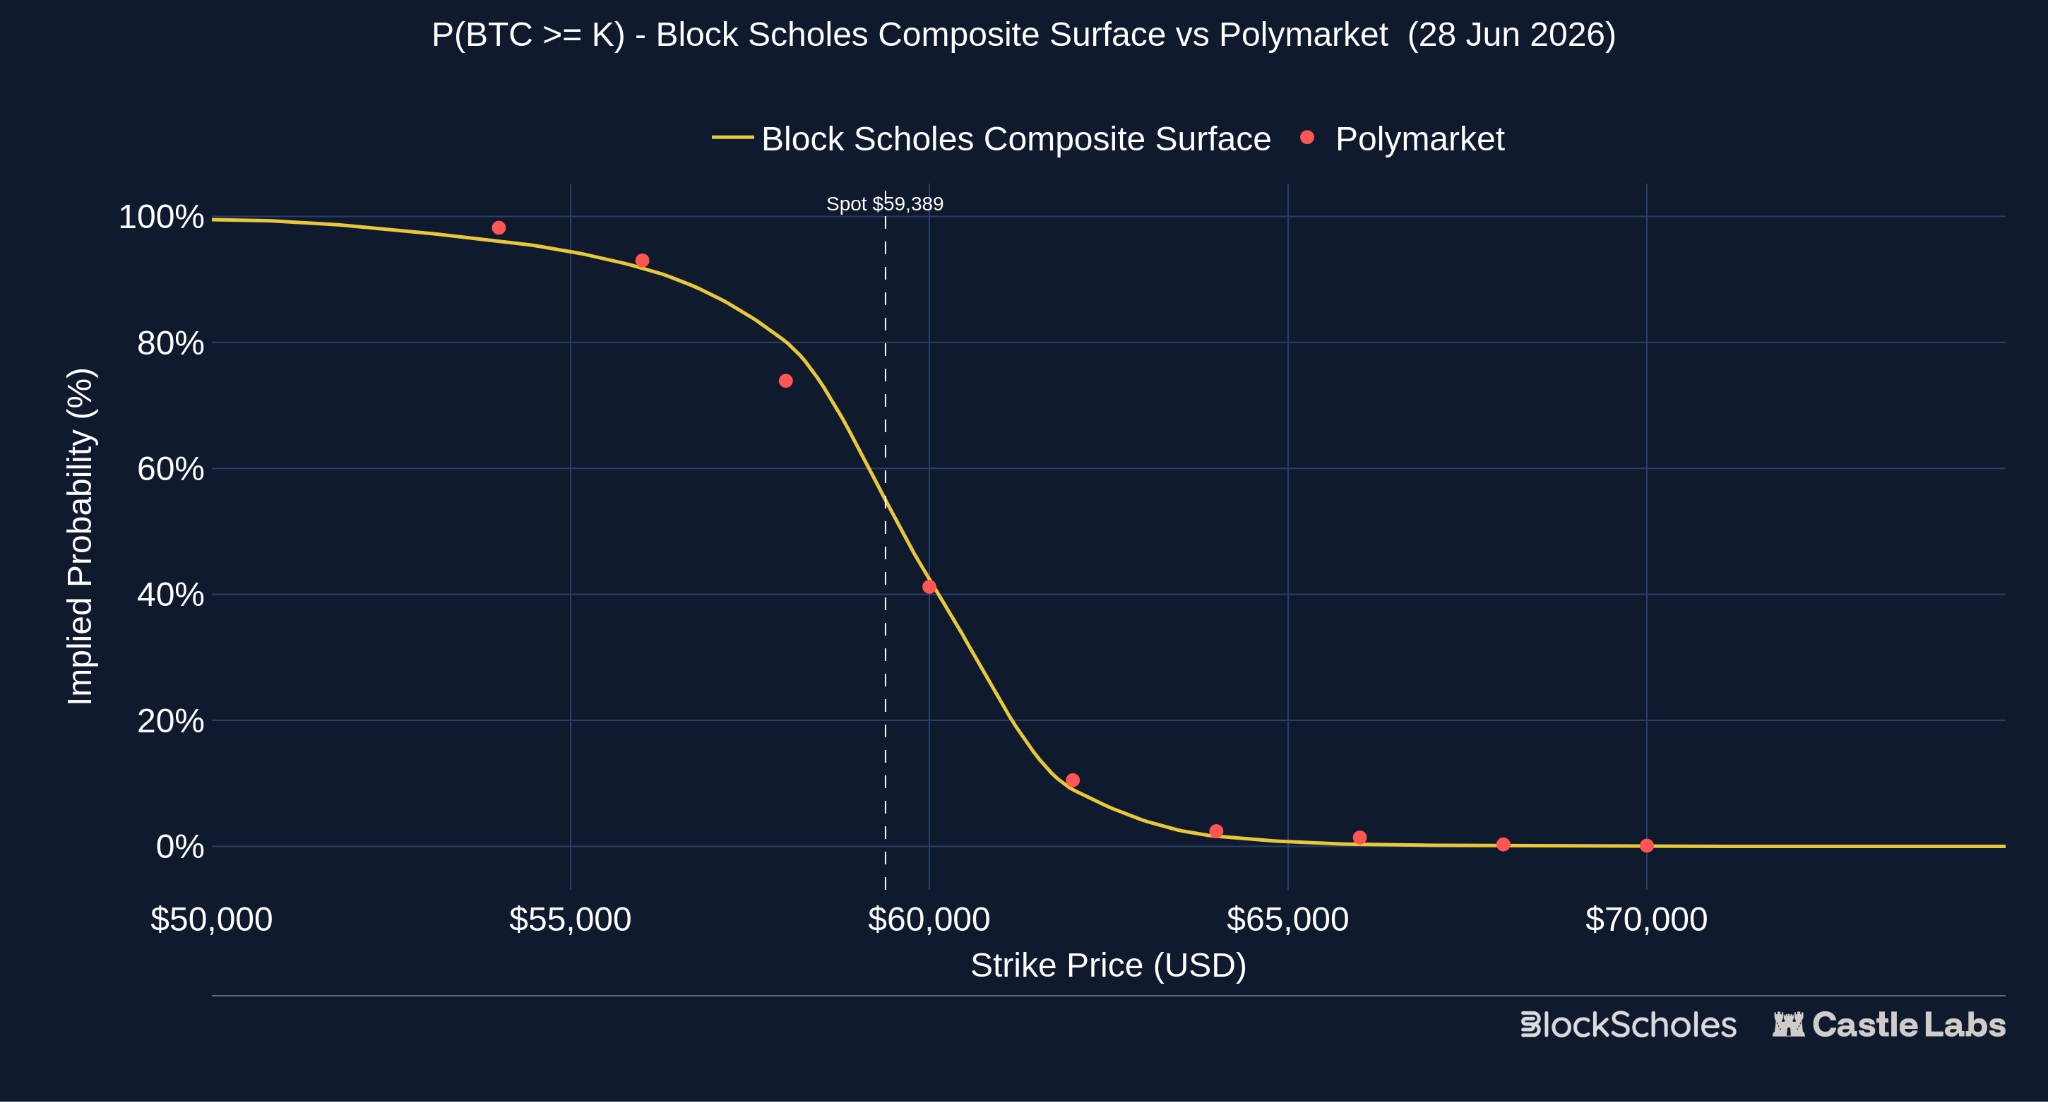
Polymarket and BS_Surface-derived Probability Curve for 2-day expiry
The gap between the two markets is not uniform — some strikes show Polymarket implied probability higher than the composite surface; others lower. The crossing pattern in implied probabilities between the two suggests the disagreement must be reflecting factors outside the instrument mechanisms. This can only be explored with the right tool — Reliable continuous surfaces.
The exercise above touched on a single asset, at a single tenor, at a single timestamp. When broadening the view, many other trends and relationships can be explored with the right tools.
Term structure refers to how a market’s prices behave differently across different expiries, all on the same underlying asset. Each tenor reflects how the market prices uncertainty over that time horizon, and the shape of the prices across those tenors carries lots of information. A prediction-market price for ‘BTC > $60K, with 2 days till expiry ’ can be compared against the options-implied probability at the same strike and tenor for every other tenor that is quoted by both venues. A difference in how the gap behaves across tenors could reveal structural patterns, such as whether disagreement between venues is concentrated in the short end or persists into longer-dated expiries.
BTC is one of many tokens that act as the underlying for prediction markets and vanilla options. For example, ETH, SOL, and XRP have active options surfaces on Deribit and have been used as underlying assets for prediction-market contracts over the past year. Different assets carry different volatility characteristics, with tokens like ETH typically trading with higher implied vol than more mature assets like BTC. Comparing prediction-market vs gaps in the surface across multiple assets can highlight whether a disagreement reflects a characteristic of the underlying asset or a more general insight into how prediction markets and options markets process information.
We’ve established that prediction markets on financial assets (up/down markets) are the same instrument as binary options, but the venues themselves differ. For example, Polymarket and Kalshi are both prediction-market platforms but at times have taken different paths regarding regulation and infrastructure. HIP-4 and DeepBook Predict are newer onchain venues with their own user bases and rules. Identical contracts can attract different audiences, and traders can compare implied probabilities on each venue against a control options-surface benchmark not necessarily to identify ‘correct price’ but to see the different trends that may appear amongst similar venues.
Static snapshots, such as the one used in the exercise above, tell you what is true at one moment. In reality, markets are dynamic. Assessing how the gap at a given strike changes as expiry approaches (whether it widens during high-volatility periods or compresses during calmer periods), and how fast information hits certain venues (FED announcements, onchain hacks). Markets are continuous, and snapshots miss the moves carrying the most information.
The composite surface Block Scholes provides spans a wide range of crypto assets, continuously calibrated across a full tenor grid, not just at specific expiries that happen to be liquid on a given day. For a prediction-market trader, this kind of infrastructure serves as a second reliable opinion, enabling real-time comparisons and assessments as new prediction market contracts are listed.
As pointed out throughout the research, options and prediction markets should not be treated so separately, as they are effectively different interfaces for the same underlying demand: priced conditional outcomes. A covered call, a cash-secured put, a touch option and a five-minute BTC up/down market all package uncertainty into a payoff that can be bought, sold or hedged. The market structure, audience, and language differ, but the core trade remains pricing probability and volatility.
The next phase of onchain volatility markets will be characterised by a multitude of interfaces, not a single product or venue, reflecting different user preferences: some users want income from selling volatility. Some want protection or accumulation. Some want to trade discrete events. Some want a short-dated binary view on price. Some institutions will need to hedge onchain balance sheets. This explains why the current builder map is fragmented.
Part 1 mapped the fragmentation: where activity sits, and how each venue turns volatility into income, protection, leverage or a short-dated bet. Part 2 shone a light underneath it: reading the surface directly revealed a market that has spent 2026 positioned defensively, with downside protection consistently bid over upside, and pinpointed the moments when prediction-market prices and the options surface disagree, as well as how data can support traders across all types of volatility markets.
The onchain layer is starting to develop on both sides: more ways to take a view on volatility as builders continue to experiment with new products, and better infrastructure to price it as data providers improve their offerings. As these sides converge, we will see trading volume rise across onchain options and prediction markets, venues grow more interconnected, support broaden to newly tokenised assets, and teams target new onchain user groups.

.jpg)
.jpg)