Thahbib Rahman
Research Analyst
This week kicked off with a selloff in global bond markets, in part driven by inflationary concerns from the ongoing US-Iran conflict. Government bond yields at multi-decade highs in turn weighed on crypto risk sentiment. BTC briefly fell to $76K, a two-week low, while ETH tested the $2,100 support level. Despite the weakening macro backdrop, BTC has traded with volatility levels close to year-to-date lows, something we see reflected in options positioning too.

This week kicked off with a selloff in global bond markets, in part driven by inflationary concerns from the ongoing US-Iran conflict.
Government bond yields at multi-decade highs in turn weighed on crypto risk sentiment.
BTC briefly fell to $76K, a two-week low, while ETH tested the $2,100 support level.
Despite the weakening macro backdrop, BTC has traded with volatility levels close to year-to-date lows, something we see reflected in options positioning too.
The risk premium priced in by BTC options is near its lowest all year, while 7-day at-the-money ETH implied volatility fell to 37%, its own YTD low last week.
The significantly low ATM implied volatility has occurred alongside an increase in the premium towards put options. Traders are hedging against the potential of a further downside drop in spot prices, yet that panic isn’t being priced in ATM volatility.


Block Scholes’ Risk Appetite Index measures the level of euphoria (above 1) or panic (below -1) in the spot market. Momentum in this index shows a strong relationship to spot returns.
A repricing in risk appetite has seen BTC fall to $76k — a more than two-week low — and ETH fall briefly below the key psychological support level of $2,100.
That downturn in risk sentiment across both crypto spot prices and US equities has occurred against a noticeably more hawkish macro environment.
On the geopolitical front, a peace agreement between the US and Iran remains elusive — both sides have rejected the other’s most recent proposal, though President Trump has so far opted against renewing the US bombing campaign in the region.
Risk sentiment has also drifted lower as the effective shutdown of the Strait of Hormuz begins to take its toll on US consumer inflation.
According to the Bureau of Labor Statistics:

Fears that the energy crisis will continue to spill over into inflation have, among other idiosyncratic drivers, partly contributed to a global selloff in government bonds — pushing yields sharply higher from Japan to the US.
The 10-year US treasury yield — a key benchmark for many consumer loans and mortgages — made a run towards 4.7% in reaching its highest levels since January 2025.
Equally, two-year yields, which closely monitor changes to monetary policy, broke above 4.1%, their highest since February 2025. At the longer-end, 30-year yields are now at their highest since July 2007, which harks back to the eve of the Global Financial Crisis.
Japanese government bonds (JGBs) hit records of their own over the past week.
The 30-year yield has jumped past 4%, an all-time high, while the 10-year JGB yield is at its highest level since 1996.
Markets are also repricing expectations for monetary policy and the potential for rate hikes by central banks, including the Fed, aimed at bringing inflation down. Overnight interest-rate swaps are now almost certain (97.5% chance) of a rate hike by the January 2027 Fed meeting.
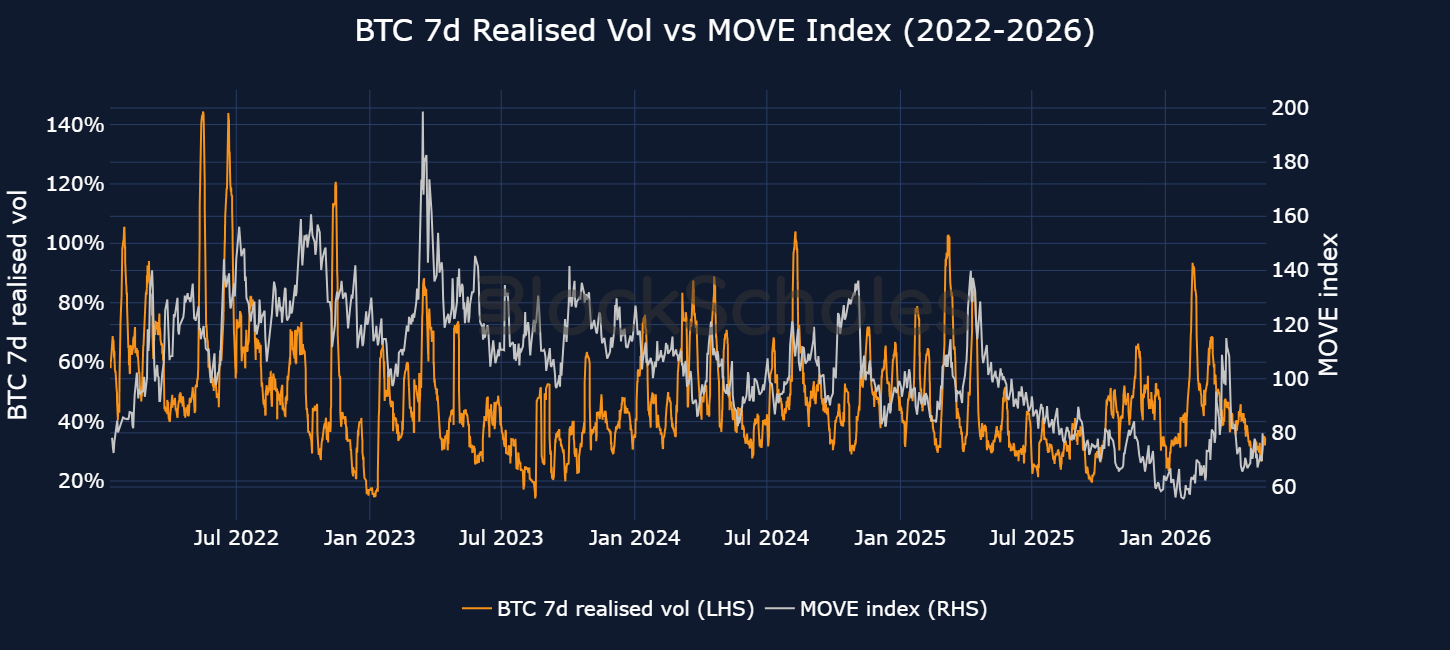
Macro factors remain the primary driver of crypto spot price action and, historically, large spikes in bond-market volatility have coincided with greater volatility in BTC's spot price.
Over the past month, the MOVE Index, which reflects the level of volatility in US Treasury futures, has jumped more than 15%. While not quite at some of the highs we’ve seen earlier in the year, the current low-volatility environment in crypto markets does show a slight dislocation in its relationship to the MOVE Index.
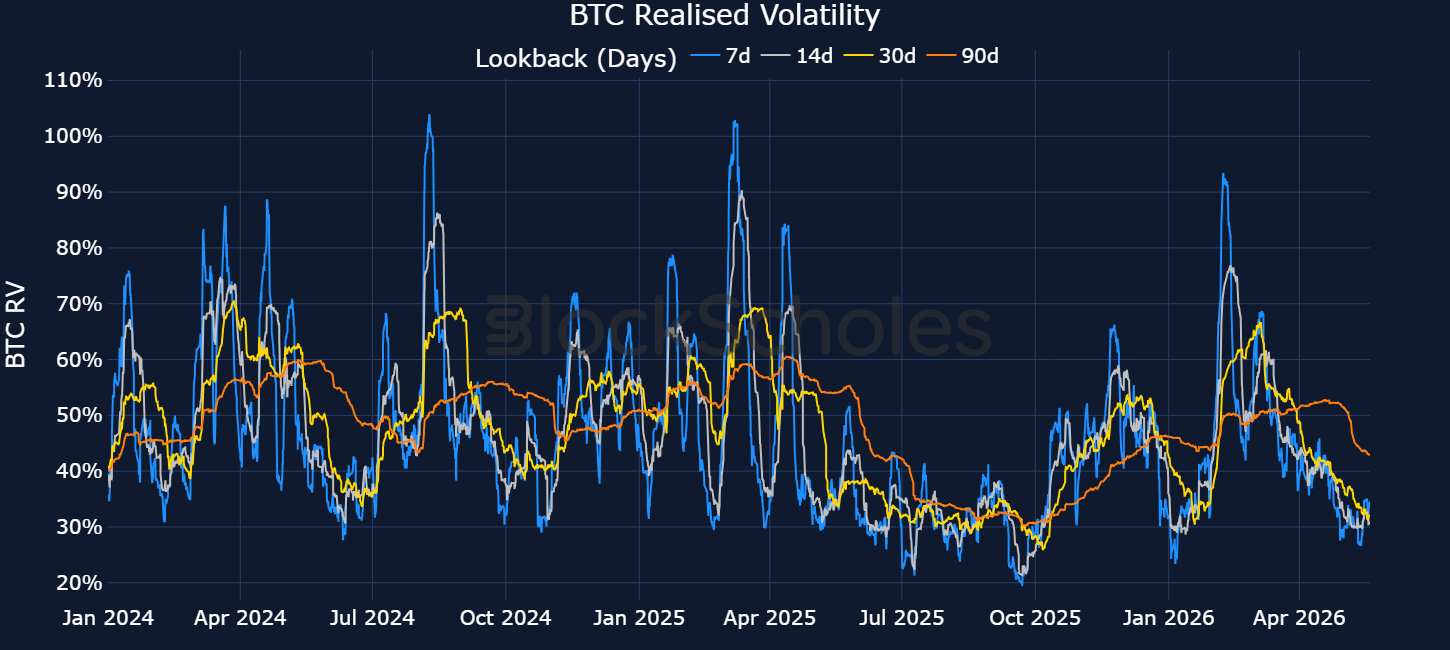
7-day BTC realised volatility is currently close to its year-to-date low, just below 30%, with spot price trading -12% YTD.
The most recent two major breakouts in realised volatility - in early February 2026 and early March 2026 - both coincided with a shift in the macro environment, which makes the current low-vol environment all the more surprising.
On 8 February 2026, 7-day realised volatility spiked to 91% after BTC’s largest single-day drop since the FTX collapse, three days earlier. That selloff occurred against a macro backdrop in which fears over AI valuations drove a sharp pullback in risk assets.
On 6 March 2026, 7-day realised volatility jumped to 69% — a move largely attributed to the start of the US-Iran war in late February.
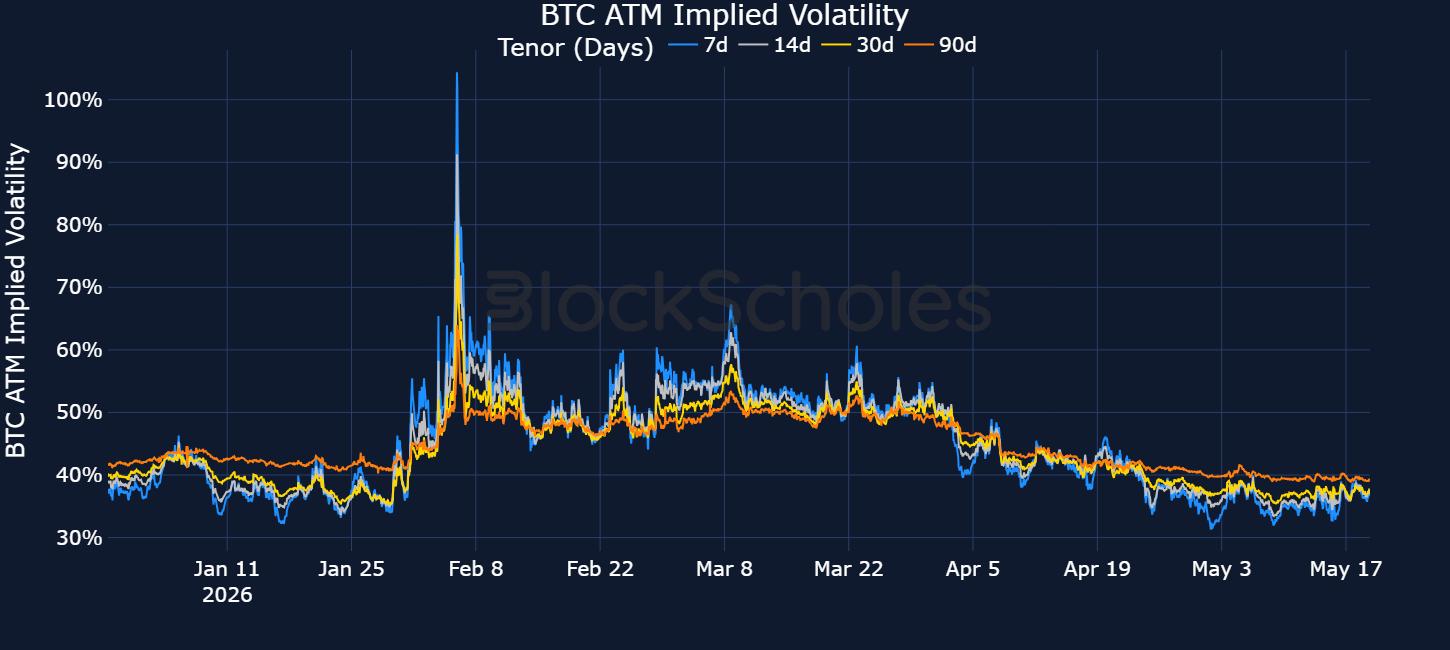
That lack of volatility is also expressed in options markets.
At-the-money implied volatility — a forward-looking view of the volatility traders expect from BTC — is similarly close to its year-to-date low of 30%.
In other words, the risk premium priced in by BTC options is near its lowest all year, despite a macro backdrop with considerable uncertainty.
The low-volatility story is not specific to BTC.
7-day ETH at-the-money implied volatility fell to 37% on 15 May 2026, the lowest level so far this year.
The compression in both BTC's and ETH's 7-day forward-looking volatility expectations has narrowed the spread between the two to its tightest since March 2025: on 15 May 2026, ETH vol was trading only 4.08 percentage points above 7-day BTC vol.
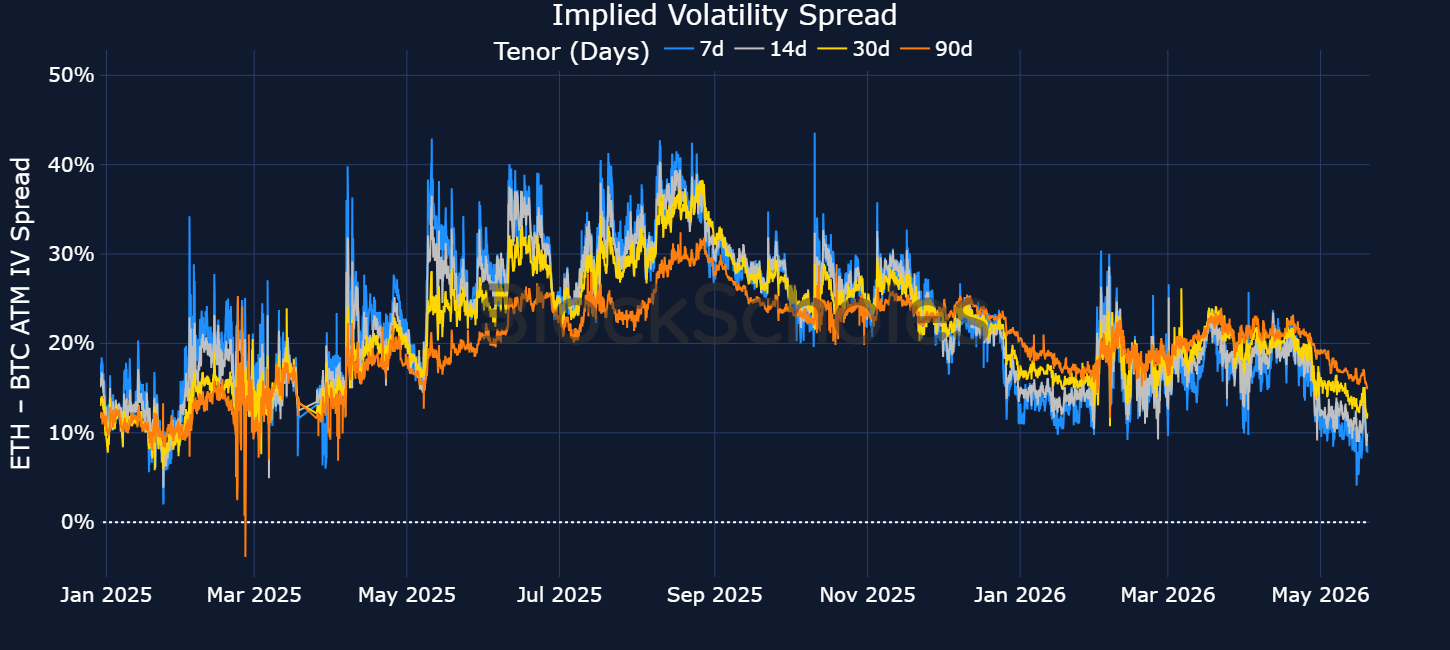
This marks another interesting dislocation.
Over their shared history, ETH volatility has almost always traded at a meaningful premium to BTC volatility — partly a reflection of its higher realised volatility.
For example, since 2024, the median ETH-BTC 7-day ATM IV spread has been 15 vol points. The recent 4.08 pp spread on May 15th therefore sits in the bottom 11th percentile of the distribution.
The surprisingly low BTC and ETH volatility environment becomes more striking when looking at the skew of the volatility smile.
Since the beginning of May, 7-day at-the-money implied volatility for BTC has traded sideways between 33% and 36%, while the 25-delta put-call skew has steepened to the downside from -3% to as low as -7%.
If options traders are nervous about a potential downturn in spot price and are demanding a premium for put options, that is not being reflected in at-the-money implied volatility.
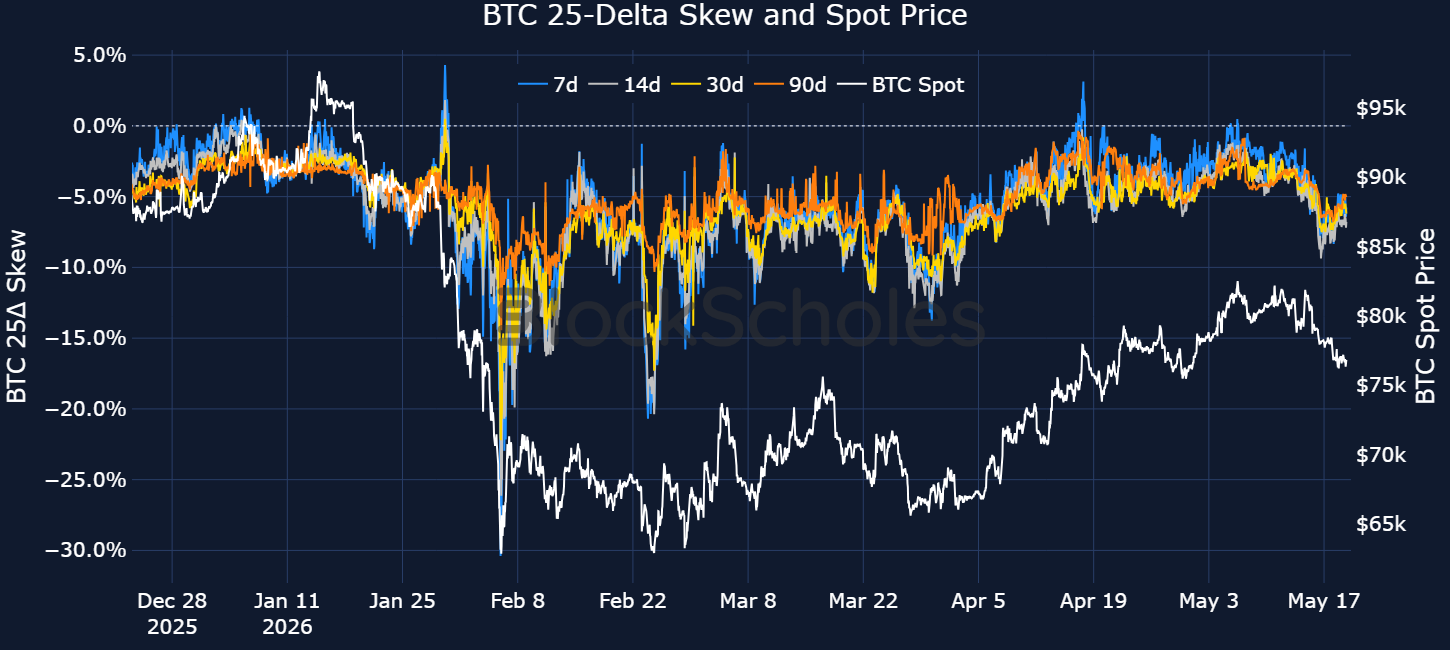
The dislocation between ATM implied volatility and skew suggests either the market realises it could be underpricing volatility expectations and we see options premiums snap higher, or skew reverts closer towards neutral levels.
On the surface, token buybacks are intended to be a mechanical “lower supply equals higher price.” When a protocol or issuer buys back tokens in the open market, it introduces a marginal source of demand while simultaneously reducing circulating supply if those tokens are burned, locked, or otherwise removed from active circulation. All else equal, this should exert upward pressure on the asset’s market price if the buyback is large relative to average daily volume, circulating supply, expected unlocks, future emissions, and insider distributions creating realized supply pressure.
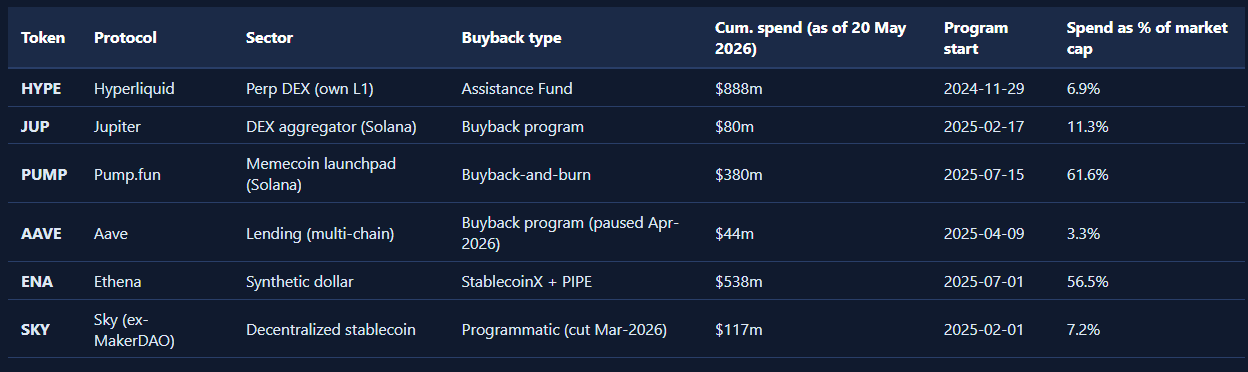
However, not all foundations have implemented token buyback programs equally. The table below shows the difference in size, frequency, and persistence of lockup between a basket of six large market cap token buyback programs.
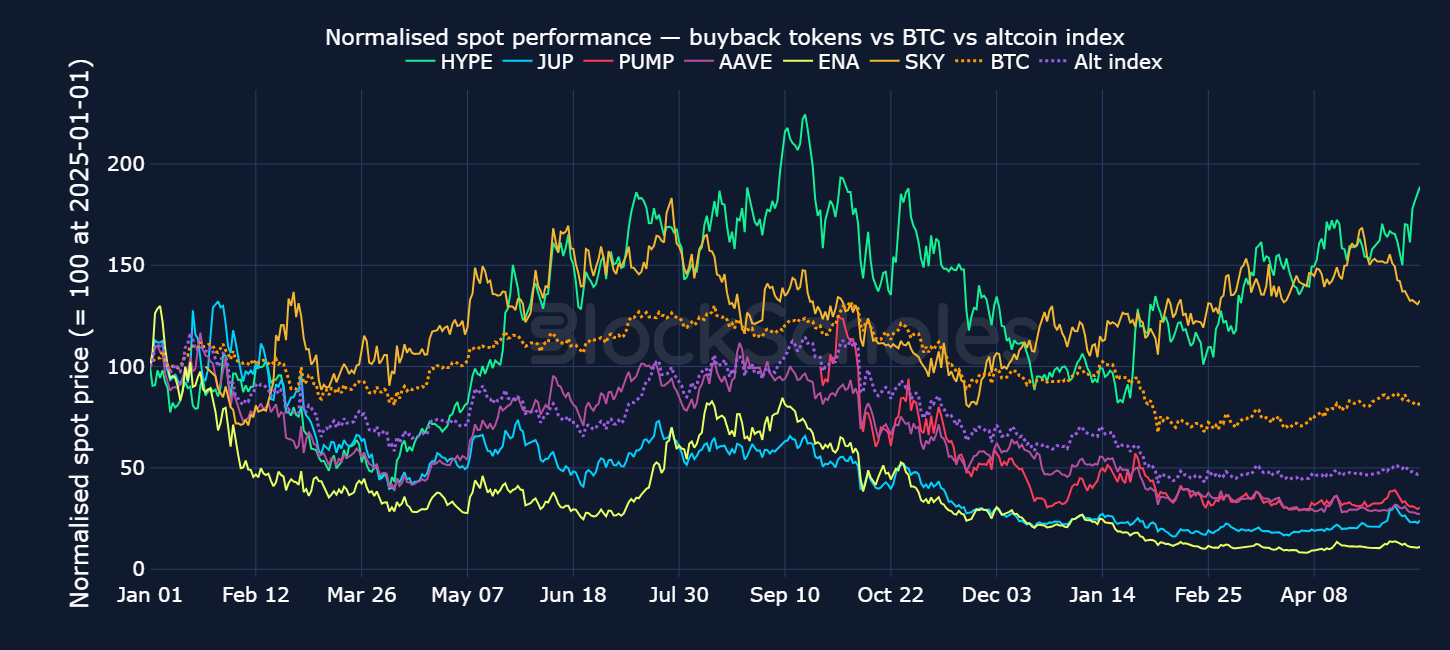
An equal-weighted basket of the above tokens with buyback programs—HYPE, JUP, PUMP, AAVE, ENA, and SKY—would have underperformed the wider market from January 2025 to the present, as seen in the chart below. Although altcoins can and do generate outsized returns at certain points in the cycle, over the same period, BTC has experienced less of a drawdown.
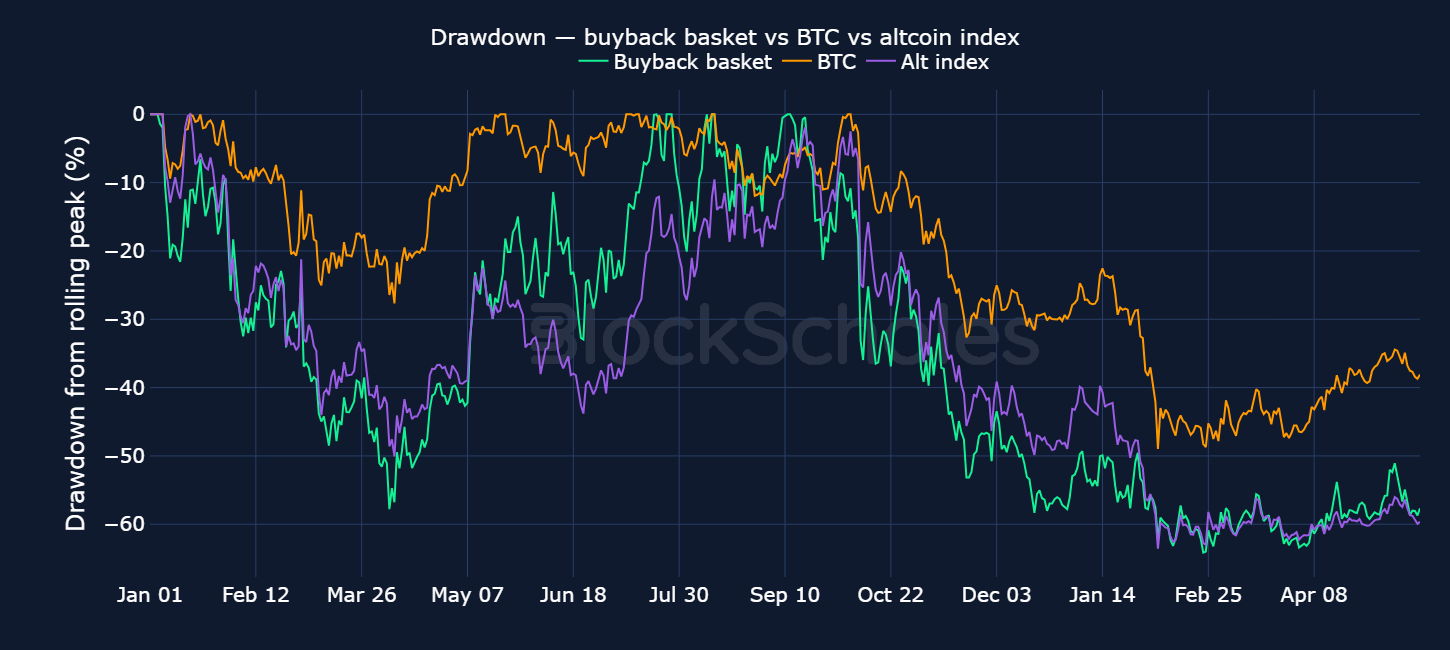
Part of that underperformance relative to BTC over this period is due to wider altcoin underperformance—the basket of buyback tokens and the broader altcoin index also move very much in line with each other, with no clear winner between them. At least so far, and for the “average” program, buyback programs have not been strong enough to buttress altcoins against the wider market.
Although foundations that provide buy pressure in the open market have a positive effect on token price, the empirical impact is much more nuanced. Buybacks are not the only determinant of token price; market conditions and token-specific narratives can outweigh the impact. In fact, with the exception of AAVE, none of these tokens recorded a rally immediately following their buyback start date.
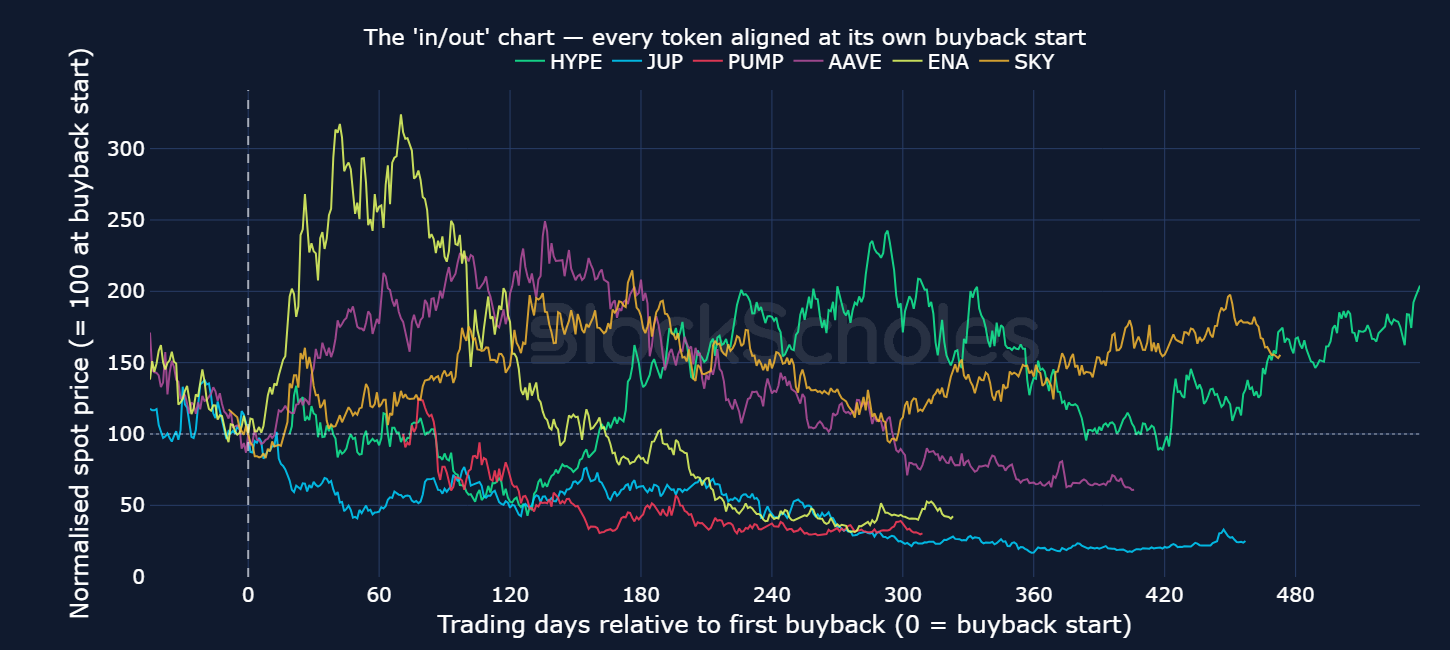
The longest lasting buyback program is also the best performing – that of Hyperliquid’s native token HYPE. As seen in the chart below, HYPE has outperformed the broader crypto market over the period since January 2025, delivering a nearly 80% gain despite a wider market drawdown.
In practice, Hyperliquid’s HYPE buyback can be understood as a volume-linked revenue-recycling trade: almost all of the exchange’s trading-fee revenue (reportedly in the 97–99% range) is routed to the protocol’s Assistance Fund, where it is used to purchase HYPE on the open market. The accumulated HYPE is then treated economically like burned supply, as it sits in a system address with no private key. As a result, strong protocol performance, reflected in recent reports of record trading volumes, has a twofold impact: it strengthens positive sentiment around the protocol while also applying meaningful protocol buying pressure on the token through the buyback mechanism.

As seen in the chart above, HYPE has seen one of the largest cumulative buyback spends to date, at around $888M. This is equivalent to around 9% of its estimated $12.15B market cap, as shown in the chart below. In comparison, PUMP’s cumulative buybacks are on a much larger scale relative to its market cap, at around 60% of its smaller estimated market cap of roughly $960M. Yet, this has not translated directly into token outperformance.
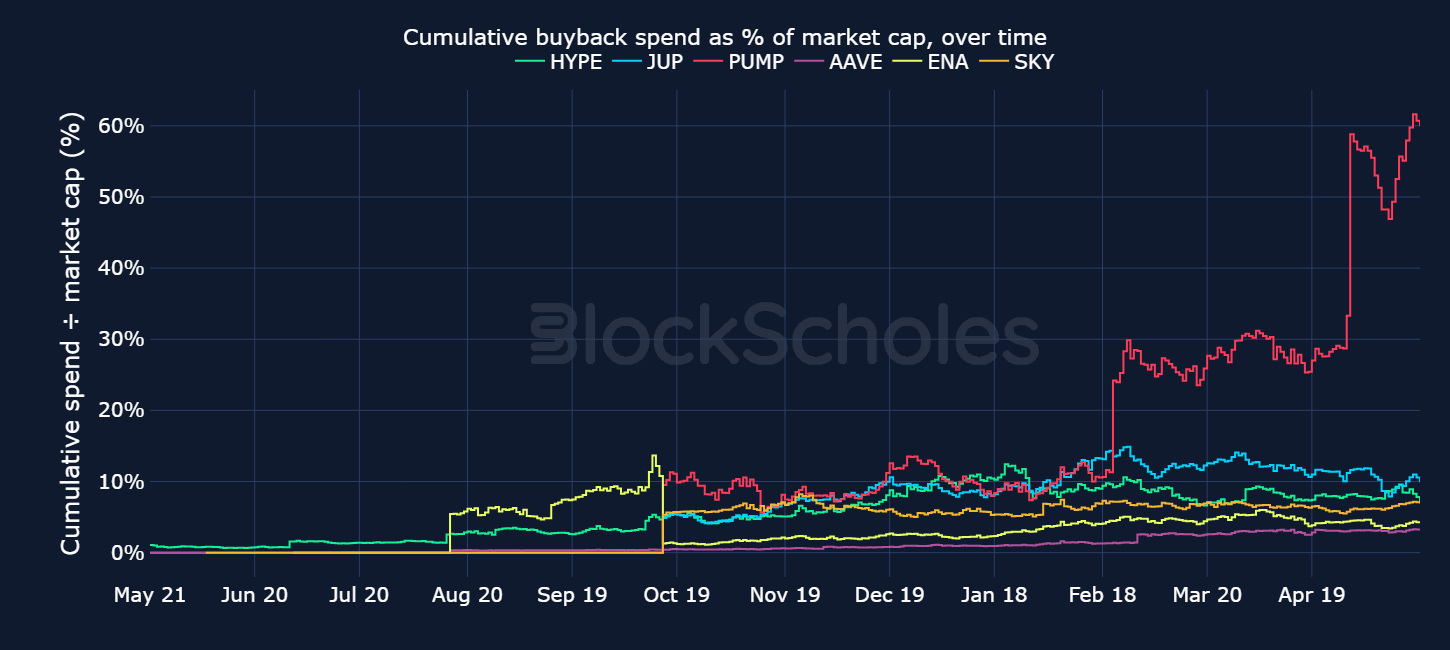
HYPE’s outperformance among tokens with buyback programs shows that buybacks can materially support token price when they are transparent, recurring, and directly tied to the economics of a profitable protocol.
1) Tokenised equities reached a new daily trading volume record of $3.57B on Monday.
According to the data, activity across tokenised equity products has accelerated since the beginning of the year, with trading volumes rising steadily into the latest all-time high.
2) A new White House executive order published on May 19, 2026, has directed the “Federal financial regulators” (which includes the SEC, CFTC, FDIC, OCC, CFPB, and NCUA) to review and remove regulatory barriers limiting fintech and digital asset firms from integrating with traditional banking and payment infrastructure, including partnerships with federally regulated institutions.
The order specifically requests that the Federal Reserve evaluate whether uninsured banks, crypto firms, and other non-bank financial companies can receive direct access to Federal Reserve payment accounts and real-time payment systems, alongside potential legal or legislative changes required to enable such access.
3) Polymarket has launched prediction markets tied to private company milestones and performance, allowing users to trade on events such as valuation thresholds, IPO timing, and secondary market activity using data supplied by Nasdaq Private Market.
Nasdaq Private Market, a provider of private-market liquidity and investment infrastructure, will act as the official resolution data provider, supplying transaction and pricing data used to settle the markets and anchor them to institutional-grade private market activity.
4) Yorkville America, the investment adviser behind the Truth Social Funds, said it has withdrawn several ETF filings under the Securities Act of 1933 in favor of launching future products under the Investment Company Act of 1940 framework instead.
The firm said the ’40 Act structure offers greater flexibility for developing differentiated and rules-based ETF strategies, alongside enhanced investor protections, broader brokerage and retirement account accessibility, and expanded institutional distribution capabilities.
5) South Carolina Governor Henry McMaster has signed S.163 into law, establishing a state-level crypto framework in South Carolina, including protections for self-custody, blockchain nodes, staking, mining, and digital asset payments.
The legislation prohibits state authorities from accepting or requiring central bank digital currencies (CBDCs), bars participation in Federal Reserve CBDC pilot programs, and prevents digital assets from being subjected to discriminatory taxation compared with U.S. legal tender.
6) The SEC is expected to release its “innovation exemption” for tokenized stocks as soon as this week, creating a new framework for trading digital versions of publicly listed securities, according to Bloomberg.
The framework would create a simplified regulatory pathway for tokenized stock trading, potentially allowing approved platforms to issue and trade digital representations of equities without each initiative going through the full registration process.
Rather than immediately authorising 24/7 or DeFi-based stock trading, the exemption would mark a step towards regulated experimentation in tokenized equities.
7) Bitwise said it will allocate 10% of management fees generated from its new Bitwise Hyperliquid ETF (NYSE: BHYP) toward holding HYPE on its corporate balance sheet.
Bitwise said the move reflects Hyperliquid’s own community-aligned structure, in which roughly 99% of protocol revenue is used to buy and burn HYPE, directly linking platform growth to tokenholder value accrual and supply reduction.
8) Revolut has launched its first physical crypto payment card, featuring a Dogecoin-theme, LED tap-to-pay functionality, and support for spending crypto anywhere Visa and Mastercard are accepted across the UK and most EEA markets.
The card converts crypto at the point of transaction, with payments treated as taxable crypto disposals in some jurisdictions, while exchange-rate and fair-usage fees may apply depending on the user’s subscription tier.
9) 21Shares’ Hyperliquid ETF recorded its strongest session since launch on Thursday, with $8.1M in trading volume and roughly $4.9M in net inflows.
The HYPE token later eased from its highs but remained up around 8% over the past 24 hours, trading near $43.63 on Friday morning.
10) Verus, a privacy-focused blockchain using a hybrid proof-of-work and proof-of-stake consensus model, has faced an exploit targeting its Ethereum bridge, the cross-chain infrastructure that allows assets to move between the Verus and Ethereum networks, with losses reaching roughly $11.6M according to Blockaid and PeckShield.
Blockchain security firms said the attacker drained 103.6 tBTC, 1,625 ETH, and 147,000 USDC before swapping the assets into roughly 5,402 ETH, while the attacker’s wallet was reportedly seeded with 1 ETH through Tornado Cash prior to the exploit.
11) Capital B (Euronext Growth Paris: ALCPB, OTC: CPTLF), which brands itself as Europe’s first “Bitcoin Treasury Company,” confirmed the acquisition of 192 BTC for €13M, bringing total holdings to 3,135 BTC acquired at an average price of €90,451 per bitcoin and a total acquisition value of €283.6M.
The purchases were funded through multiple capital raises, including a €15.2M private placement backed by institutional investors Adam Back and TOBAM, alongside an additional €1.1M warrant financing and €0.85 million raised through an ATM-style equity issuance program.
12) Bit Digital (NASDAQ: BTBT), a crypto infrastructure company focused on Ethereum treasury strategies and AI infrastructure through its majority ownership in WhiteFiber (NASDAQ: WYFI), reported Q1 2026 revenue of $27.9M and held 155,444 ETH worth approximately $327M at quarter-end while continuing to shift capital allocation away from bitcoin mining.
The company generated $2.3M in ETH staking revenue and disclosed that around 70,000 ETH had been repositioned into liquid-staked ETH products to improve treasury flexibility, while roughly 60,677 ETH remained natively staked as of April 30.
13) DeFi Development Corp. (NASDAQ: DFDV), a publicly traded company focused on accumulating and compounding Solana as a treasury asset, reported a SOL-per-share (SPS) of 0.0670 as of May 13, up 108% year-on-year, while reaffirming a June 2026 target of 0.075 SPS and a long-term goal of 1.0 SPS by the end of 2028.
The company disclosed holdings of 2.29M SOL and SOL equivalents, up 3% since March, while continuing to expand validator operations, staking infrastructure, treasury deployment strategies, and Solana ecosystem partnerships as part of its broader on-chain yield and treasury model.
14) Nakamoto (NASDAQ: NAKA), a bitcoin treasury and former healthcare company, has announced that its Q1 2026 results reflect its shift into a Bitcoin-focused operating business after acquiring BTC Inc. and UTXO Management in February.
The company published that revenue reached $2.7M, including $1.1M from its Bitcoin treasury and derivatives strategy, while its BTC holdings exceeded 5,000 coins with a quarter-end value of about $345M.
15) Fidelity International, a global asset manager with more than $1T in assets under management, has launched its first tokenised money market fund, FILQ, with Moody’s assigning the Ethereum-based vehicle a top-tier AAA-mf rating similar to traditional institutional liquidity funds.
FILQ is structured as an on-chain version of Fidelity’s existing $7B Irish-domiciled LVNAV fund and uses Sygnum’s tokenisation infrastructure and Chainlink oracle feeds sourcing NAV data from JPMorgan to support 24/7 subscriptions and redemptions via stablecoins.
The ERC-20 fund invests in highly rated government securities and is designed to provide institutional investors with blockchain-native cash management and settlement infrastructure, while Sygnum manages KYC, AML, token issuance, and smart contract-enabled settlement flows.
16) Morgan Stanley has begun a pilot rollout of spot cryptocurrency trading on its E*Trade retail brokerage platform, according to Bloomberg.
The pilot introduces a 50-basis-point transaction fee on the dollar value of each crypto trade.
The service is currently live for a limited group of users, with broader access for E*Trade’s 8.6M clients expected later this year.
17) BNY is expanding its digital asset custody business into the United Arab Emirates through new partnerships with Finstreet and ADI Foundation.
The bank said the collaboration will focus on delivering institutional-grade crypto custody services within the Abu Dhabi Global Market.
The initial offering will support custody for Bitcoin and Ether on behalf of Finstreet’s clients.
BNY, Finstreet and ADI Foundation also plan to explore further integration with ADI Foundation’s blockchain infrastructure.
The Latest Listings - CBRSUSDT
Cerebras Systems is a publicly traded, US-based AI infrastructure company focused on purpose-built computing systems for advanced artificial intelligence workloads.
Its technology is designed to support the growing compute requirements of large-scale model training, real-time inference and enterprise AI deployment.
The company is best known for its wafer-scale computing architecture.
Unlike conventional AI infrastructure, which typically depends on clusters of graphics processing units connected across multiple servers, Cerebras has developed the Wafer-Scale Engine — a large-format AI processor that integrates substantial compute and memory resources onto a single wafer.
This approach is intended to reduce communication, latency and efficiency constraints that can arise when workloads are distributed across many separate chips.
Cerebras provides a full-stack AI compute platform, including processors, complete systems, software and cloud-accessible compute services, allowing customers to access high-performance AI infrastructure without building and managing complex GPU clusters independently.
Its systems are used across AI training and inference.
Training involves developing and optimising large models, while inference refers to the real-time deployment of those models in applications such as generative AI, enterprise automation, research, search, coding tools and AI agents.
As AI adoption broadens, inference is becoming a larger and more commercially important component of compute demand.
Cerebras operates in a competitive market led by Nvidia, while major cloud providers are also investing heavily in proprietary silicon. Its differentiation comes from offering an alternative architecture at a time when demand for AI compute continues to expand across model developers, cloud platforms, enterprises and research organisations.
The company’s prospects are linked to AI capital expenditure, large-model development, inference growth and broader investment across the AI compute supply chain. At the same time, it operates in a capital-intensive sector and faces execution risk, customer concentration risk and competition from larger semiconductor and cloud infrastructure providers.
Cerebras Systems is therefore notable as a publicly traded specialist in AI compute, with a distinct wafer-scale architecture and exposure to one of the most important infrastructure themes in technology markets.
Open interest and trading volume data are sourced “as is” from the Bybit exchange platform API exclusively, and as such do not represent a comprehensive picture of the sum of trading activity across all derivatives markets or exchanges. The data visualised in this report consists of hourly and daily snapshots, recorded over the previous 30 days. Daily (hourly) snapshots of trade volume record the total sum of the notional value of trades recorded in the 24H (1 hour) period, beginning with the snapshot timestamp.
If not explicitly labelled as derived from another exchange, the input instrument prices to all derivatives analytics metrics in this report are sourced from the appropriate endpoints of Bybit’s public exchange platform API. In the event that data is labelled or referred to as representing the market on another exchange source, that data is sourced from the appropriate endpoint of each respective exchange’s public API.
Macroeconomic charts and data are sourced “as is” from the Bloomberg Terminal. Exchange data is sourced “as is” from publicly available exchange APIs. Block Scholes makes no claims about the veracity of public third-party data.
After acquisition of underlying-denominated raw data for open interest and trading volume on the Bybit exchange platform from Bybit’s API endpoint, equivalent dollar-denominated figures are calculated using the concurrent value of Block Scholes’ Spot Index for the relevant underlying asset.
Block Scholes’s Spot Index represents the aggregate Spot mid-price for a given currency across the top five CEXs by volume (with USD-quoted markets). It considers the proportion of total volume in the instrument on the exchange, as well as the deviation of a data point from those on other exchanges.
Futures prices are used for Block Scholes’s futures-implied yields calculation services in order to derive the constant-tenor annualised yields displayed in the Futures section of this report.
Options prices are used for Block Scholes’s implied volatility calculation services in order to calibrate volatility surfaces, from which all derivatives volatility analytics displayed in the BTC Options and ETH Options sections of this report are calculated. Volatility smiles are constructed by calibrating to mid-market prices observed in Bybit options markets. As part of the calibration process, prices go through rigorous filtration and cleaning steps, which ensures that the resulting volatility surface is arbitrage-free and has exceptional fit to the market observables.


.jpg)
.jpg)