
Thahbib Rahman
Research Analyst
This week's edition of our Market Sentiment Report.

After rallying up past $87K, BTC has joined US stocks lower as a rebound in oil prices and higher US treasury yields sap risk sentiment. Five-year, ten-year and thirty-year Treasury yields are all flirting with levels last reached back in 2007 while federal funds futures pricing indicate a 73% probability for an additional rate hike in October.
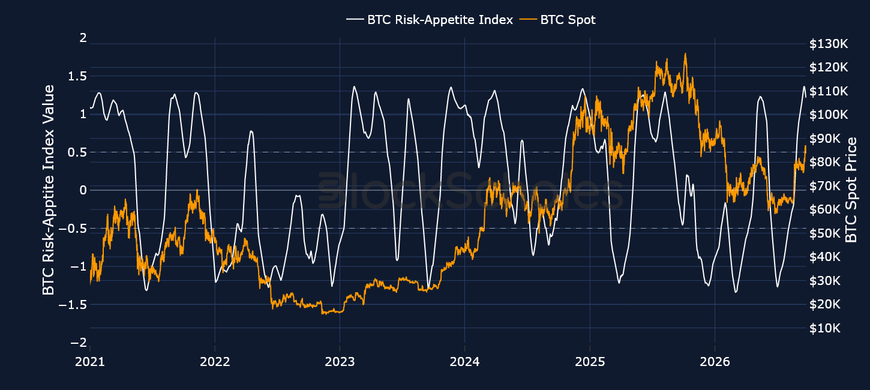
Figure 1. Block Scholes BTC Risk-Appetite Index (white, left axis) against the BTC spot price (right axis). Source: Block Scholes.
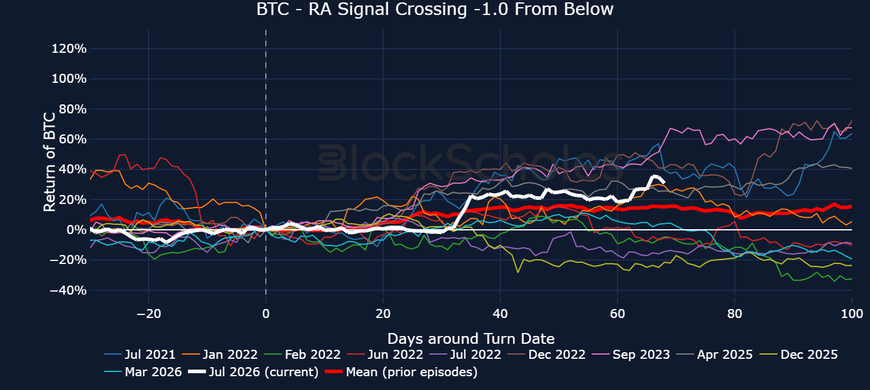
Figure 2. BTC spot returns in the days around each time the BTC Risk-Appetite Index crossed up through -1.0, with the current episode in white and the mean of prior episodes in red. Source: Block Scholes.
Like BTC, ETH also sold off over the past 24 hours, down close to 2% as risk-assets across the board take a breather. Spot Ethereum ETFs however, have continued their run of inflows, recording four consecutive days of net positive flows.
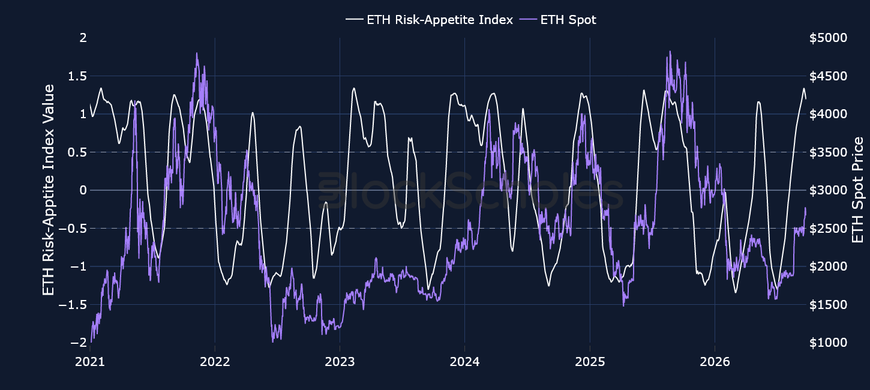
Figure 3. Block Scholes ETH Risk-Appetite Index (white, left axis) against the ETH spot price (right axis). Source: Block Scholes.
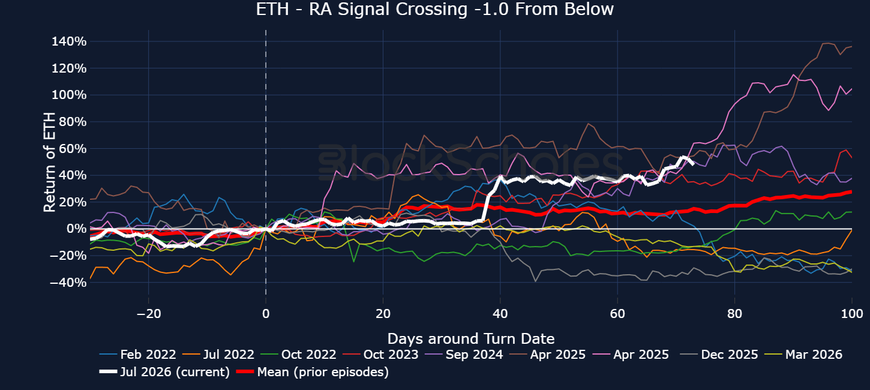
Figure 4. ETH spot returns in the days around each time the ETH Risk-Appetite Index crossed up through -1.0, with the current episode in white and the mean of prior episodes in red. Source: Block Scholes.
Data behind Risk Appetite charts: BlockScholes BTC/ETH/ SOL/ SUI/ XRP composite spot index price. Available via the BlockScholes REST API.
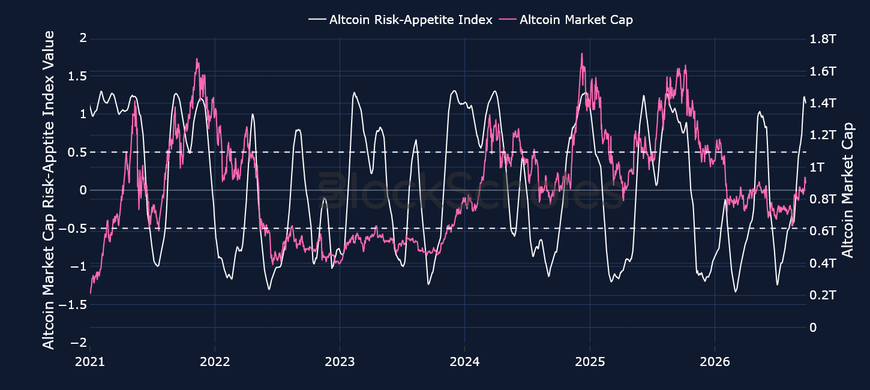
Figure 5. Block Scholes Altcoin Risk-Appetite Index (white, left axis) against altcoin market capitalisation (right axis). Source: Block Scholes.
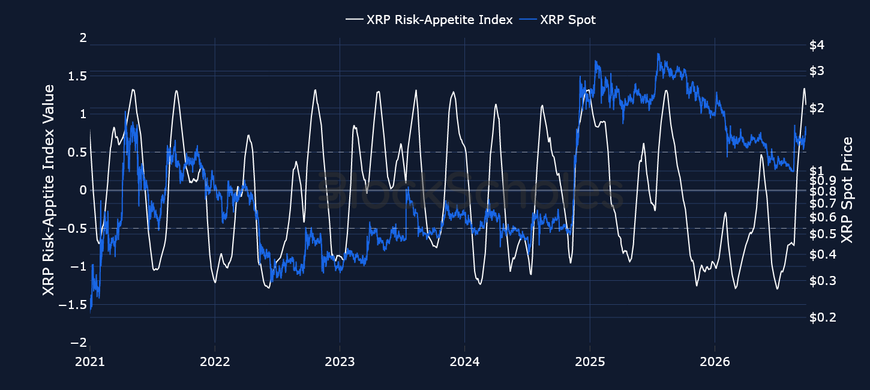
Figure 6. Block Scholes XRP Risk-Appetite Index (white, left axis) against the XRP spot price (right axis). Source: Block Scholes.
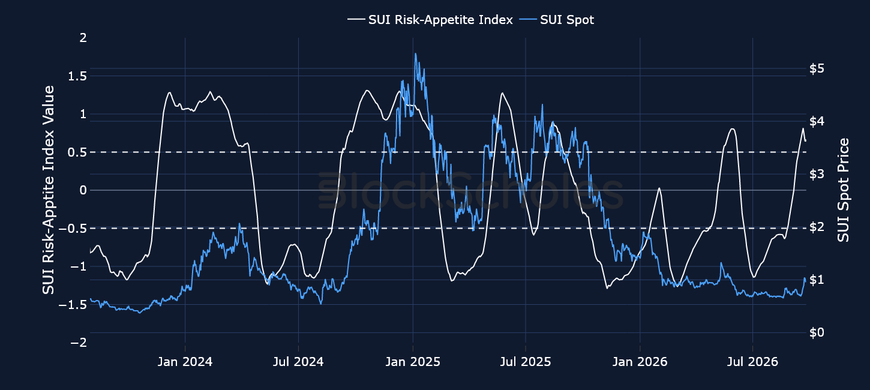
Figure 7. Block Scholes SUI Risk-Appetite Index (white, left axis) against the SUI spot price (right axis). Source: Block Scholes.
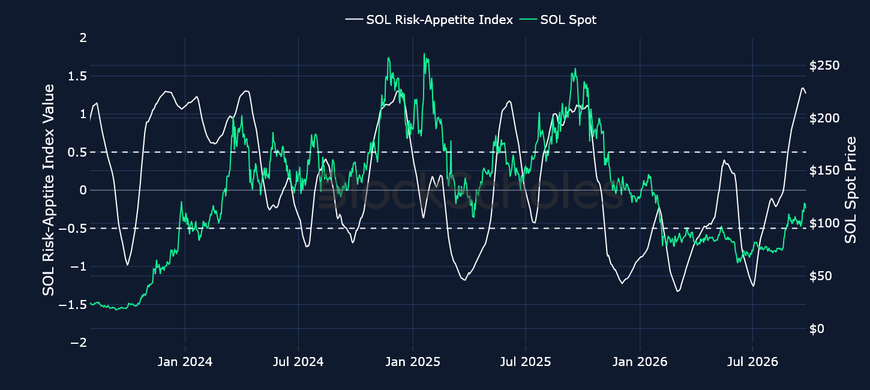
Figure 8. Block Scholes SOL Risk-Appetite Index (white, left axis) against the SOL spot price (right axis). Source: Block Scholes.