
Tazmina Rashid
Research Analyst
This week's edition of our Crypto Altcoins Analytics.


Figure 1. Bitcoin's market capitalisation as a share of the total crypto market capitalisation. Source: SoSoValue, CoinGecko, Block Scholes.

Figure 2. Market capitalisation of altcoins, excluding BTC and stablecoins, as a share of the total crypto market capitalisation. Source: SoSoValue, CoinGecko, Block Scholes.

Figure 3. Share of the top-50 altcoins (current constituents) whose trailing 90-day return beats BTC's; slow-moving by construction. Source: CoinGecko, Block Scholes.

Figure 4. Percentage drawdown from each asset's all-time high for BTC and the top-20 altcoins by market cap. Source: CoinGecko, Block Scholes.

Figure 5. ETH spot price denominated in BTC (the ETH/BTC cross). Source: CoinGecko, Block Scholes.

Figure 6. SOL spot price denominated in BTC (the SOL/BTC cross). Source: CoinGecko, Block Scholes.

Figure 7. XRP spot price denominated in BTC (the XRP/BTC cross). Source: CoinGecko, Block Scholes.

Figure 8. BNB spot price denominated in BTC (the BNB/BTC cross). Source: CoinGecko, Block Scholes.

Figure 9. Daily simple return of each tracked altcoin minus BTC's daily return. Source: CoinGecko, Block Scholes.

Figure 10. Rolling 30-day correlation of each altcoin's daily returns with BTC's. Source: CoinGecko, Block Scholes.

Figure 11. Rolling 30-day beta of each altcoin's daily returns to BTC's. Source: CoinGecko, Block Scholes.

Figure 12. Daily simple return of ETH minus BTC's daily return. Source: CoinGecko, Block Scholes.

Figure 13. Daily simple return of SOL minus BTC's daily return. Source: CoinGecko, Block Scholes.

Figure 14. Daily simple return of XRP minus BTC's daily return. Source: CoinGecko, Block Scholes.

Figure 15. Daily simple return of BNB minus BTC's daily return. Source: CoinGecko, Block Scholes.
ETF Flows – BTC ETFs took in $441M over the first four days of the past week (26th–29th October) before a $643M outflow on Friday, the day after Binance's $6.3B hack and the largest single-day outflow since 25th June, left the week $203M in the red. That interrupts their recovery from the 13th July low in cumulative flows, which has won back about two-thirds of the $8.91B that flowed out between the 6th May peak and 13th July. ETH ETFs had outflows on all five days, losing $432M, including $156M on Friday.
Among altcoin ETFs, only ZEC and XRP took in money over the week, at $17.7M and $4.32M. SOL's funds lost $71.5M, with outflows on every trading day, while NEAR posted its first net-outflow week, at $3.43M, and LINK lost $1.77M.
Adjusted for market cap, NEAR still has the largest 20-day rolling net ETF inflow among altcoin ETFs, but at around 0.39% of token market cap as of 30th October it is down from 1.36% a week earlier, now that its launch day has left the window. HYPE's price rallied about 18% over the week even as its ETFs saw small net outflows ($595K), while BTC fell about 3.5% and SOL 5%.
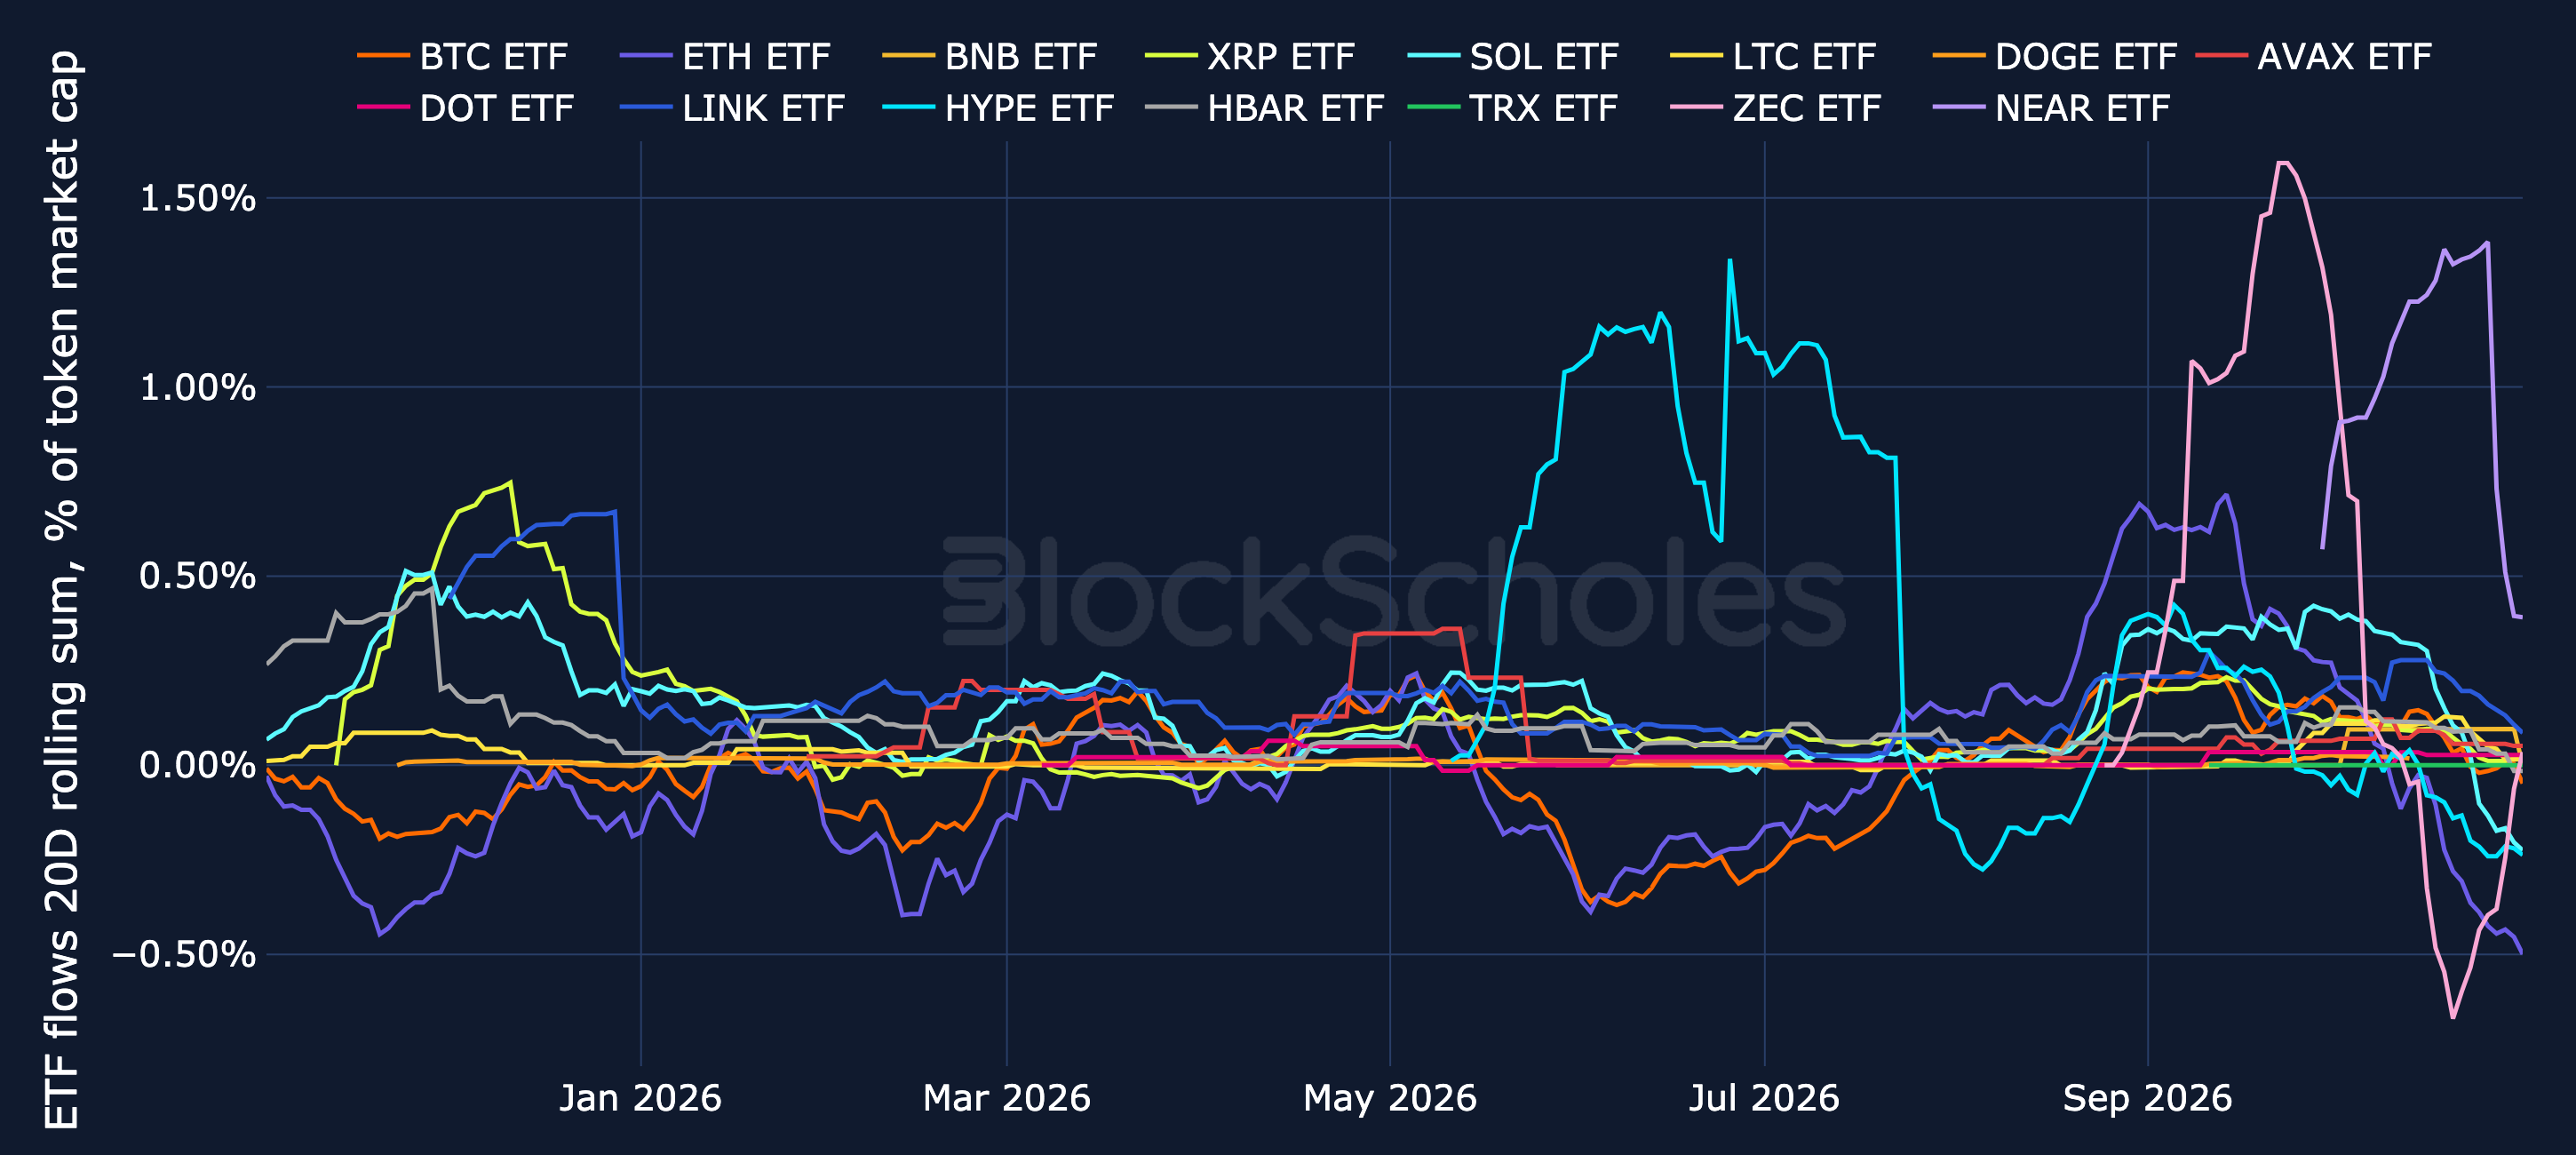
Figure 16. Net flows into spot BTC, ETH and altcoin ETFs, 20-day rolling sum as a percentage of each token's market cap. Source: SoSoValue, CoinGecko, Block Scholes.

Figure 17. Net flows into spot BTC, ETH and altcoin ETFs over the latest week, as a percentage of each token's market cap. Source: SoSoValue, CoinGecko, Block Scholes.

Figure 18. ETH spot price against BTC spot price: daily closes coloured by month, latest day marked with a cross. Source: CoinGecko, Block Scholes.

Figure 19. SOL spot price against BTC spot price: daily closes coloured by month, latest day marked with a cross. Source: CoinGecko, Block Scholes.
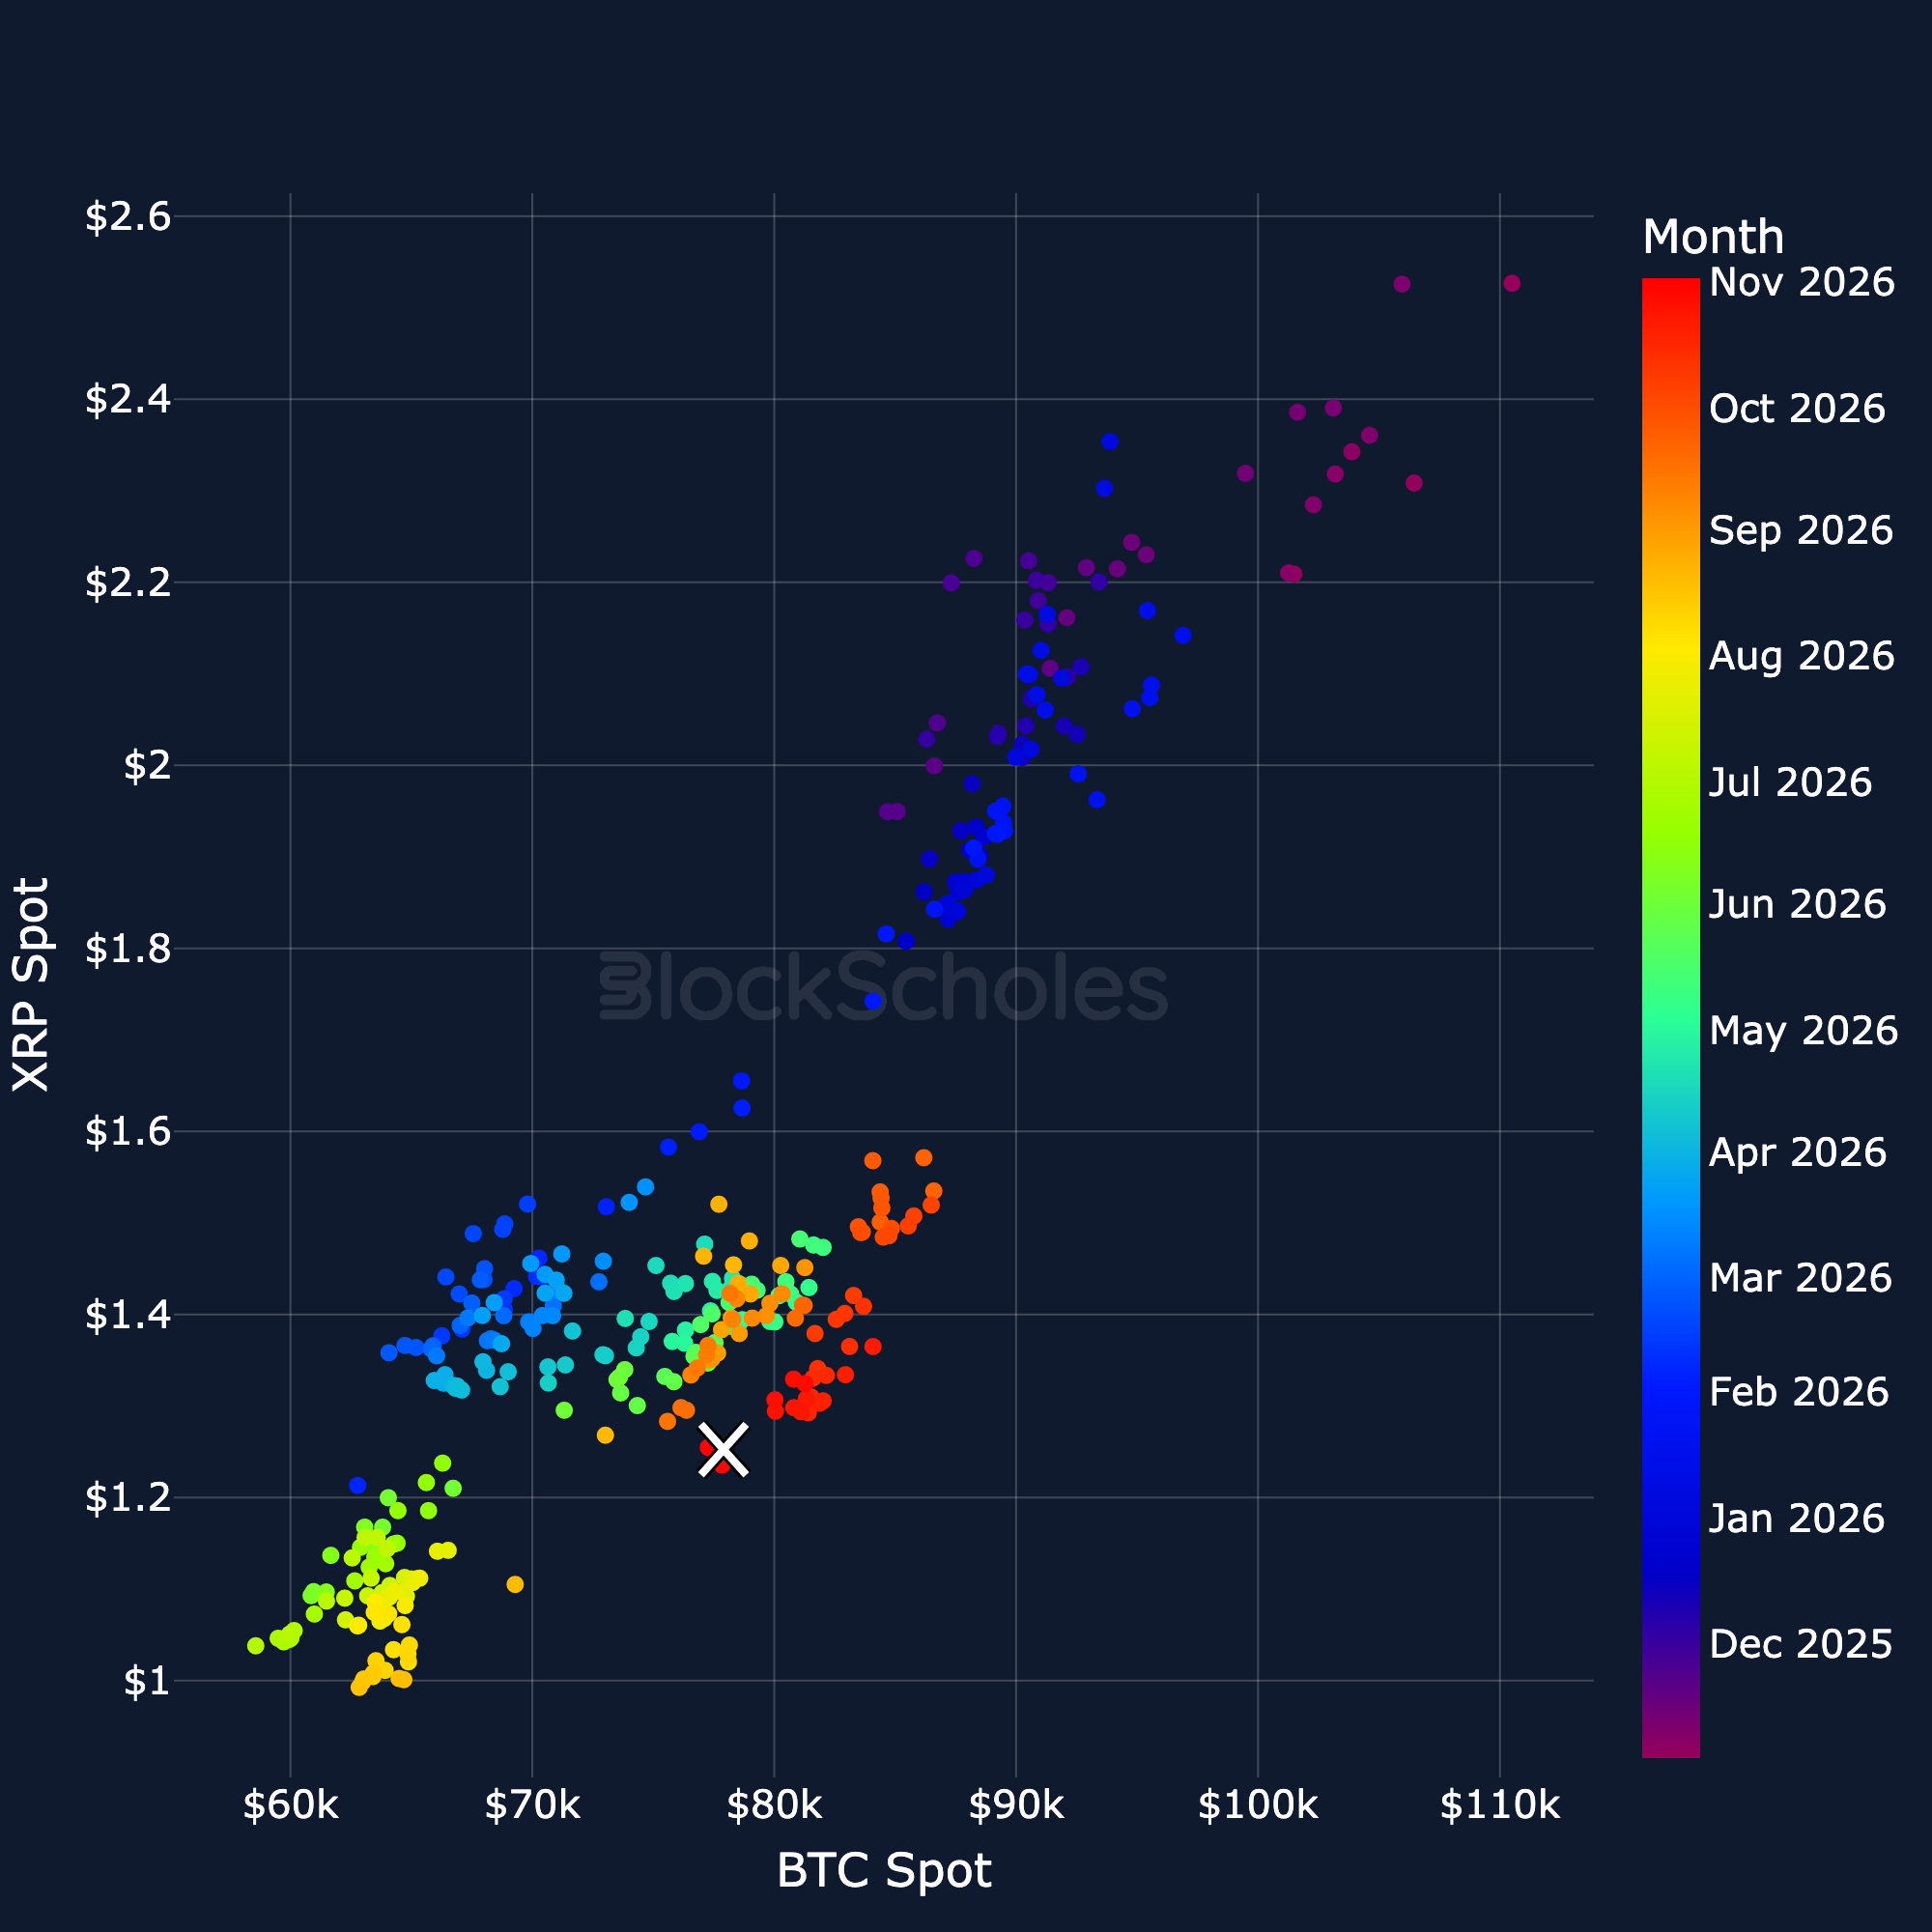
Figure 20. XRP spot price against BTC spot price: daily closes coloured by month, latest day marked with a cross. Source: CoinGecko, Block Scholes.

Figure 21. BNB spot price against BTC spot price: daily closes coloured by month, latest day marked with a cross. Source: CoinGecko, Block Scholes.