

Catherine Fomenkova
Last Updated:
October 30, 2026
•
7 Minutes
DeFi Analytics 30th October 2026
This week's edition of our Crypto DeFi Analytics.

Chain Fee Generation
Daily Fees Generated by Chain

Figure 1. Daily fees generated on each chain, USD. Source: Artemis, Block Scholes.
Stablecoins
Stablecoin Supply by Chain

Figure 2. Stablecoin supply by chain, USD. Source: Artemis, Block Scholes.
Stablecoin Volume by Chain

Figure 3. Stablecoin transaction volume by chain, USD. Source: Artemis, Block Scholes.
Stablecoins - Stablecoin supply contracted over the past month, led by USDC, which shrank by about $4.1B in the 30 days to 27 October to $71.3B, around 5%, against roughly 1% for USDT. Redeemed tokens are burnt, so this is capital leaving stablecoins rather than changing hands. Most of the decline sat on Ethereum, which the Artemis data behind Figure 2 no longer includes: DefiLlama data show its stablecoin supply fell by about $3.7B to around $142B, with USDC down about $1.9B and USDT about $2.4B. The five chains in Figure 2 lost a combined $1.4B, to $134.2B, while Tron, almost all USDT, held at $94.5B, near its 9 October record.
Real World Assets
RWA Perpetual Volume
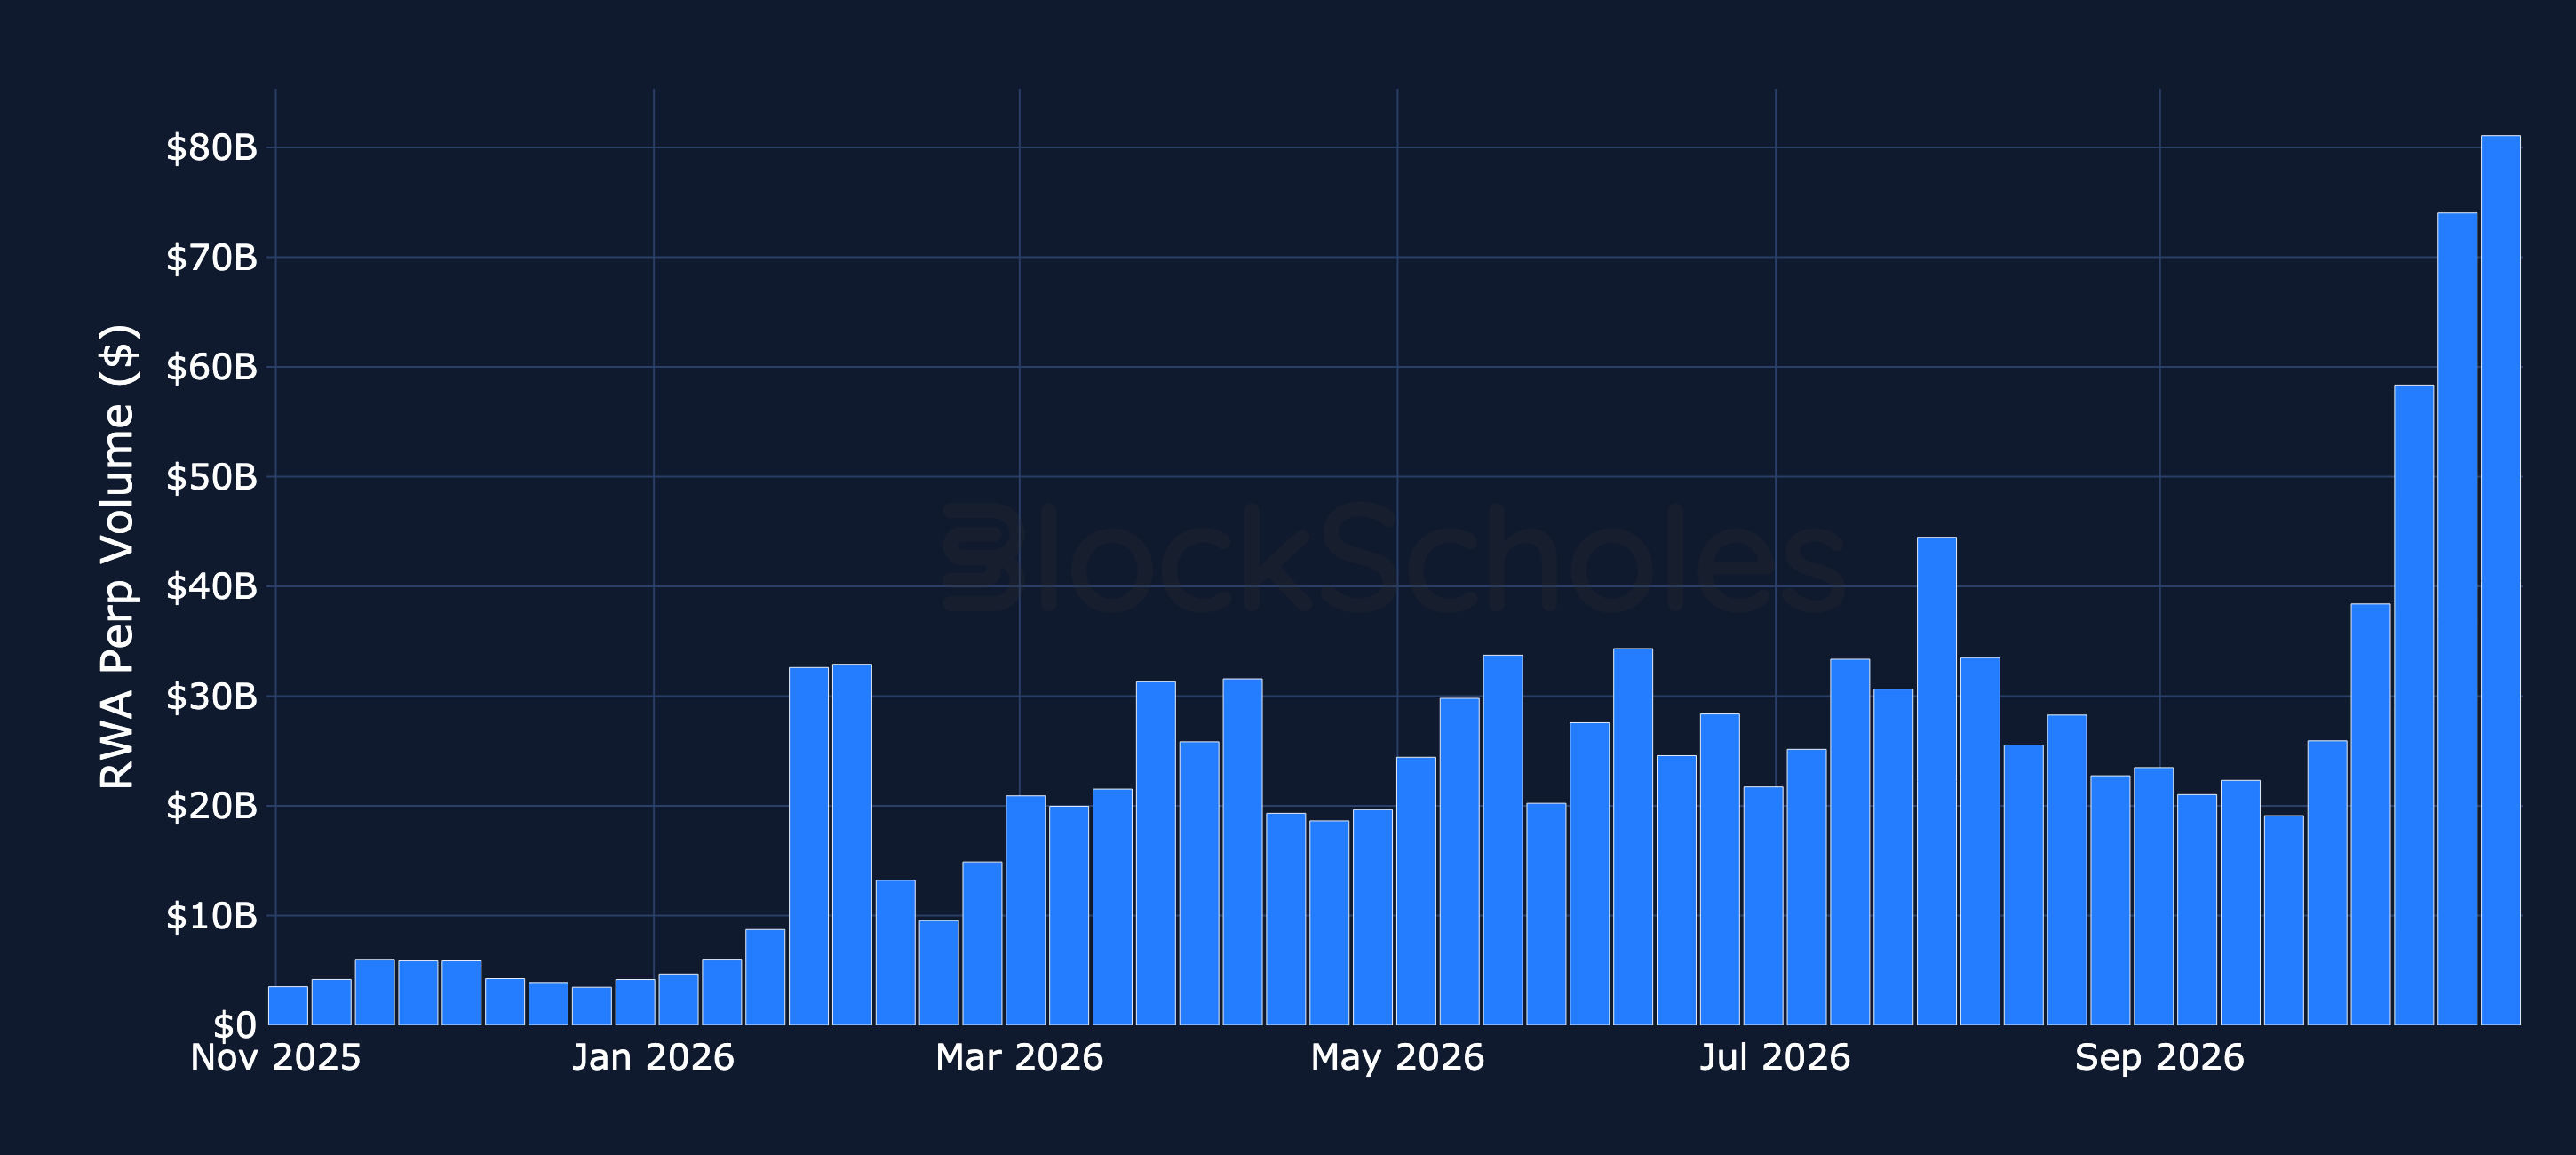
Figure 4. Weekly trading volume in real-world-asset perpetual futures, USD. Source: Artemis, Block Scholes.
RWA Open Interest
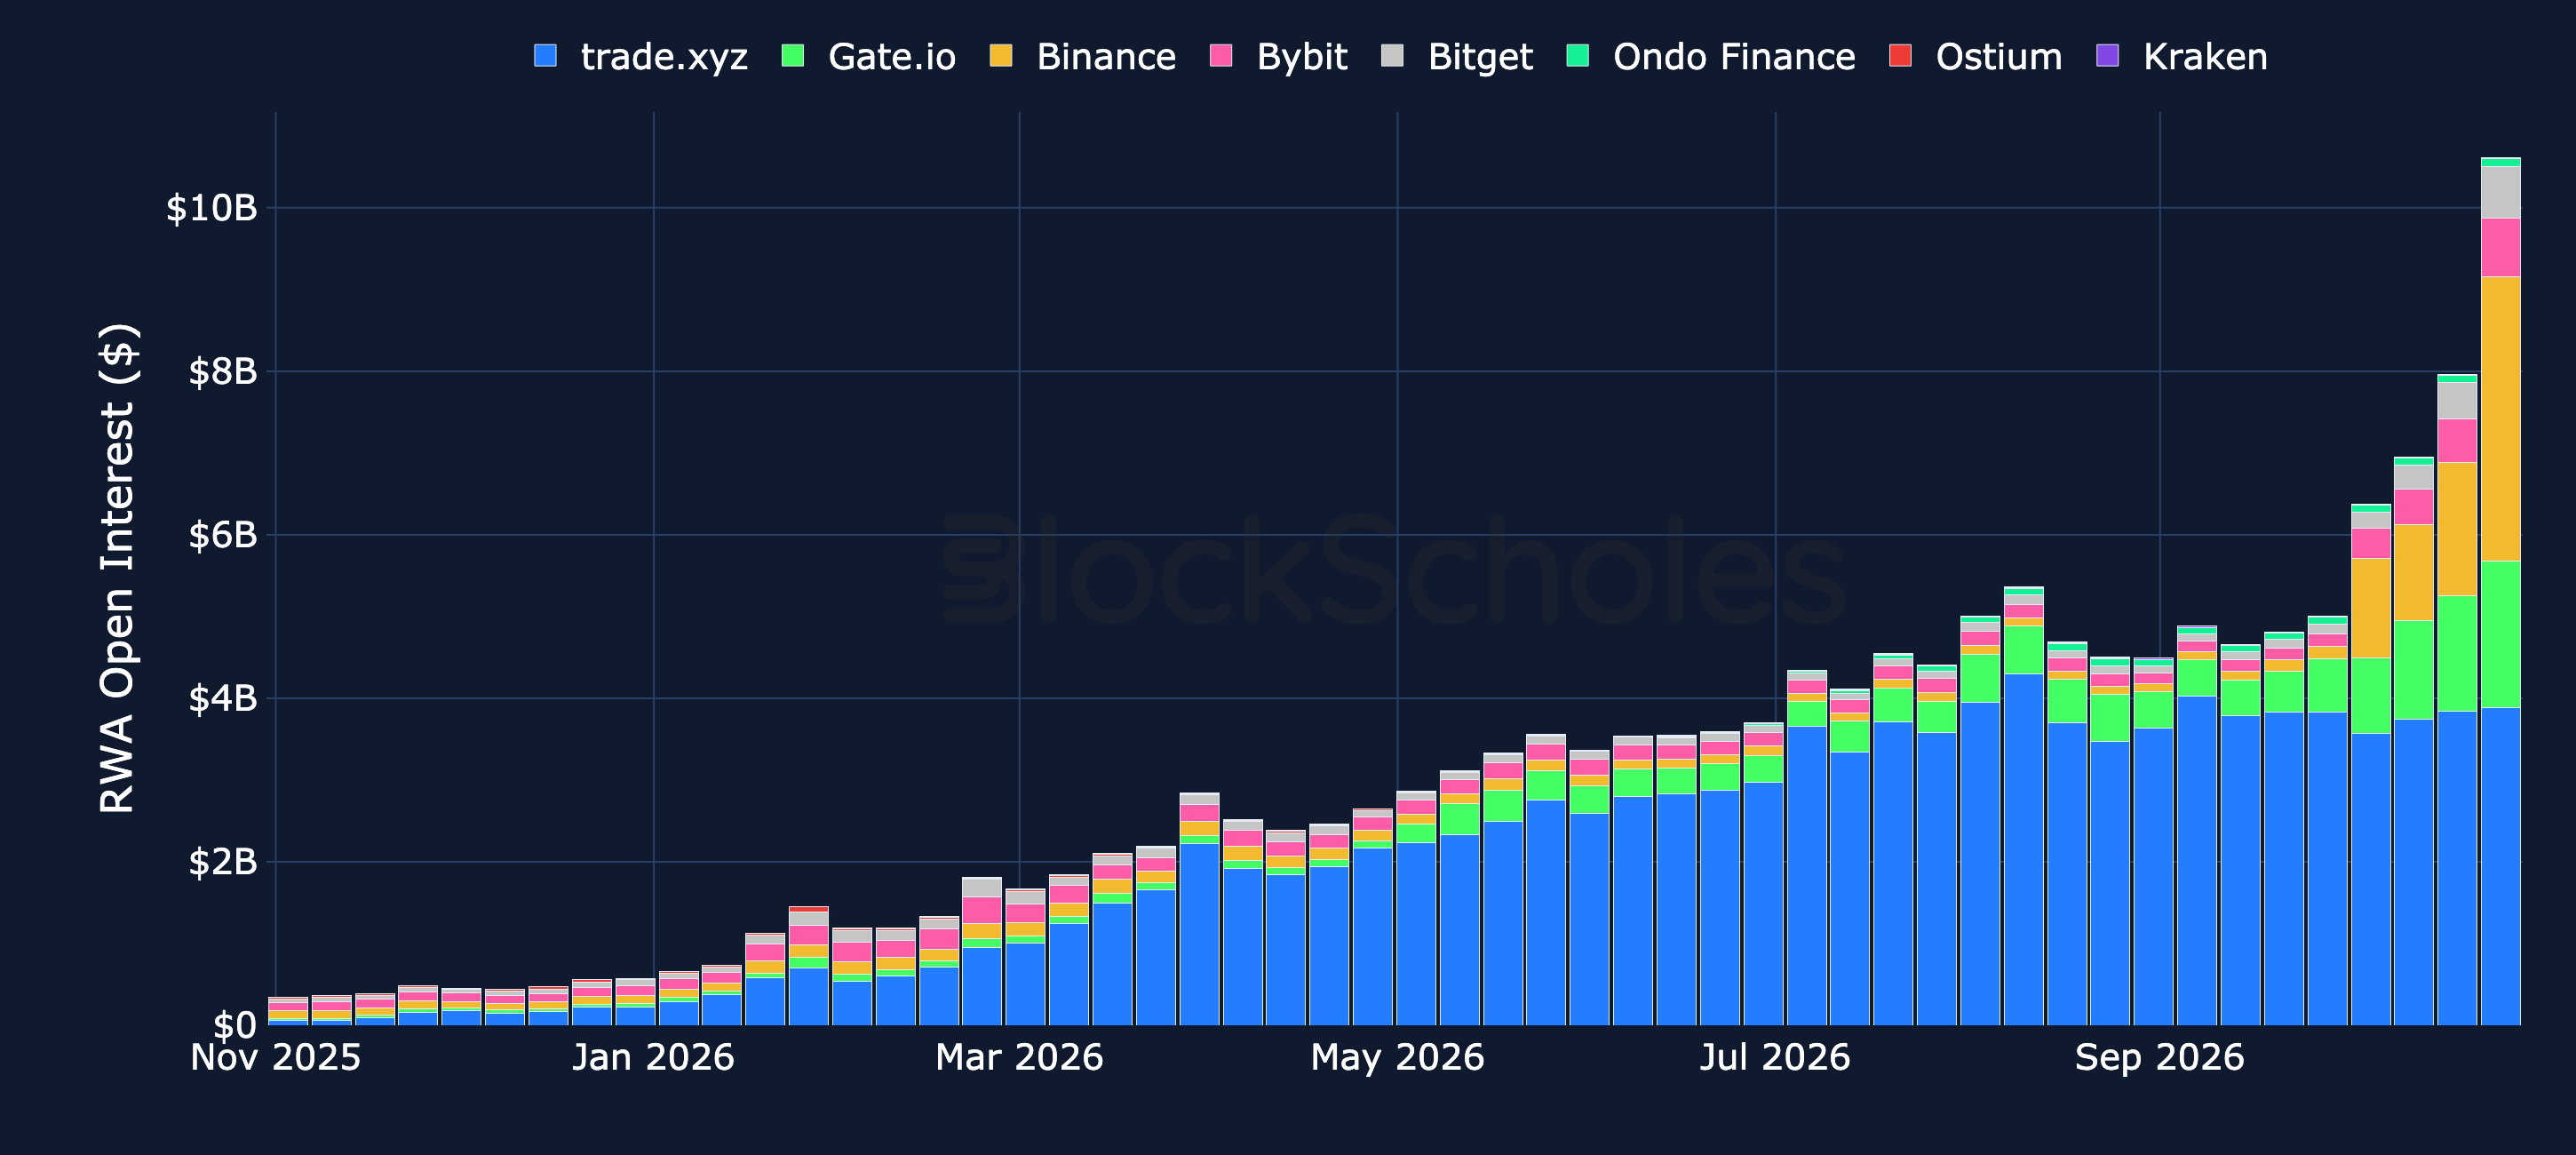
Figure 5. Open interest in real-world-asset perpetual futures by venue, USD. Source: Artemis, Block Scholes.
Ethereum Gas Market
Hourly Average Gas Fees Burnt per Block

Figure 6. Hourly average gas fees burnt per Ethereum block. Source: Dune, Block Scholes.
Hourly Average Cost to Transfer ETH (21,000 Gas)
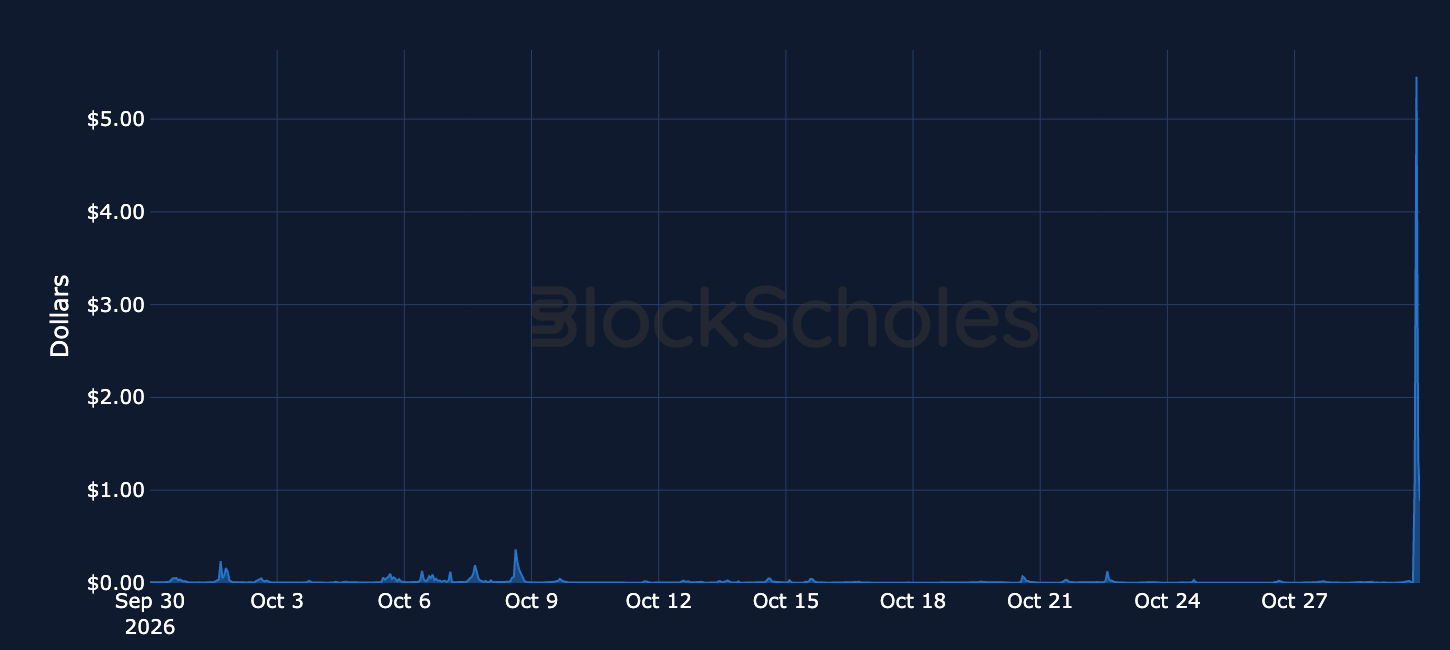
Figure 7. Hourly average cost of a standard ETH transfer (21,000 gas), USD. Source: Dune, Block Scholes.
Hourly Average Blob Gas Usage per Ethereum Block (Target: 6 Blobs)

Figure 8. Hourly average blob gas used per Ethereum block against the six-blob target. Source: Dune, Block Scholes.
Hourly Average Excess Blob Gas per Ethereum Block

Figure 9. Hourly average excess blob gas per Ethereum block. Source: Dune, Block Scholes.
Ethereum Gas - The spike late on 29 October followed a security breach at Binance. At around 20:24 UTC an attacker moved roughly 167,000 ETH, about $2.8B, out of a Binance hot wallet, and Binance later put the total impact at about $6.3B across several chains. Blocks were full within about ten minutes: the base fee, close to 0.1 gwei for nearly all of October, passed 1 gwei at 20:39 UTC and peaked near 253 gwei at 21:14 UTC as users competed for block space while ETH fell about 3.4% within the hour. Fees eased afterwards, but the base fee was still near 19 gwei in the last hour before midnight UTC.
Beacon Chain
Beacon Chain Summary
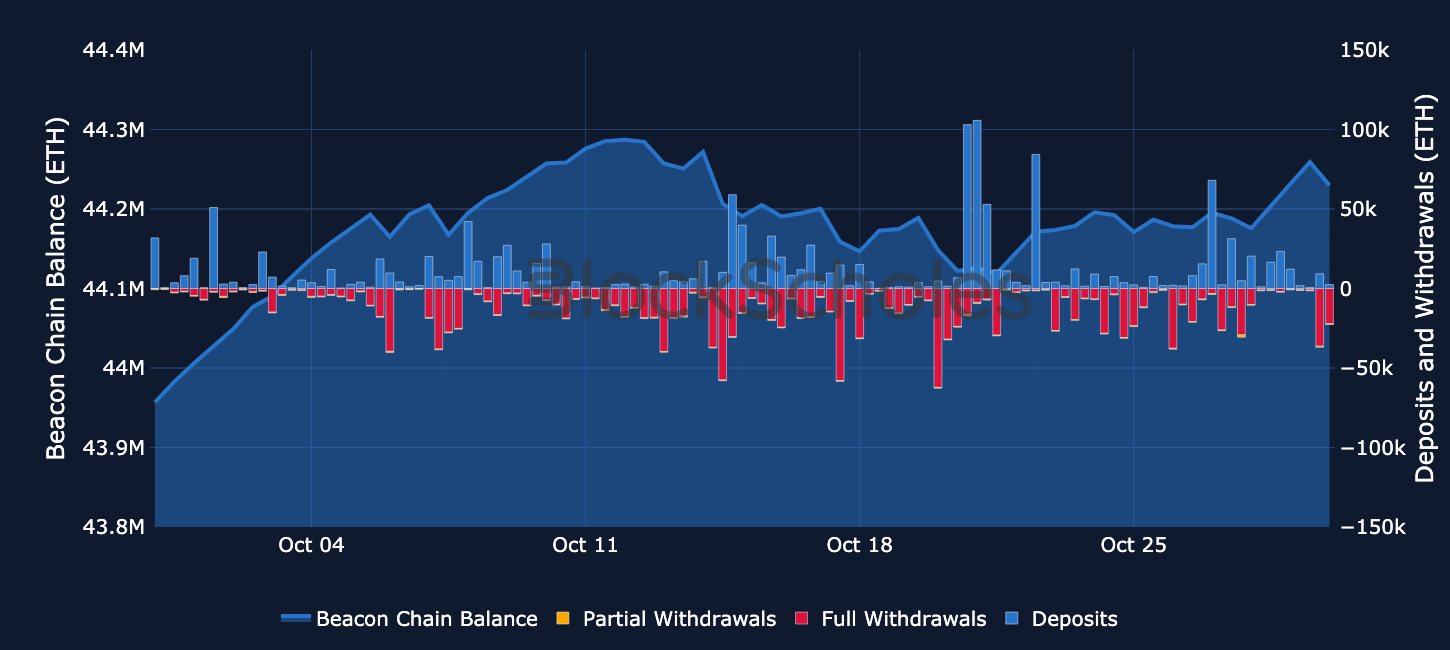
Figure 10. Beacon Chain balance in ETH (left-hand axis) with daily deposits, partial and full withdrawals (right-hand axis). Source: Dune, Block Scholes.
Beacon Chain Balance
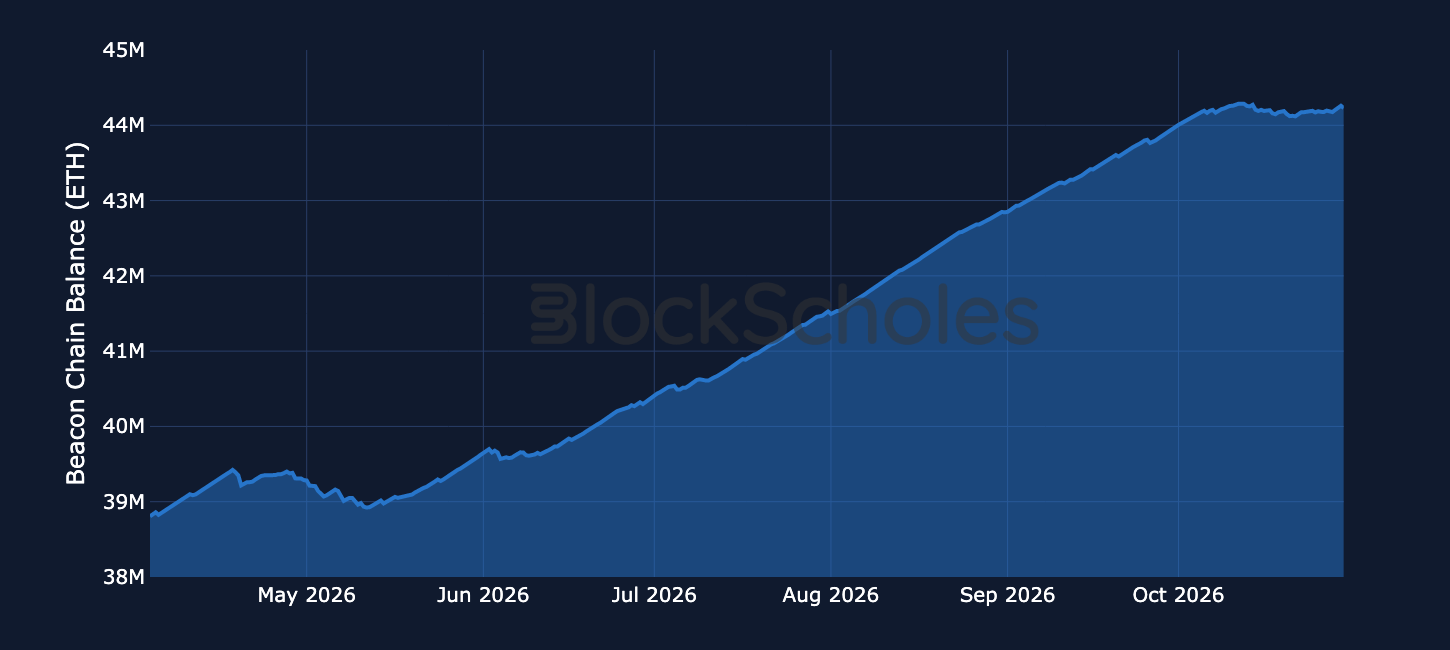
Figure 11. Total ETH staked on the Beacon Chain. Source: Dune, Block Scholes.
Uniswap V3
Uniswap V3 Hourly Volumes - Ethereum
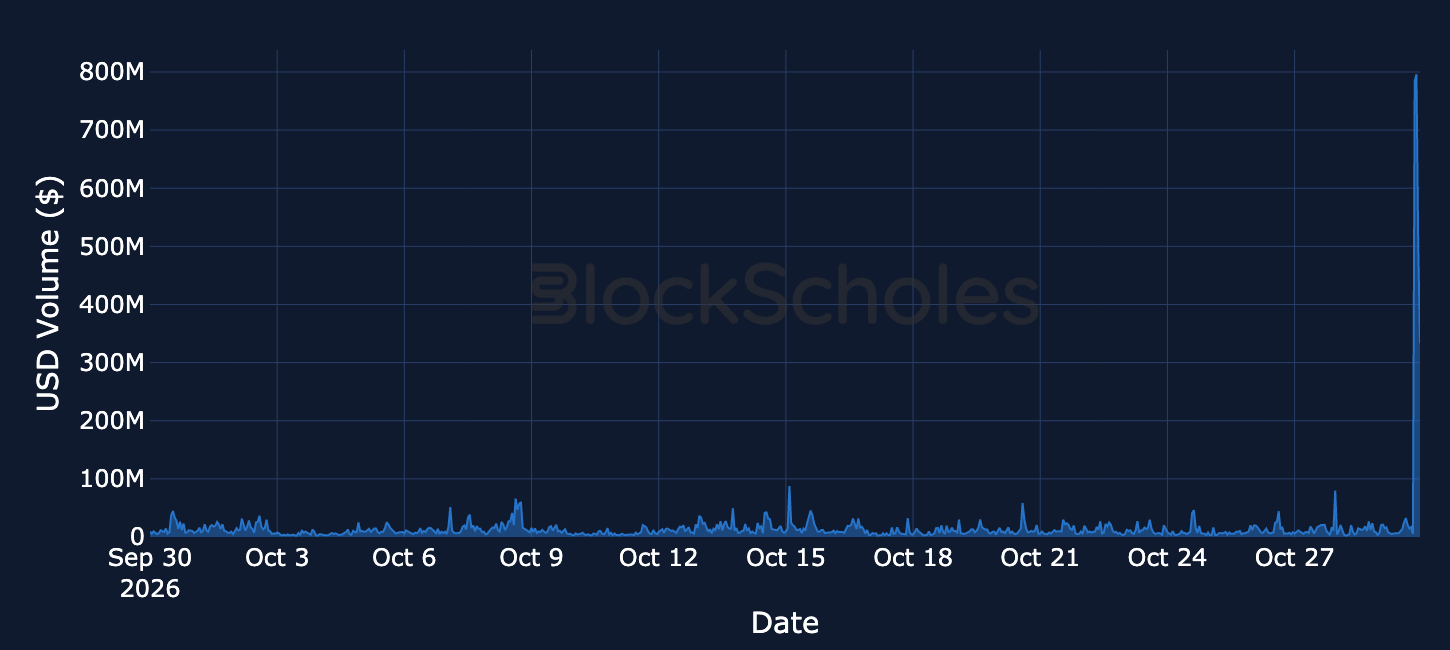
Figure 12. Hourly Uniswap V3 trading volume on Ethereum, USD. Source: Dune, Block Scholes.
Uniswap V3 Hourly Transaction Count - Ethereum
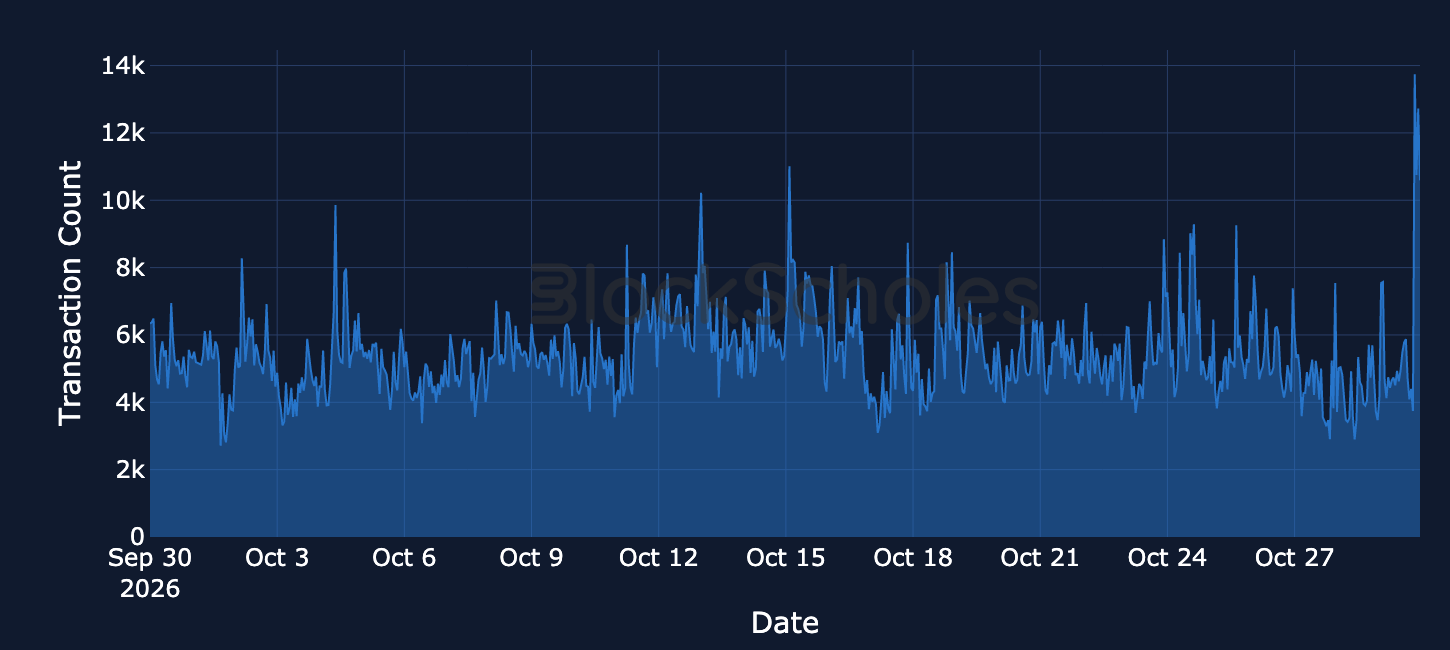
Figure 13. Hourly Uniswap V3 transaction count on Ethereum. Source: Dune, Block Scholes.
Uniswap V3 - The episode behind the gas spike in Figures 6 and 7 also produced the largest hourly volumes of the past month. Volume reached about $784M and $796M in the two hours from 20:00 UTC, against a typical $9M and a previous high of $88M on 15 October. The jump came mainly from trade size rather than trade count: transactions rose about 2.6 times to 13,700 an hour, while the average trade grew from around $1,800 to between $57,000 and $74,000. The bulk of the flow went through the deepest pools, WETH/USDT, USDC/WETH and the WBTC pairs, rather than any single token, and volume was still around $500M and $330M over the following two hours.
Liquidations
Liquidations across Aave & Compound
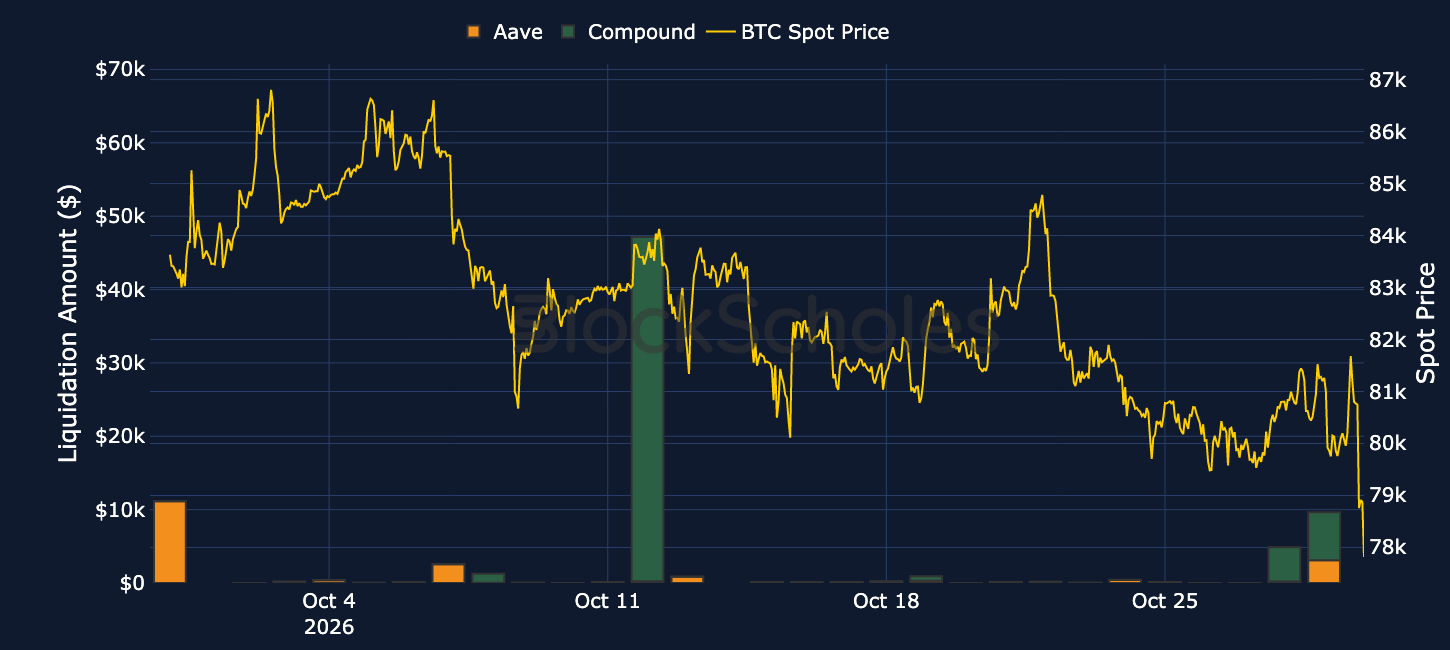
Figure 14. Daily liquidation amounts on Aave (orange) and Compound (green) with the BTC spot price (yellow, right-hand axis). Source: Dune, Block Scholes.


Free
PREMIUM
Institutional
DeFi Analytics 30th October 2026
This week's edition of our Crypto DeFi Analytics.
Free
PREMIUM
Institutional
DeFi Analytics 15th August 2025
This week's edition of our Crypto DeFi Analytics.

Free
PREMIUM
Institutional
Binance Lost Around $6.3B to Hackers in the Largest Crypto Theft on Record
Binance suffered the largest crypto hack in history on Thursday, with attackers draining $6.3B from its hot wallets, while the exchange says losses will be covered in full by its SAFU fund and reserves. BTC fell 5.1% to $76.7K, its lowest since mid-September, and ETH 6.1% to $2,191, as $1.53B of positions were liquidated over 24 hours and BTC's 7-day implied vol jumped from 35.5% to 47.8%. Alphabet closed 12.6% lower in its biggest drop on record, while Strategy reported Q3 net income of $19.53B and ICE agreed to partner with TradeXYZ to bring Hyperliquid-based perpetual futures to the US.