Tazmina Rashid
Research Analyst
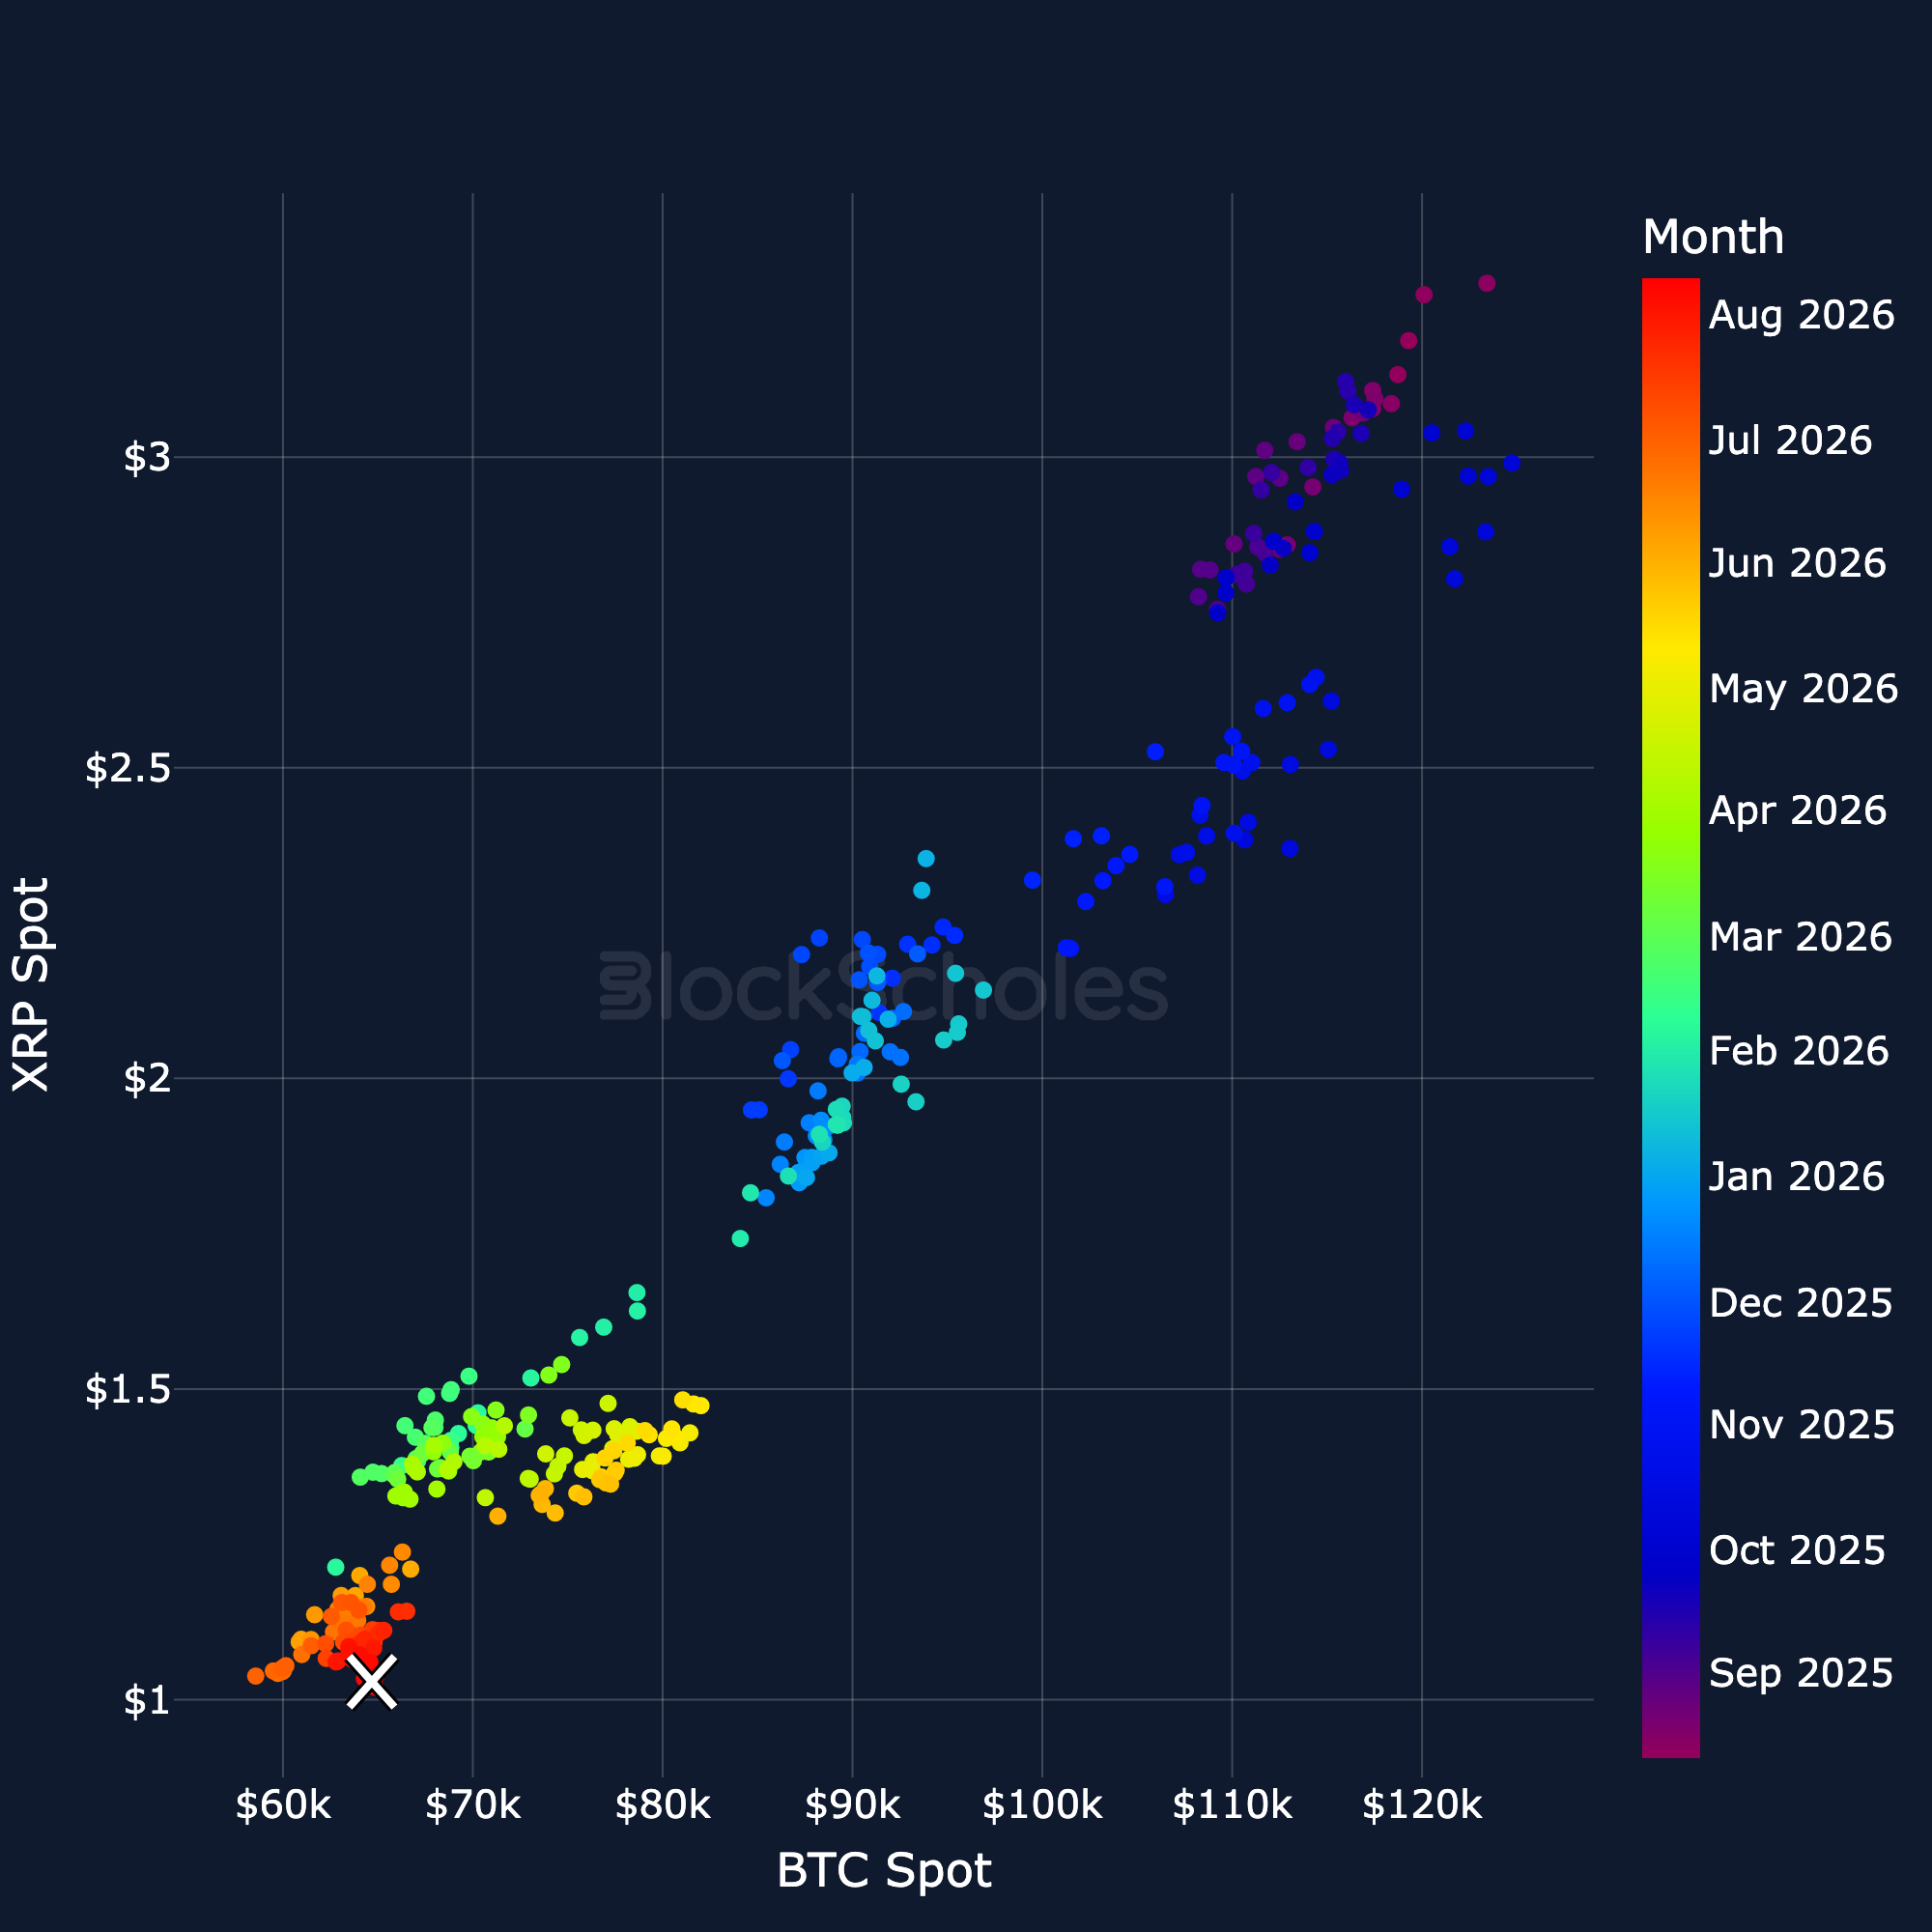
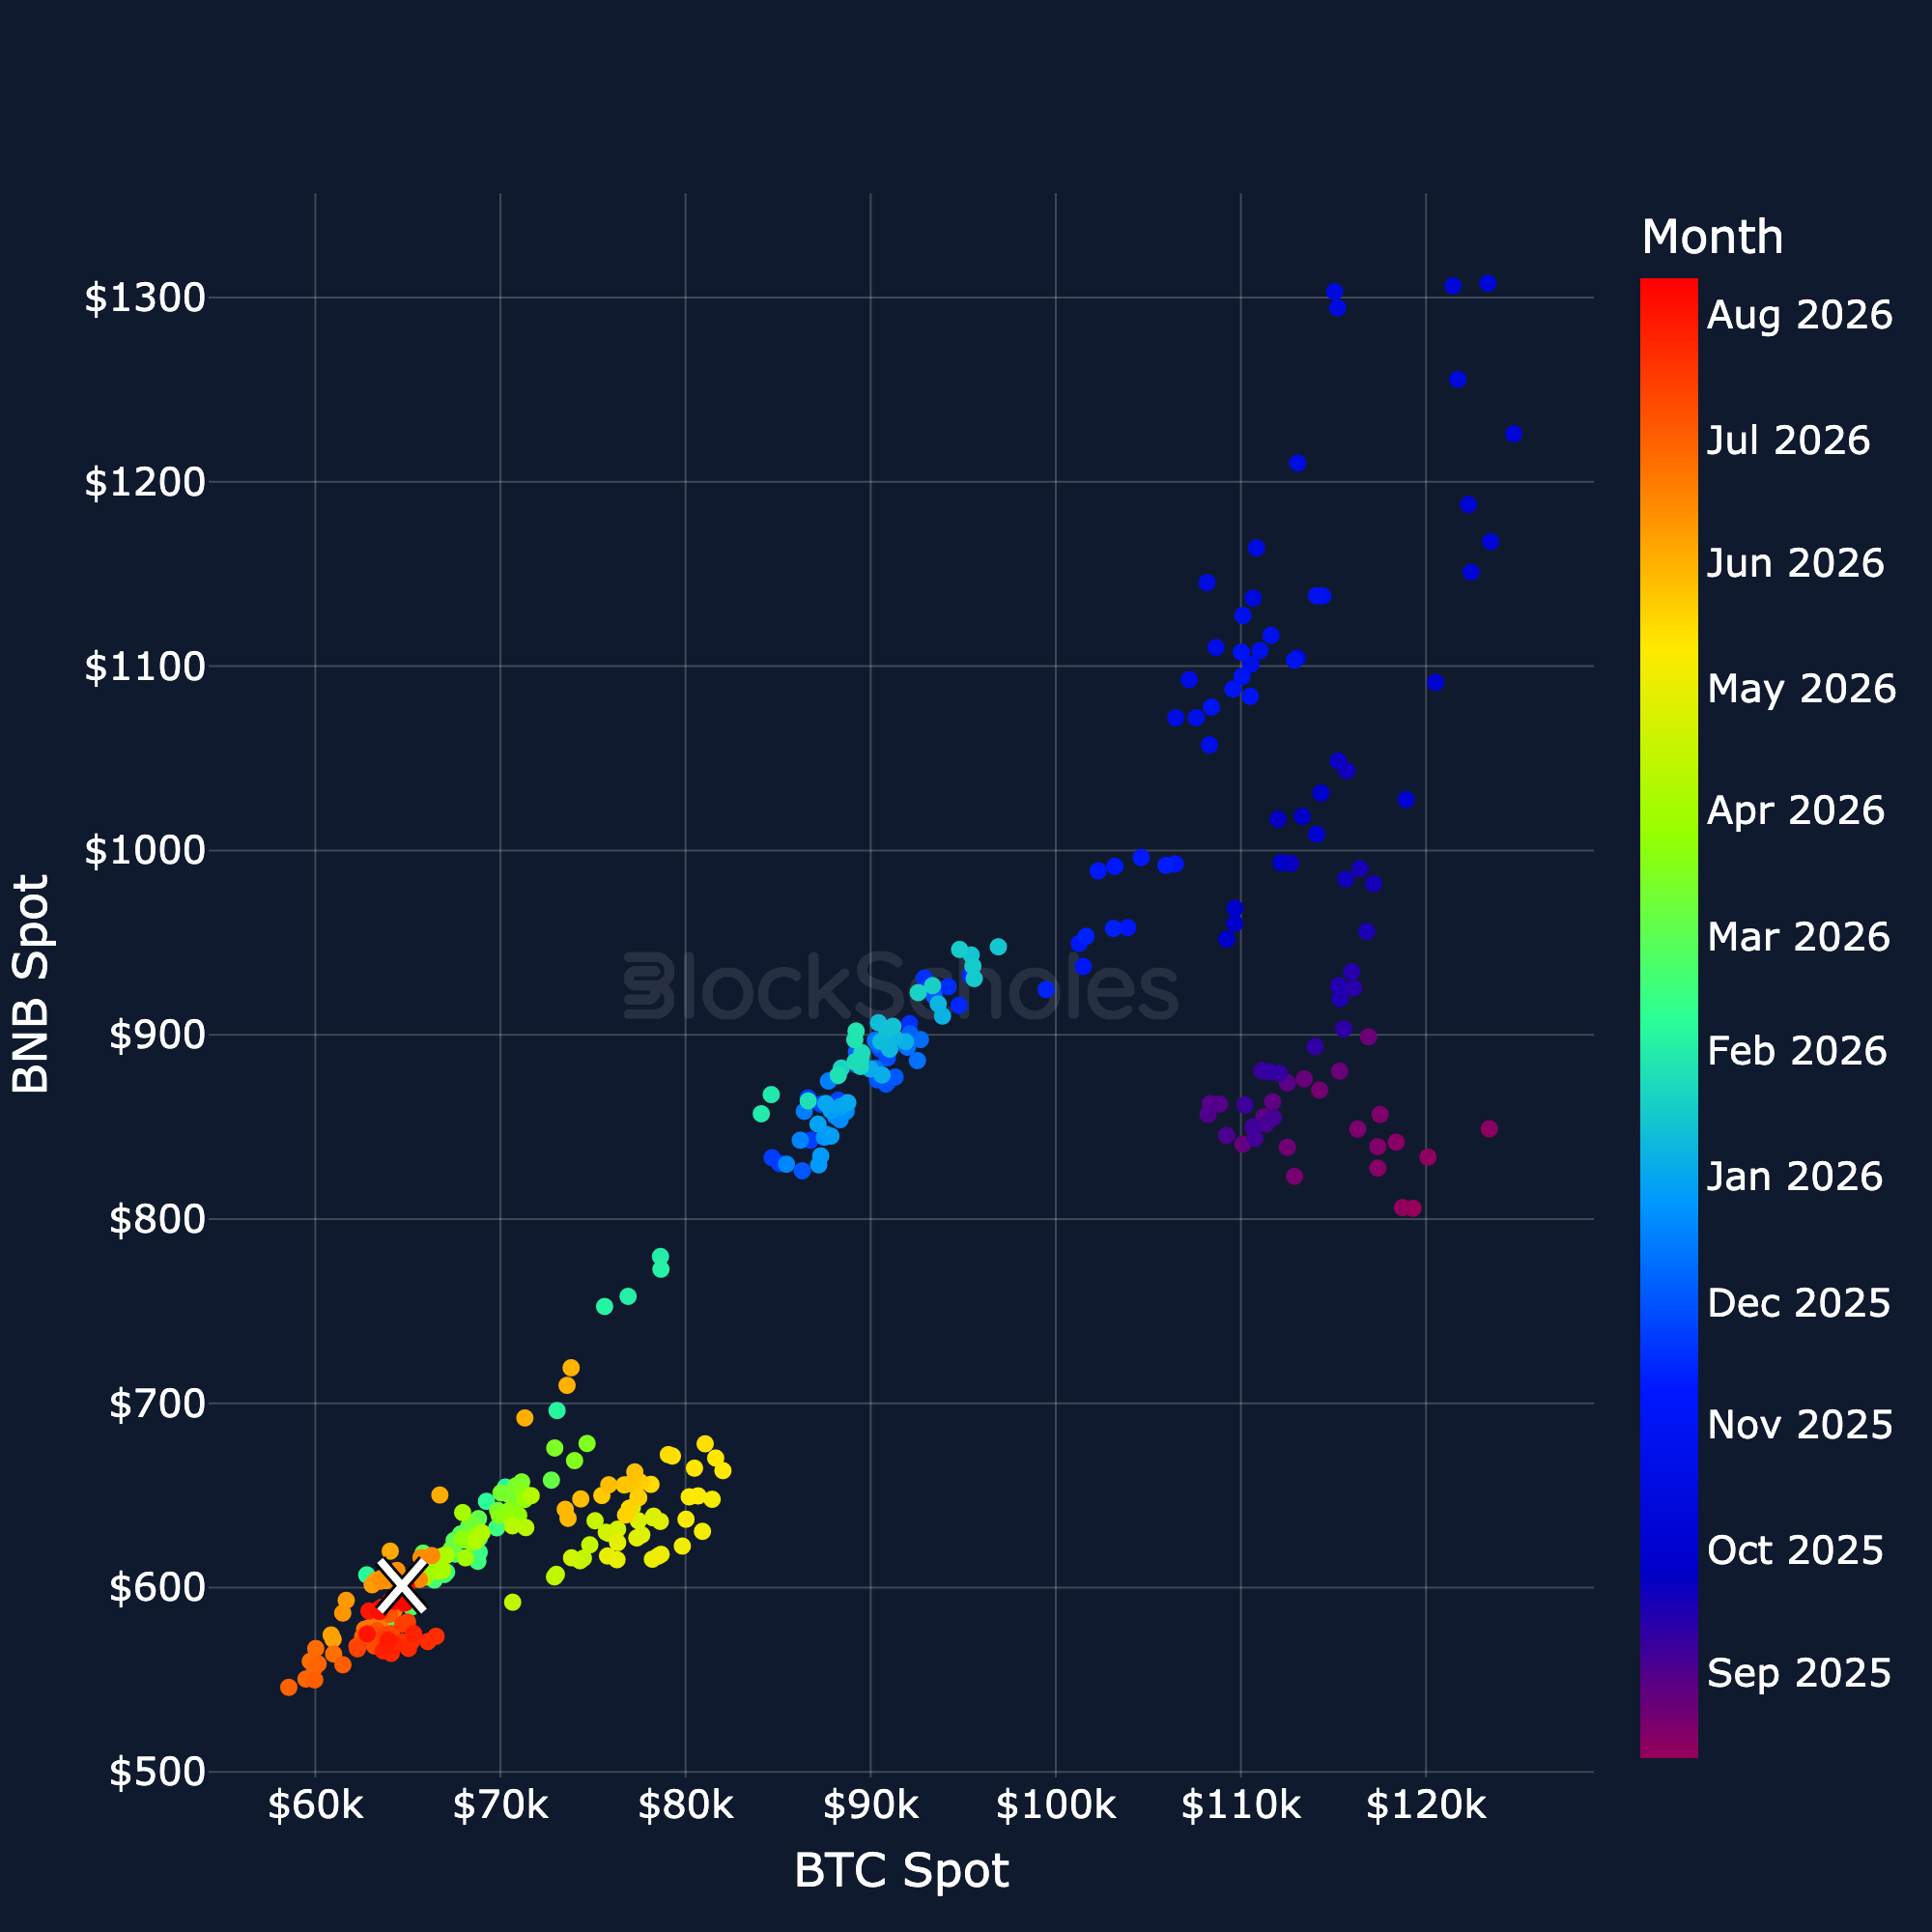
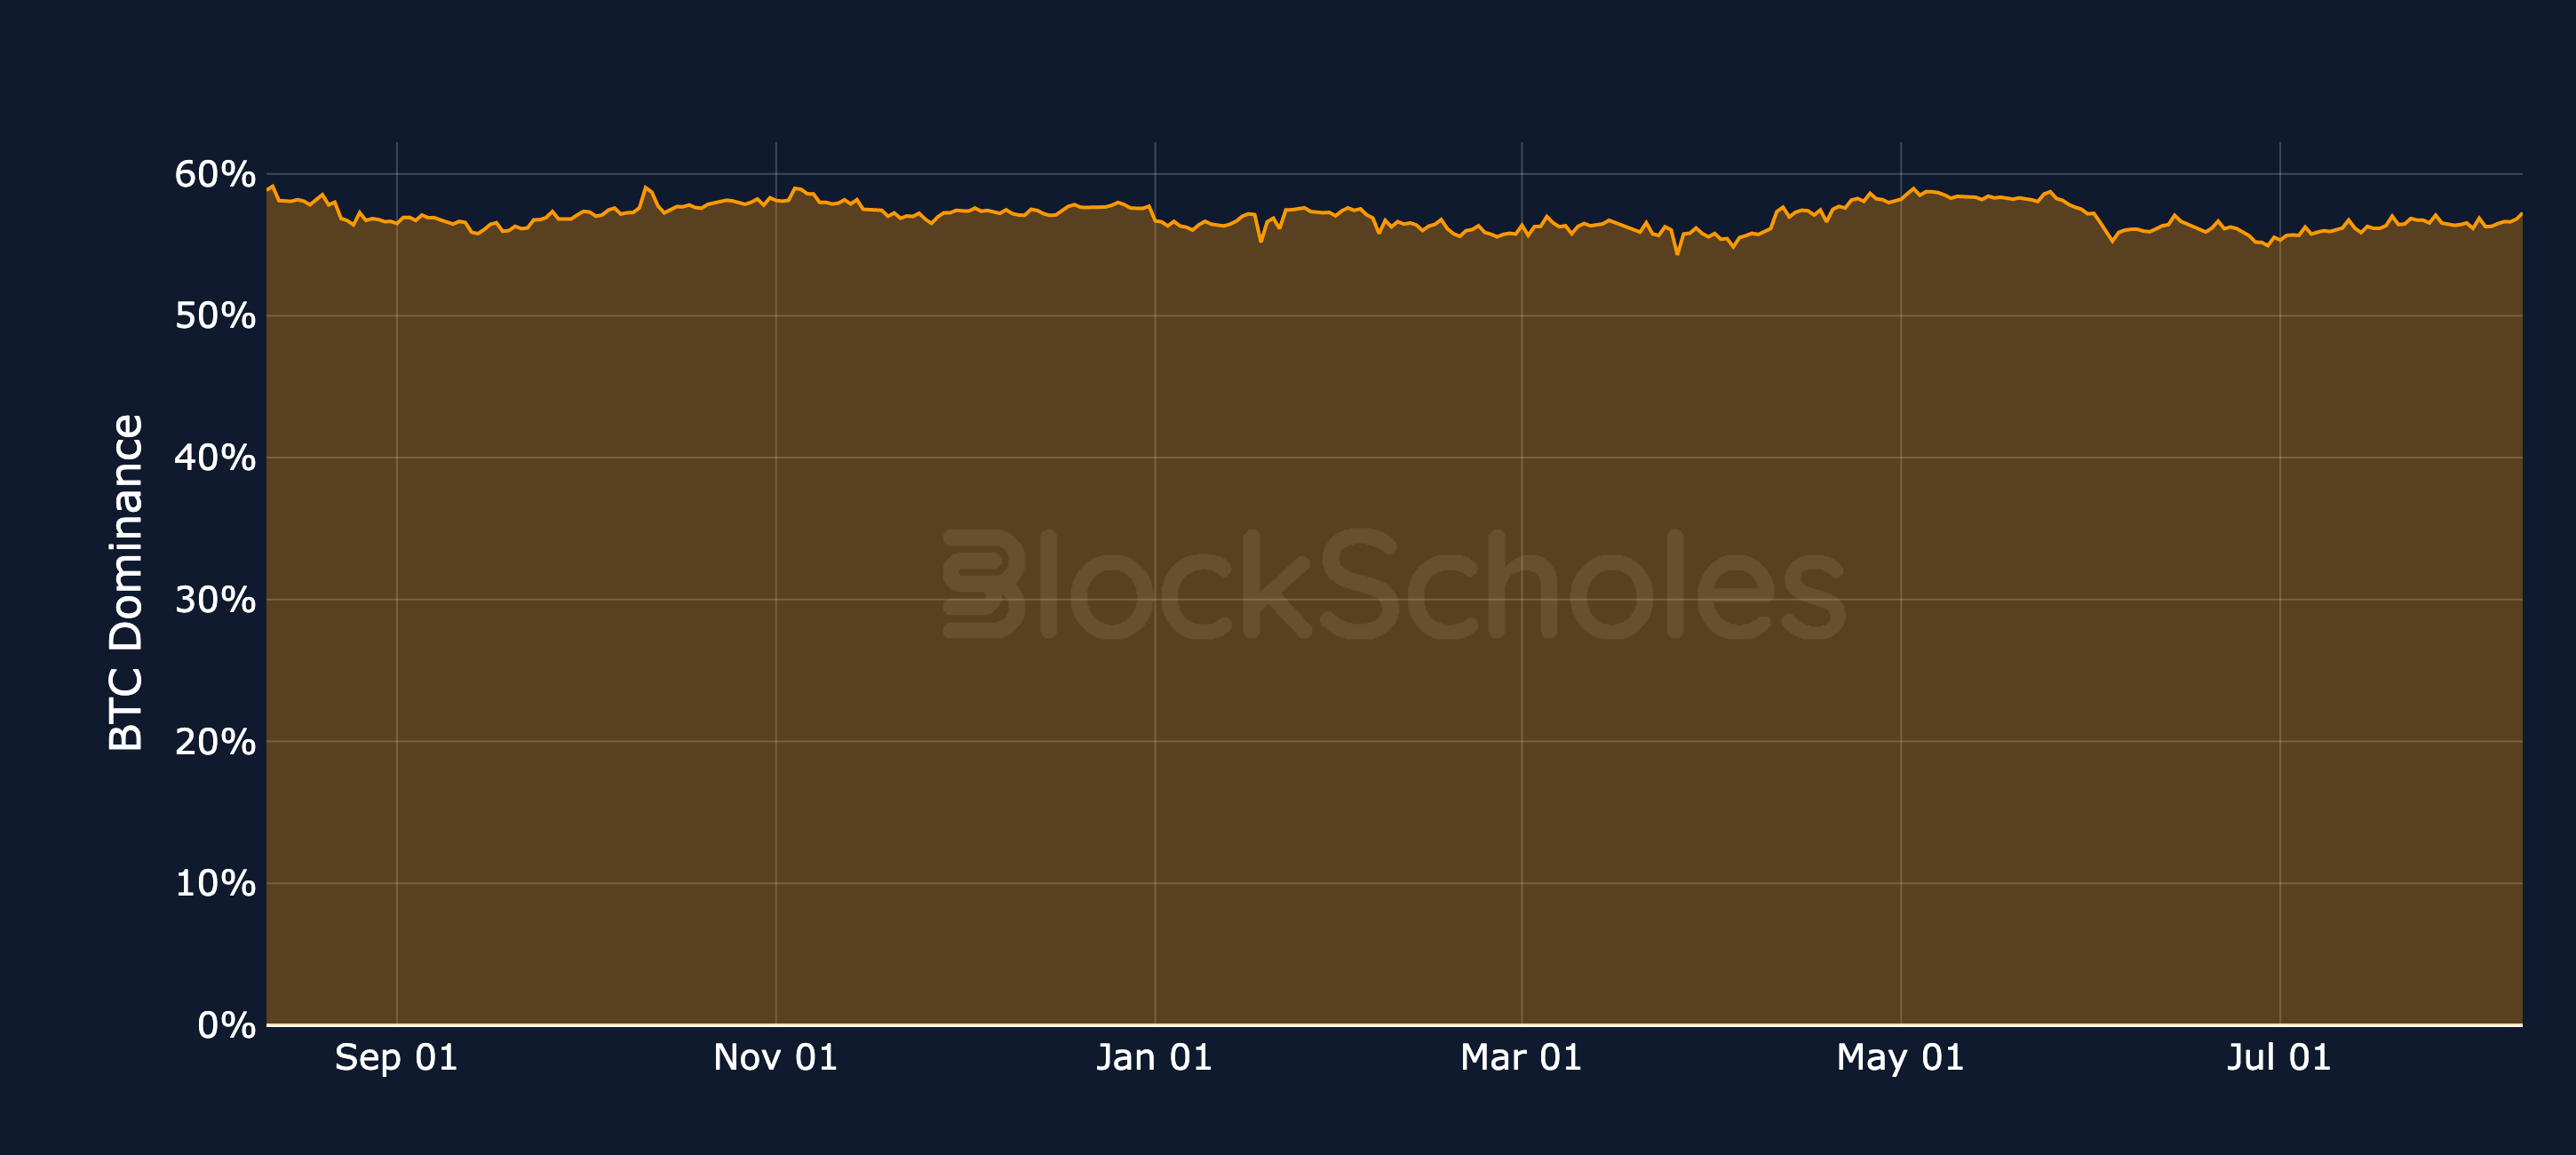
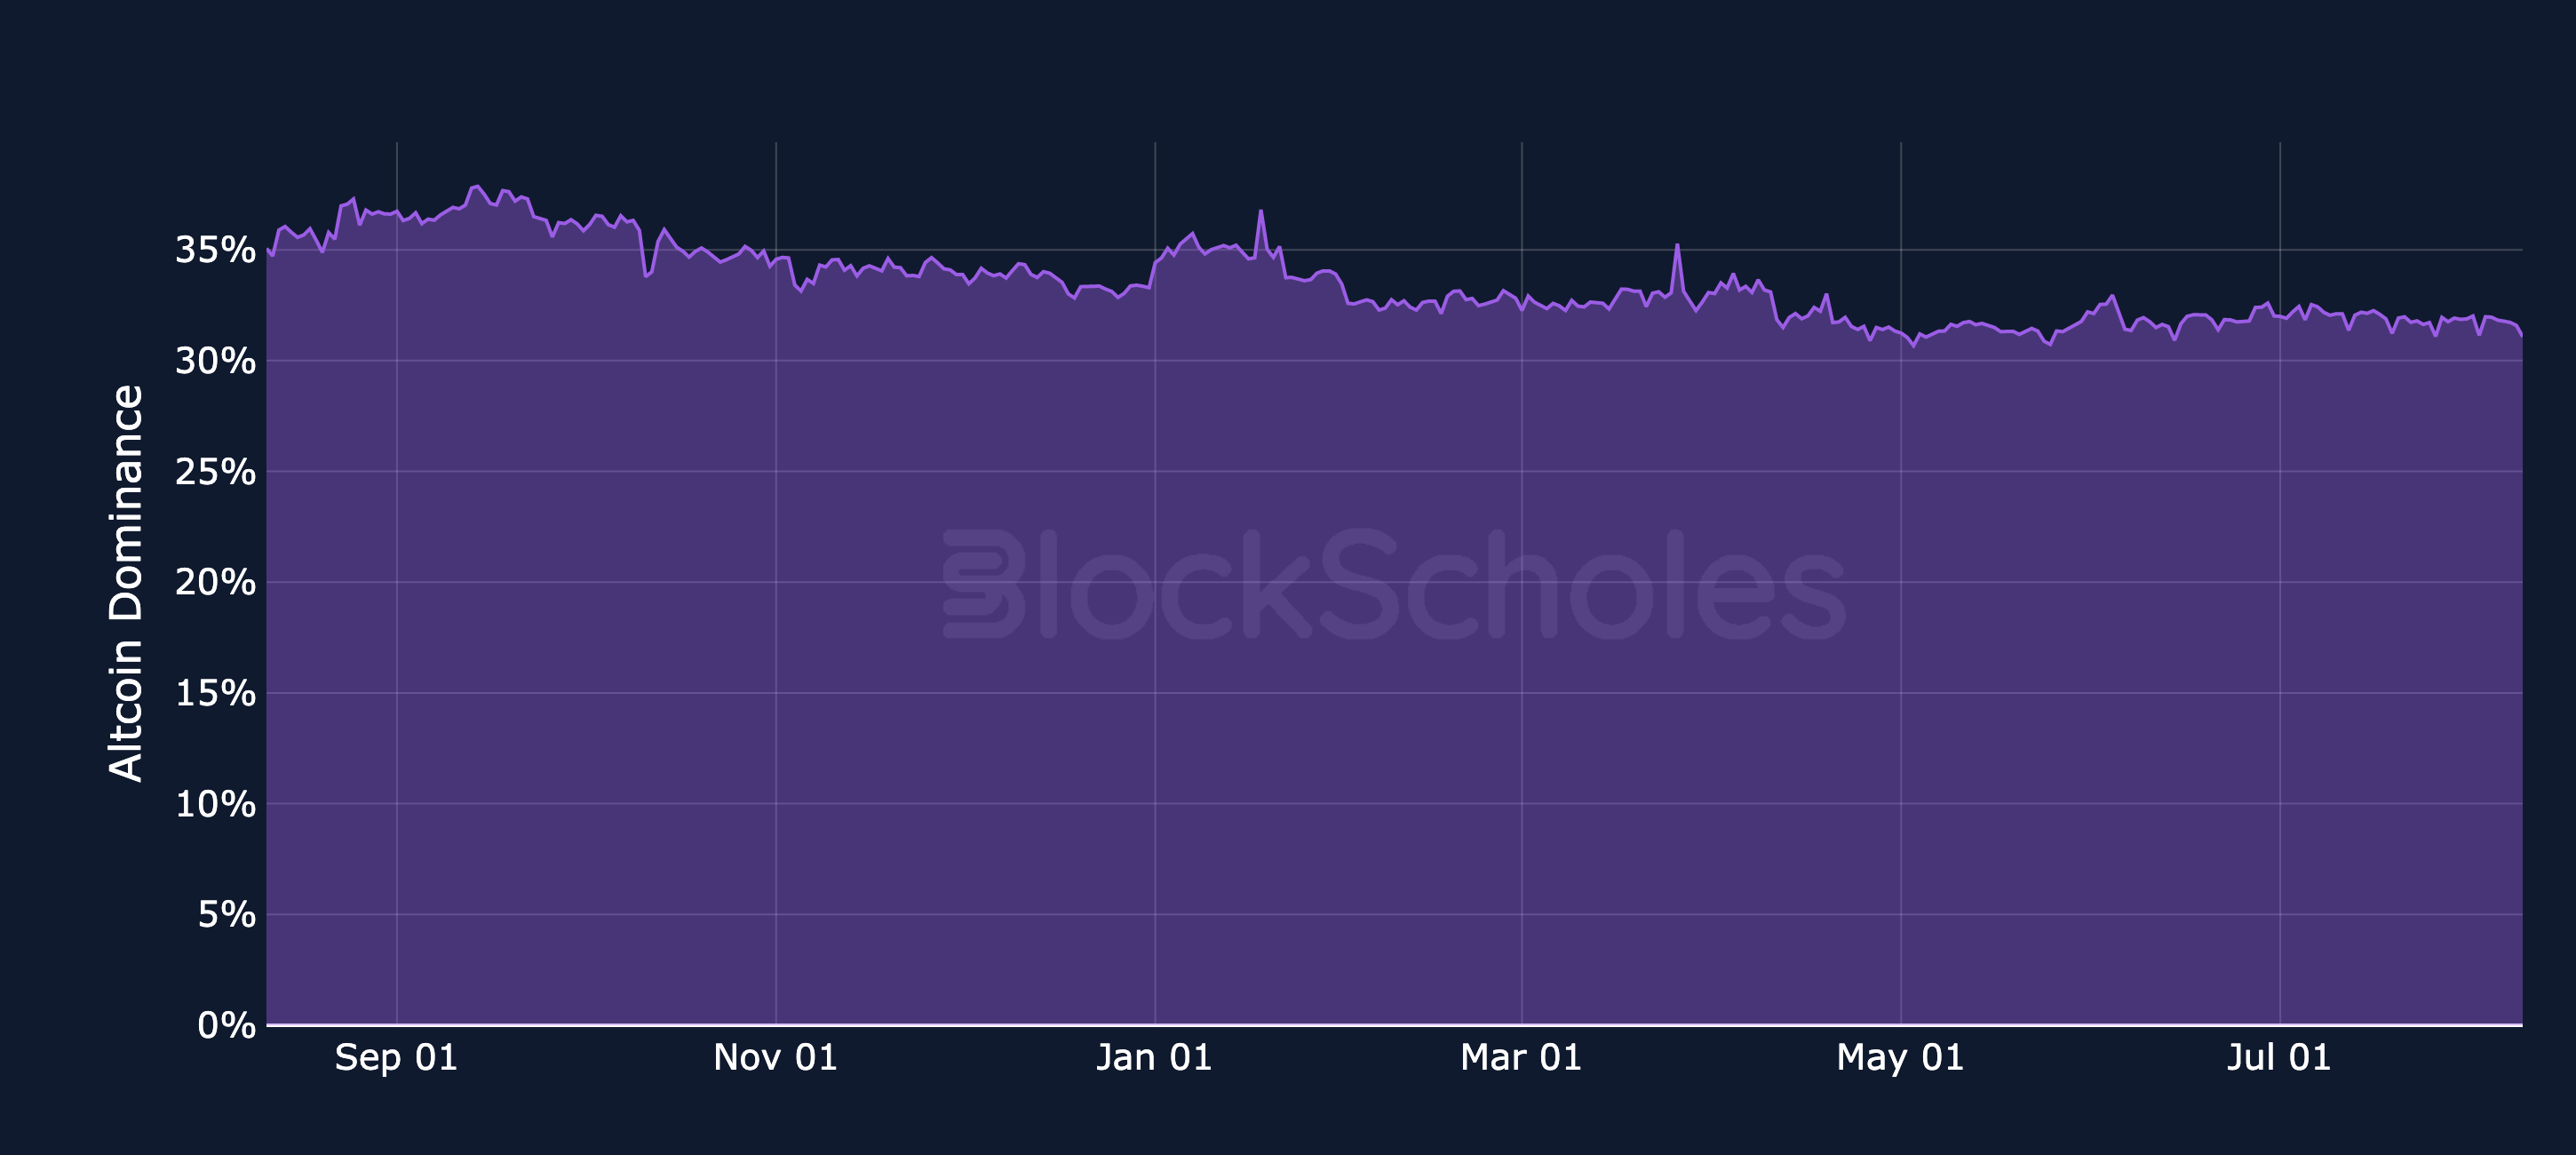
This week's edition of our Crypto Altcoins Analytics.

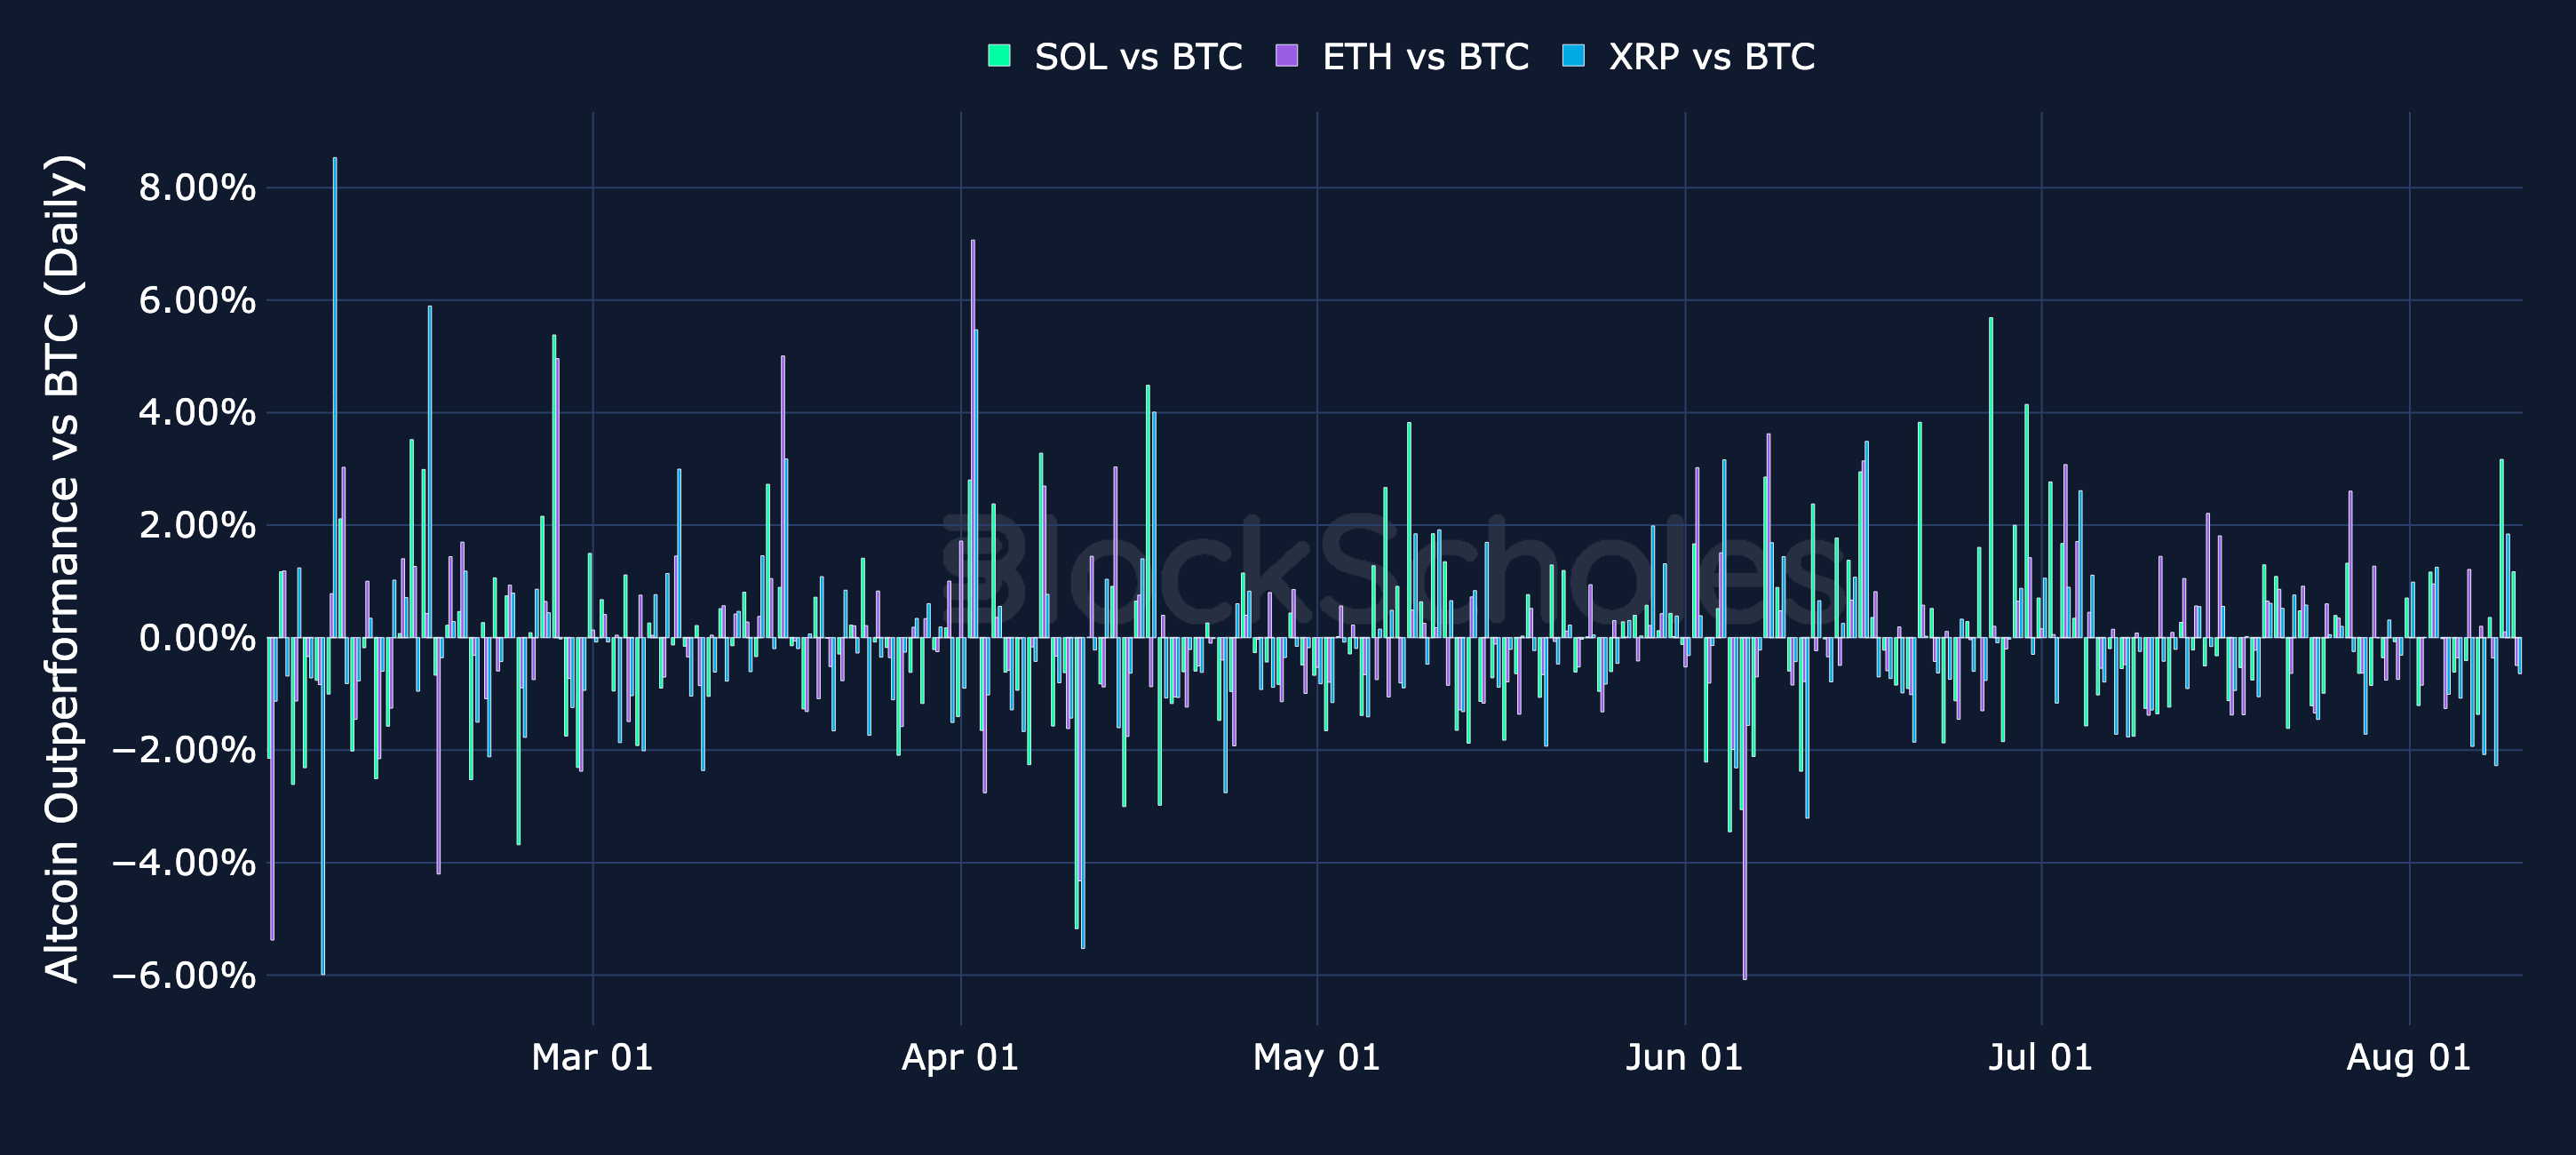
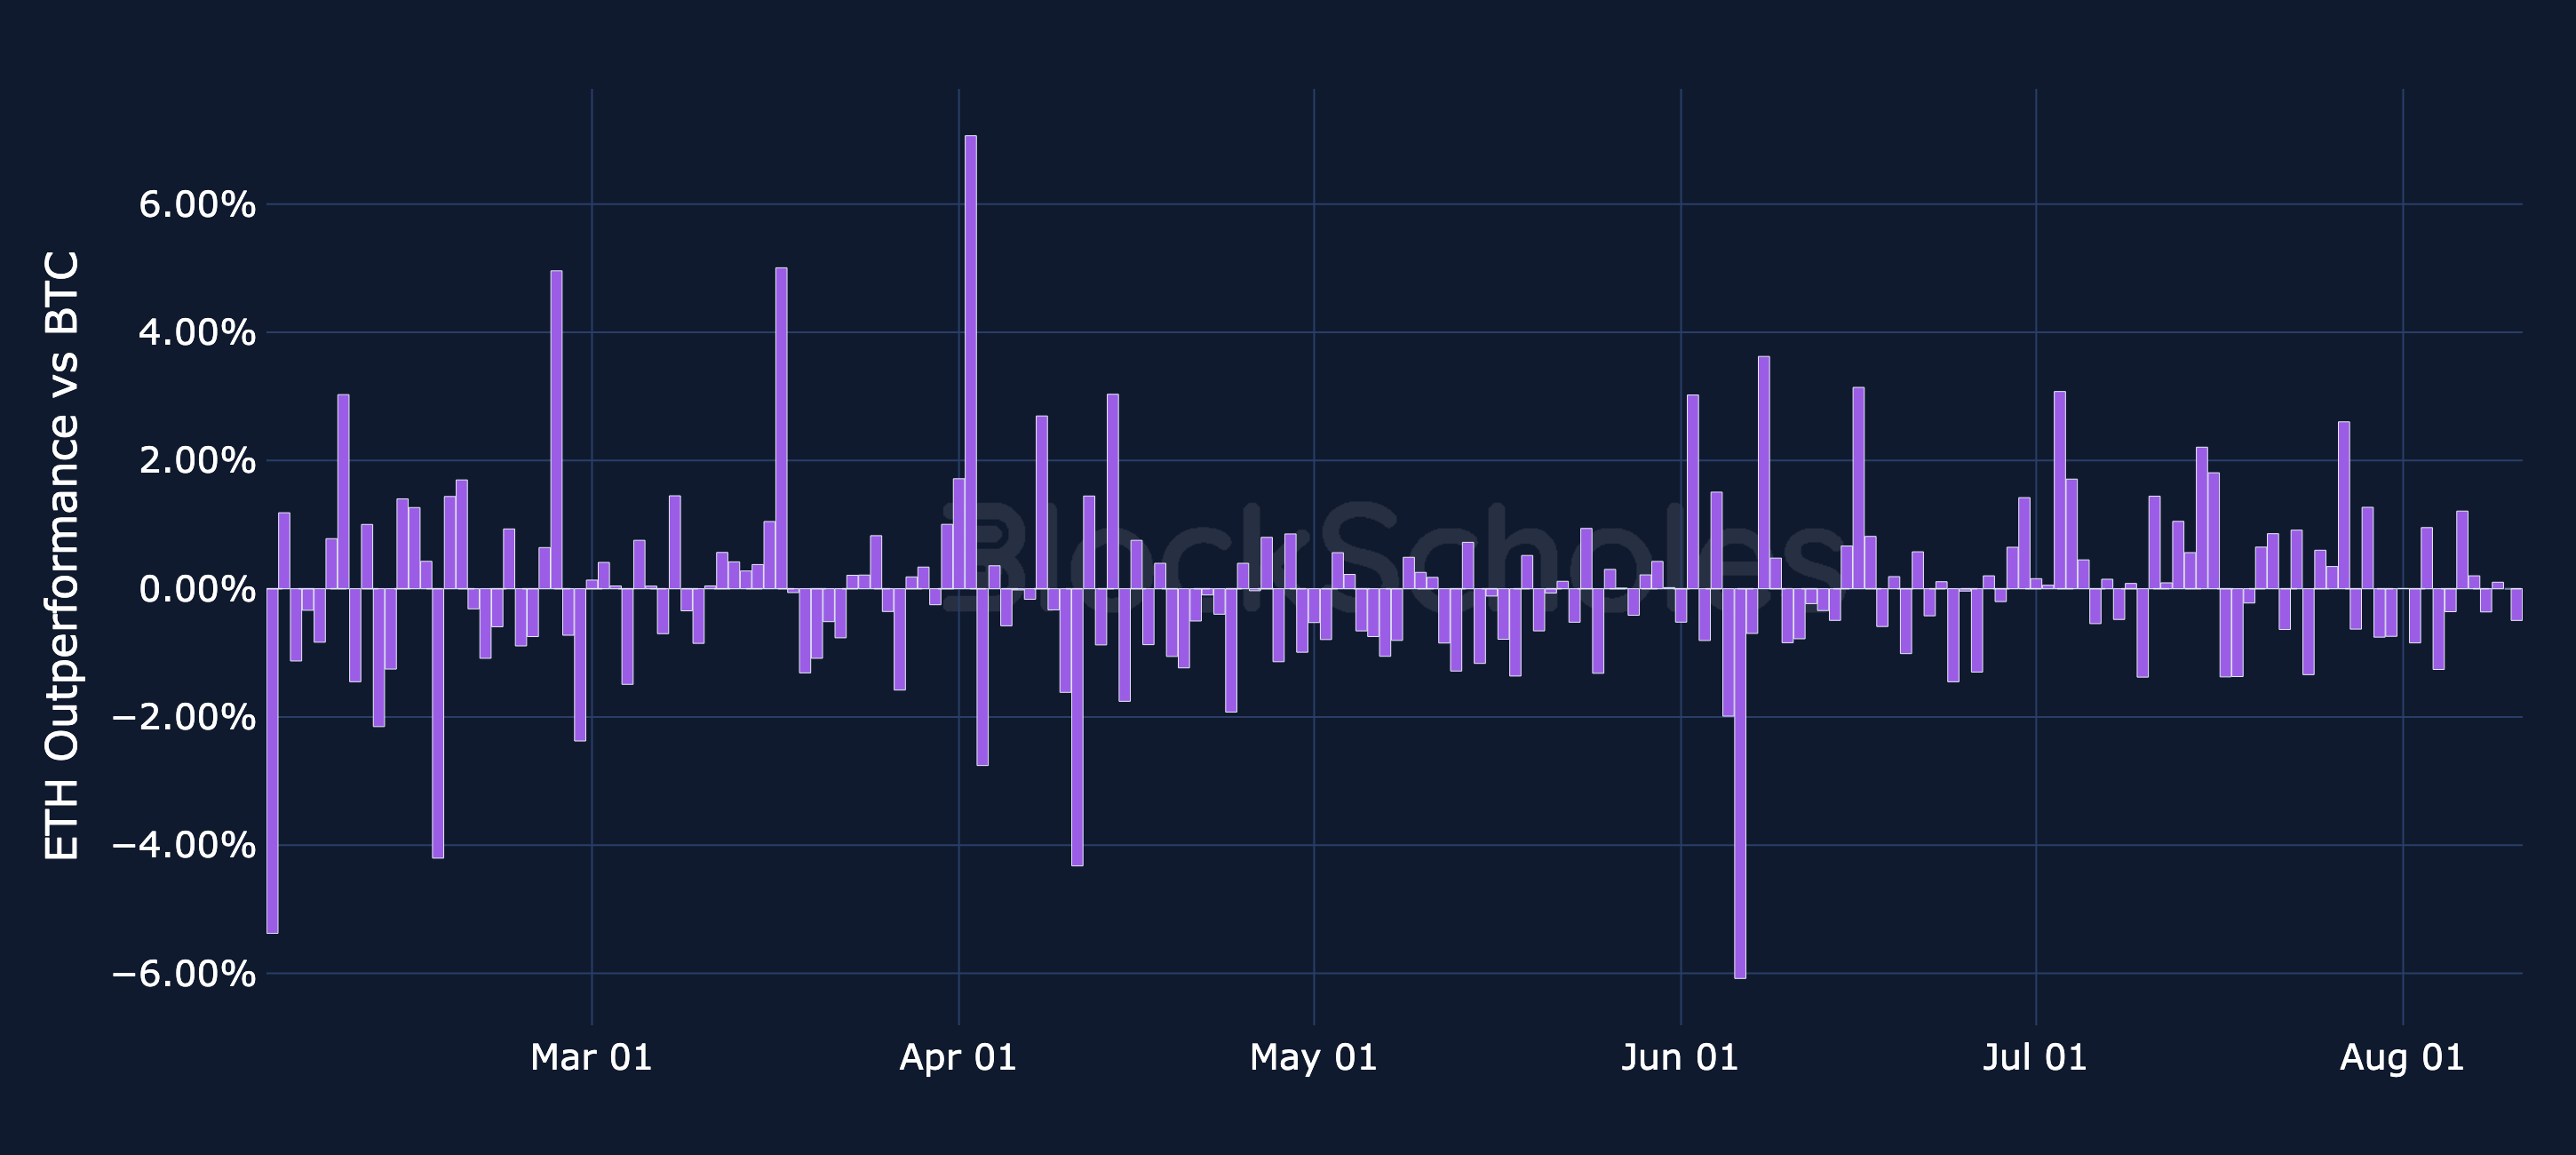
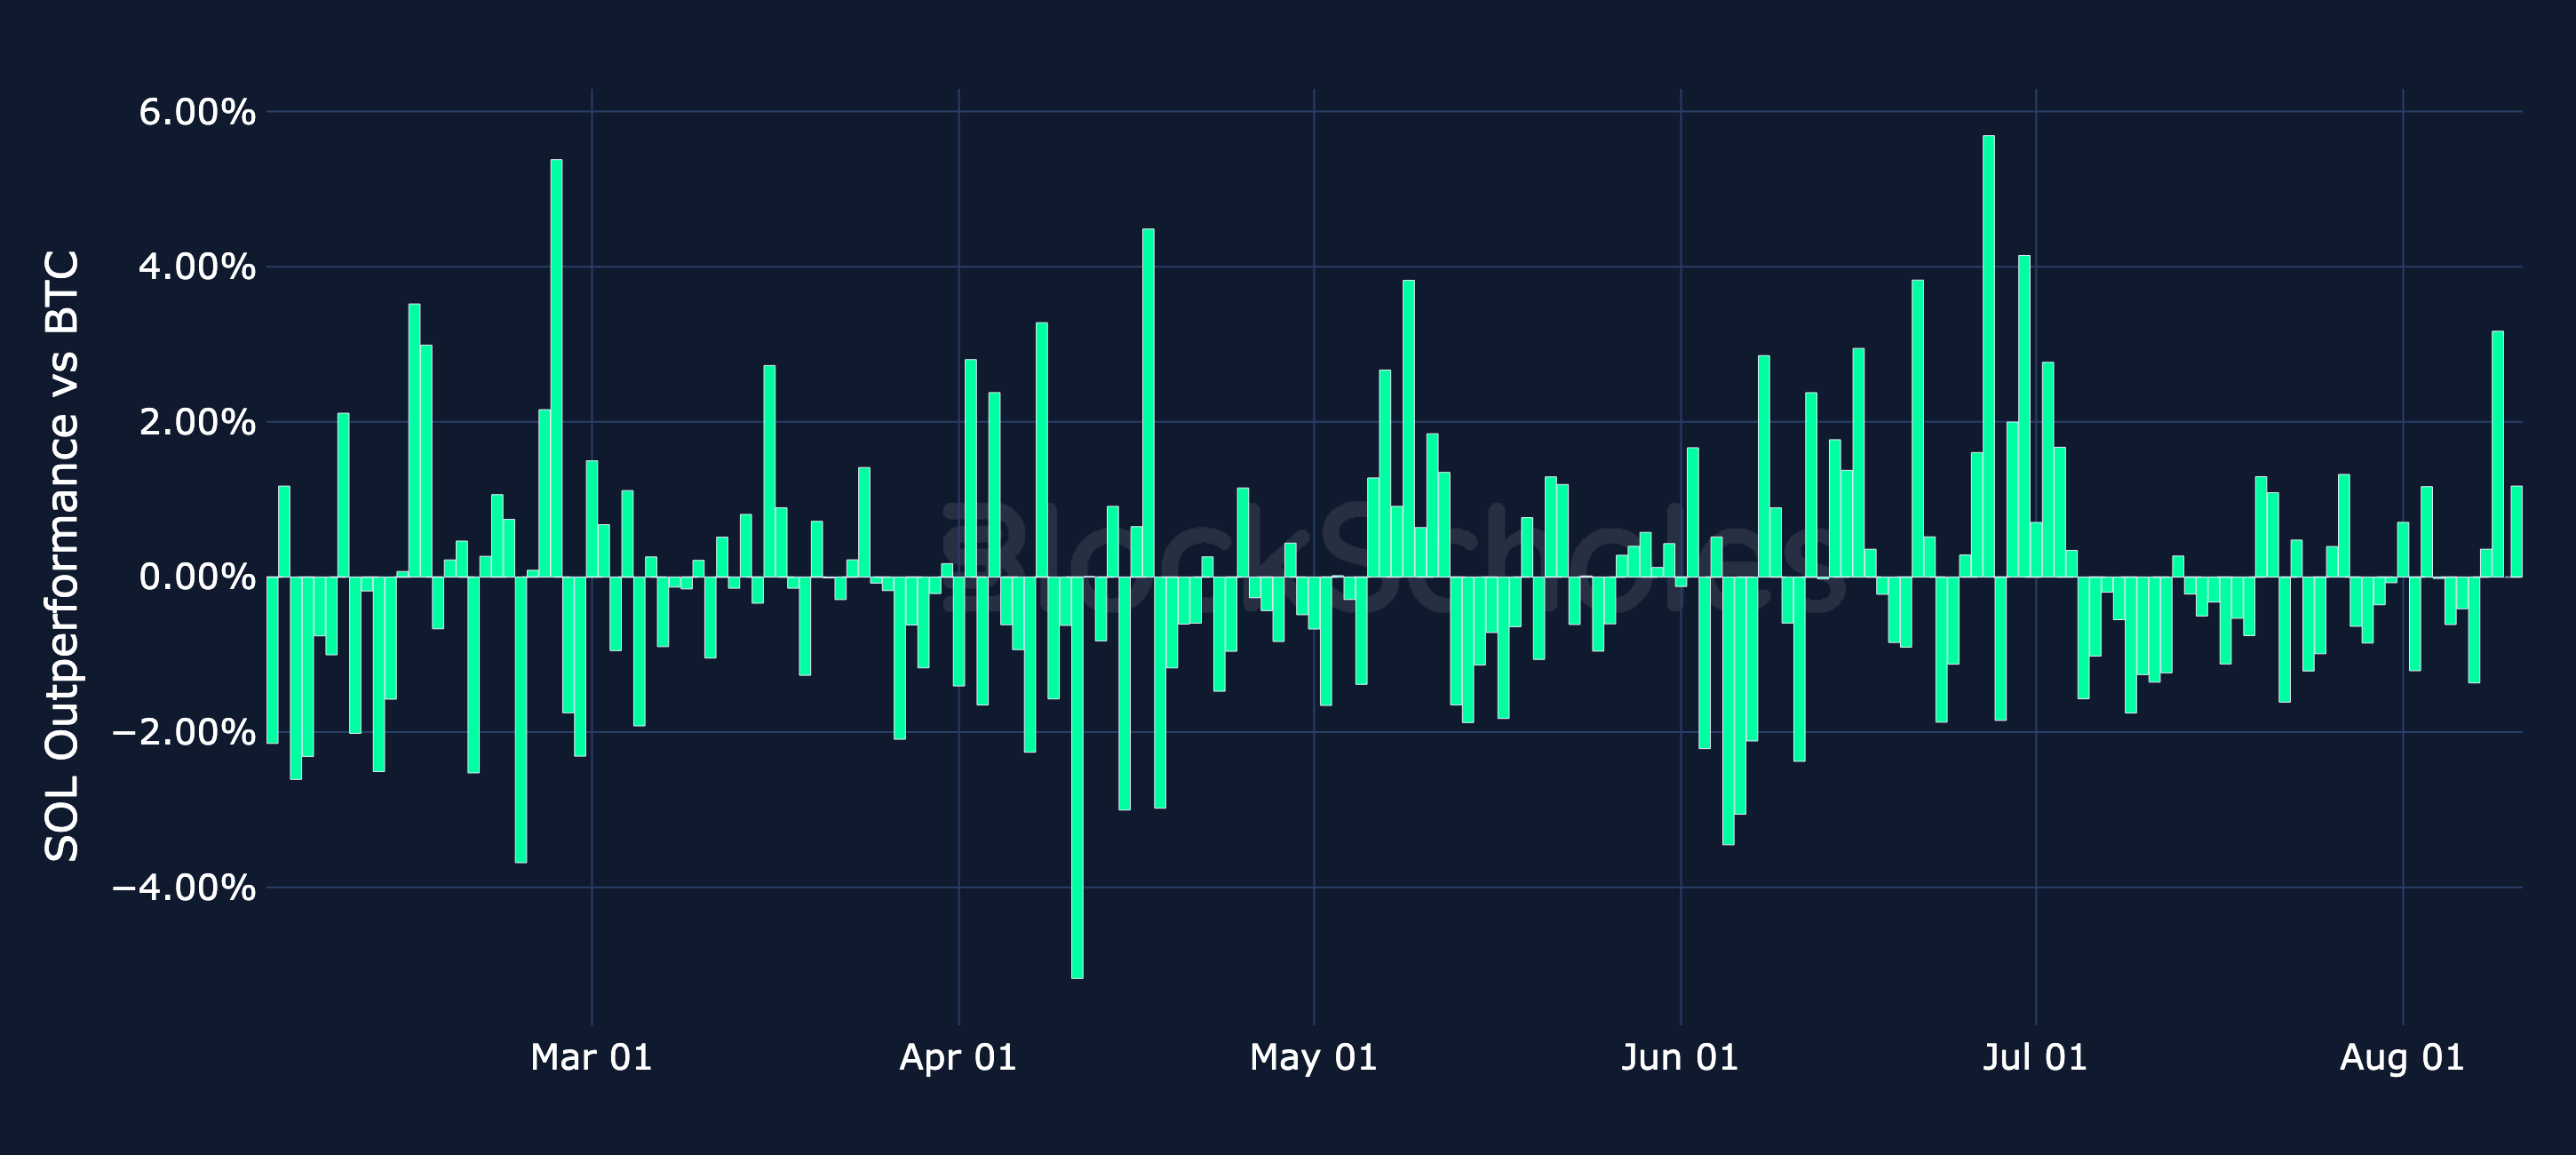
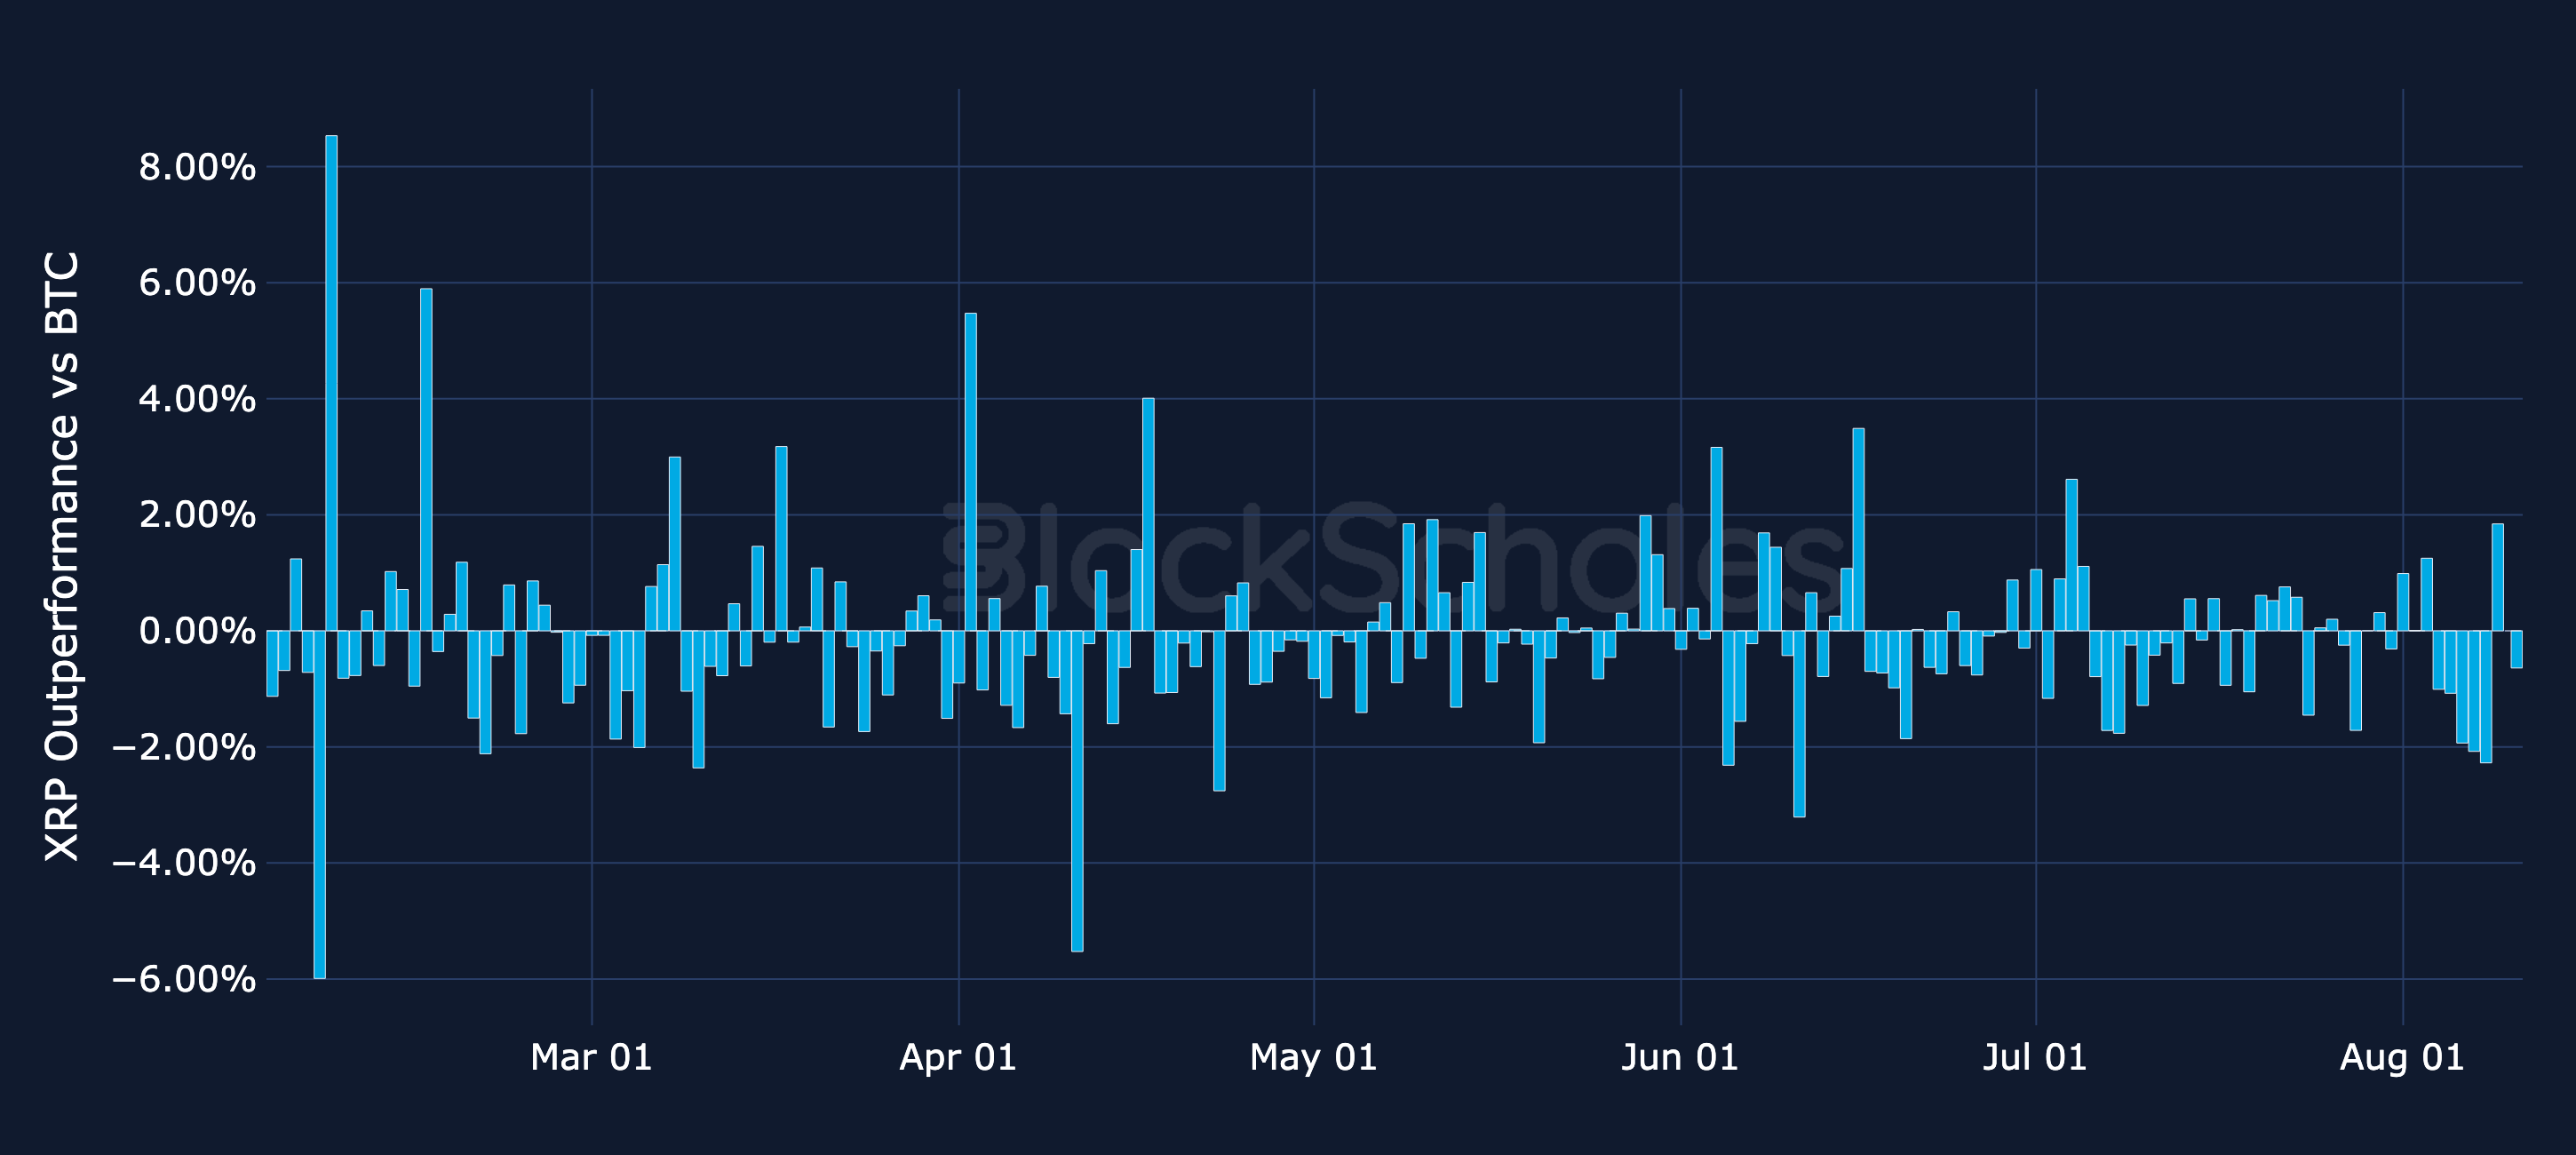
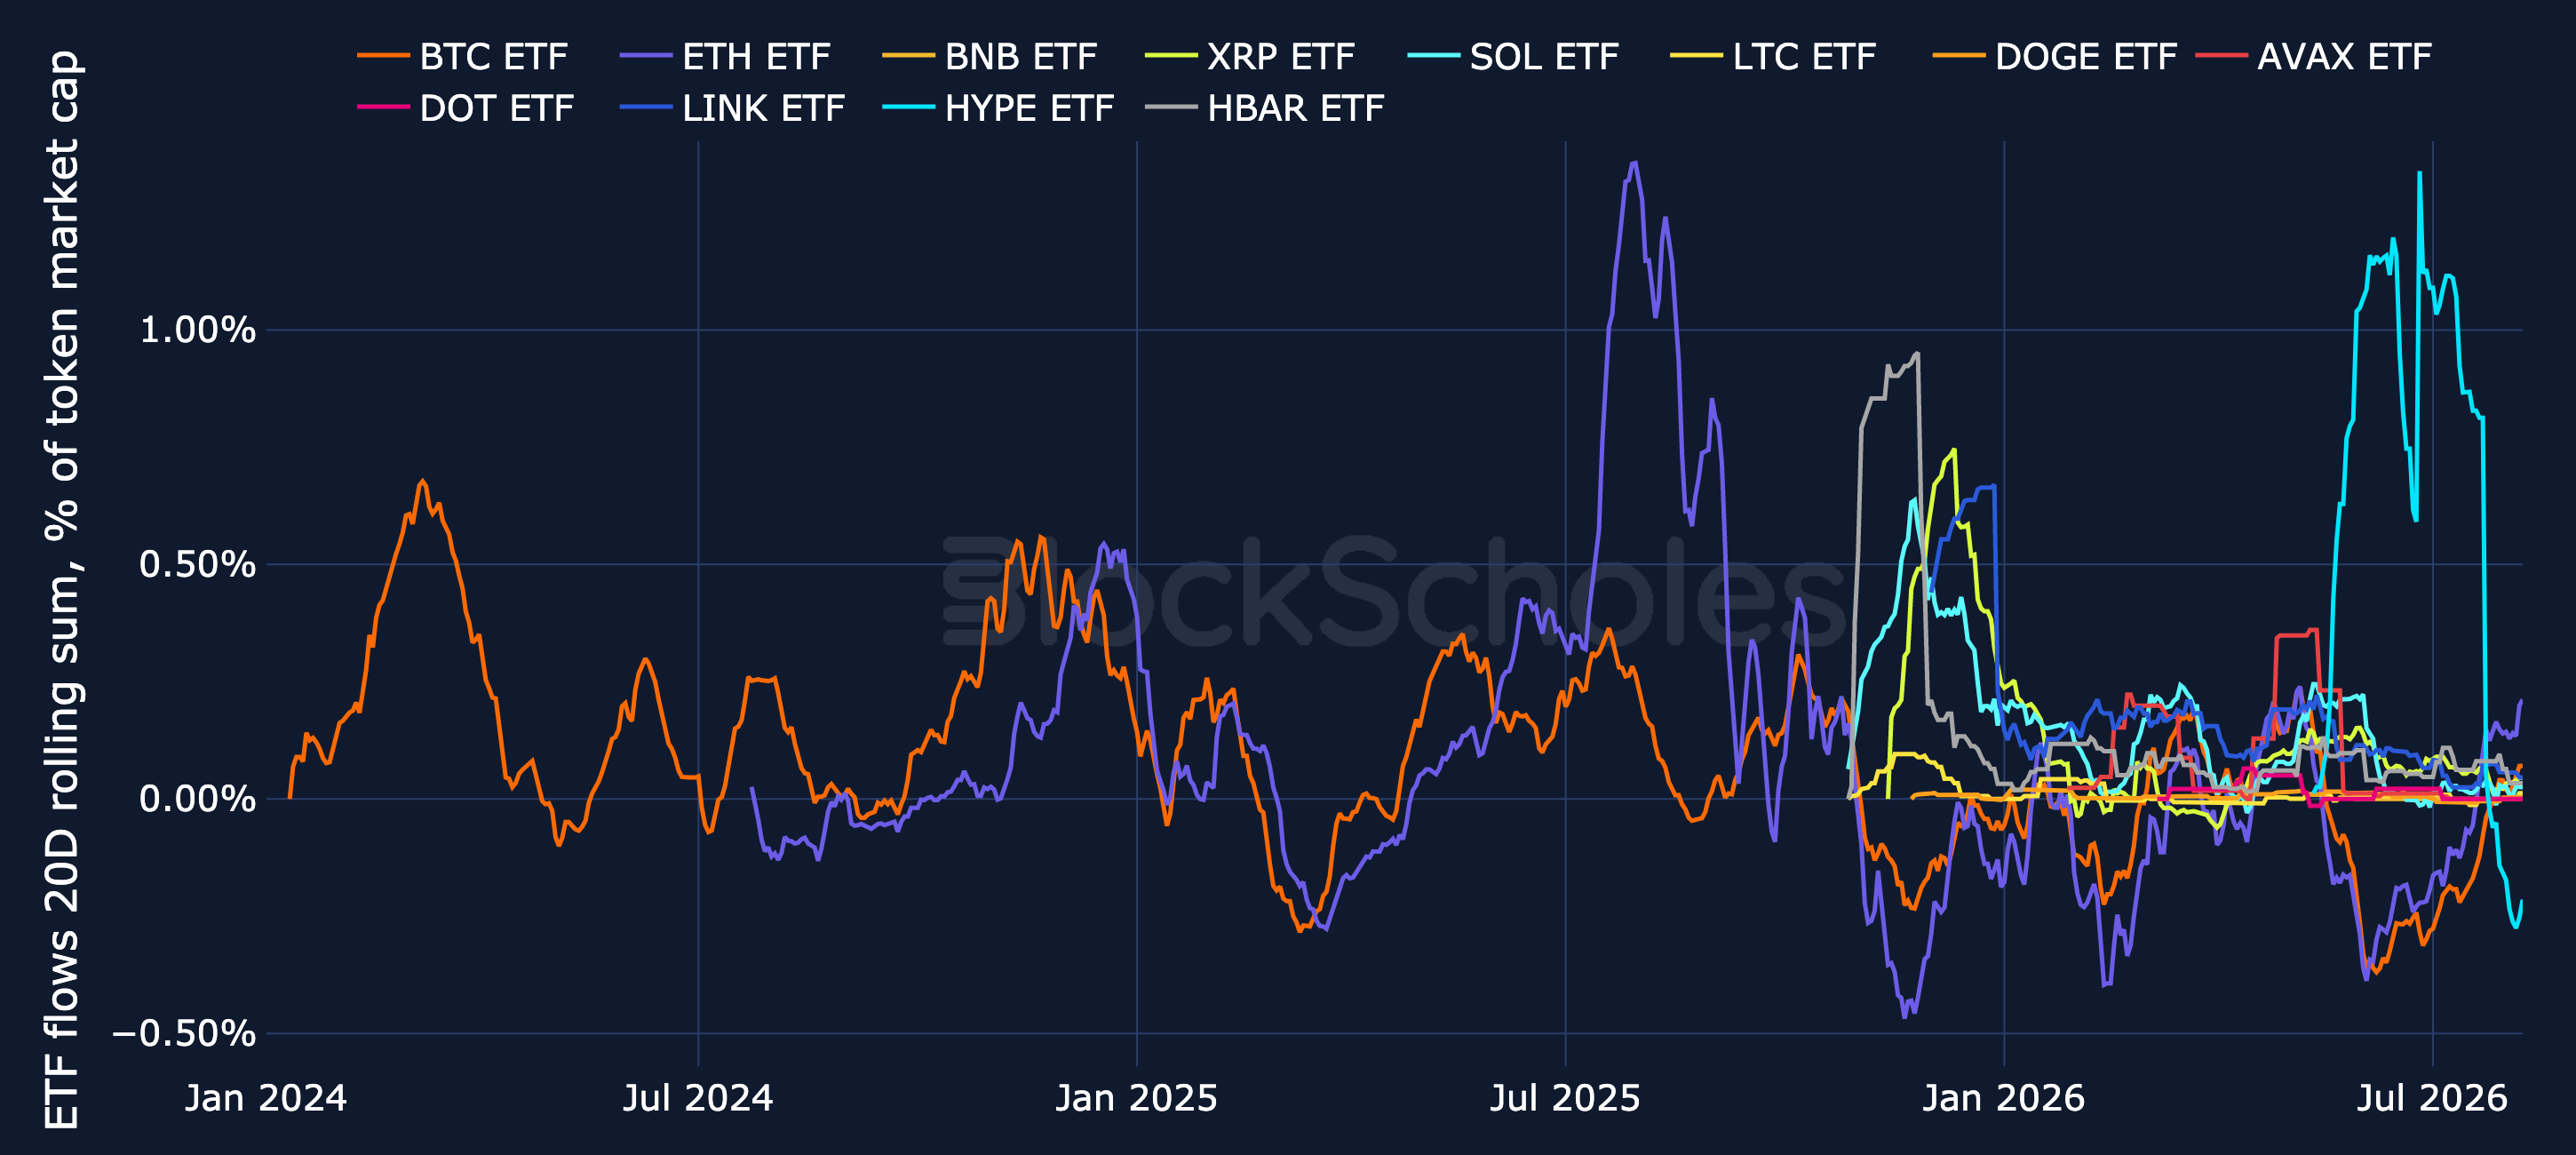
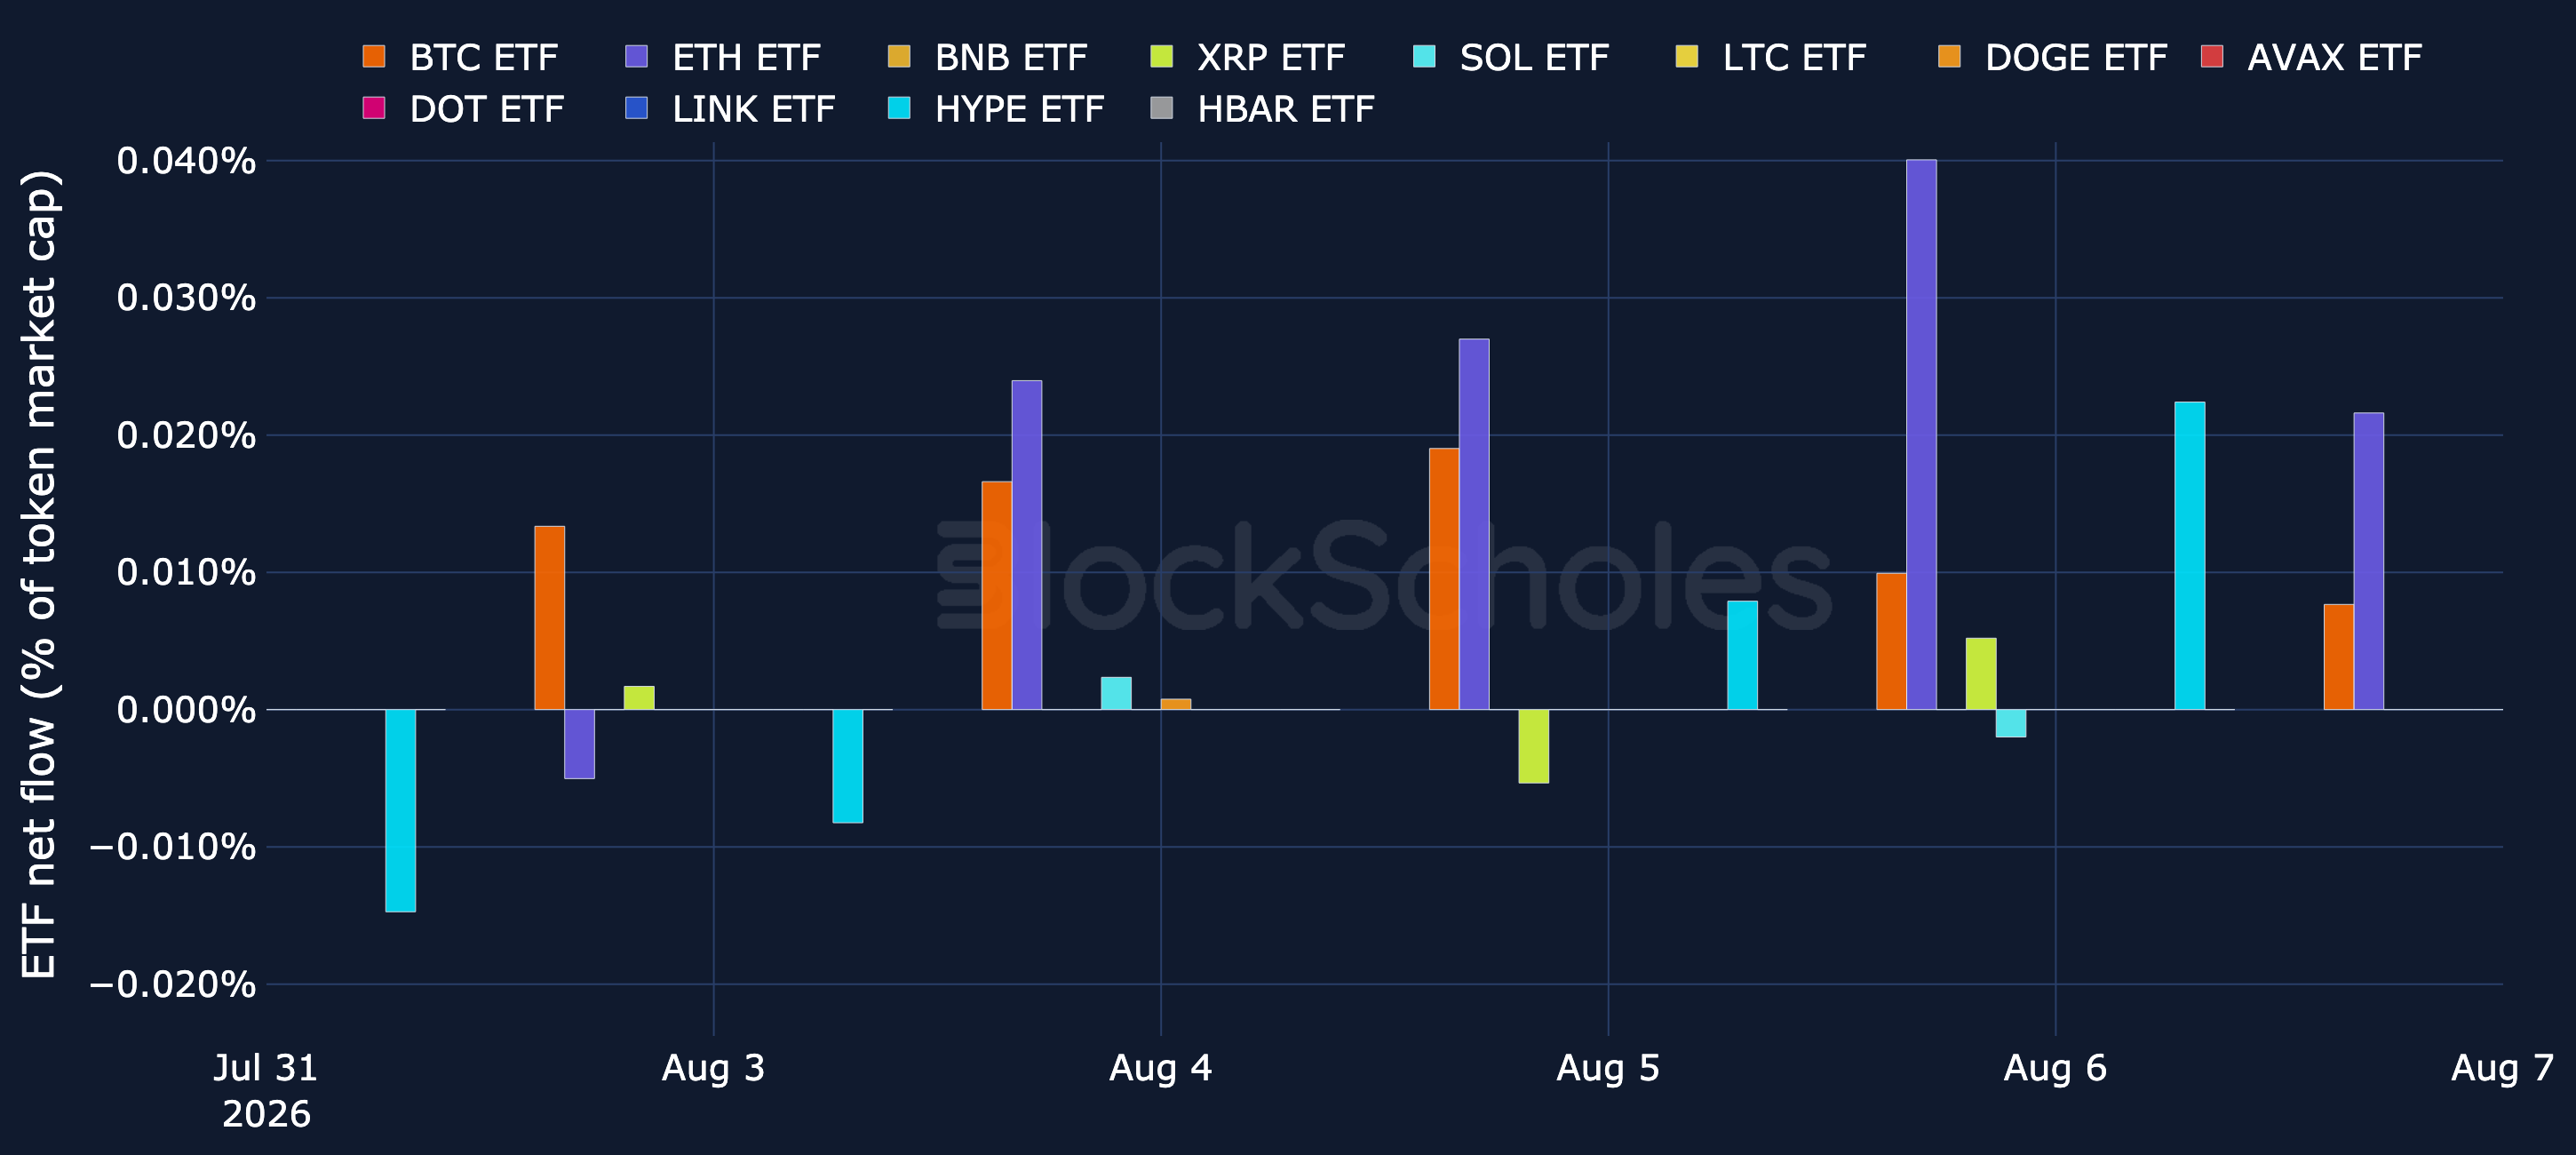
ETF Flows – BTC ETFs remain in a net-outflow regime. In the 64 trading days since cumulative flows peaked on 6th May, spot BTC ETFs have posted net inflows on just 23 of them, shedding a cumulative $7.59B. The past week (3rd August–7th August) added $854M of inflows. ETH ETFs followed a similar path, shedding $731M over the same stretch, though flows turned positive in the past week with $245M of inflows.
Over the past week, altcoin ETFs showed a more mixed picture. HYPE led inflows at $2.84M, followed by XRP at $1.01M, SOL at $145K, and DOGE at $82.6K. HYPE, despite leading inflows, still saw 1 net-outflow session during the week.
Adjusted for market cap, LINK has the largest 20-day rolling ETF flow, at around 0.05% of token market cap (as of 7th August) — but that is a single $2.68M net inflow on 22nd July (more than the window's other inflows combined), LINK's 20-day rolling line will fall once that day drops out of the 20-day window.