
Thahbib Rahman
Research Analyst
September was a month of two halves for BTC. A run of headwinds including a hawkish Fed, failure to advance the Clarity Act, and long-end US Treasury yields reaching 2007 level highs were only able to hold back spot prices in the first half of the month. Those factors all took place in what is, historically, one of BTC’s worst months of the year.

September was a month of two halves for BTC. A run of headwinds including a hawkish Fed, failure to advance the Clarity Act, and long-end US Treasury yields reaching 2007 level highs were only able to hold back spot prices in the first half of the month. Those factors all took place in what is, historically, one of BTC’s worst months of the year.
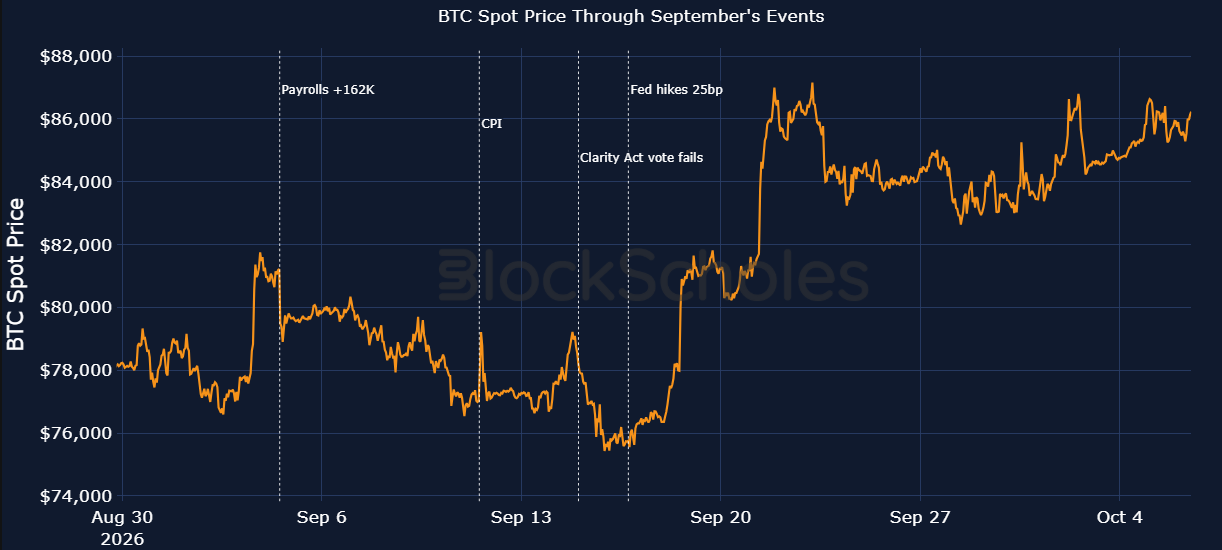
Markets entered September on the back of a hawkish Jackson Hole keynote speech from Fed Chair Kevin Warsh, who hammered home to investors that curbing inflation is the central bank's main goal. The macroeconomic data supported his comments — August payrolls released on Sept 4 showed the US economy added 162,000 jobs (vs expectations of 50,000), while the Sept 11 CPI report showed core prices rose 0.3% month-on-month (vs a 0.2% estimate).
By the middle of the month, the US Senate had failed to advance the Clarity Act and a day later, the Fed delivered on market expectations and raised interest rates by 25bps to 3.75%-4.00%, its first hike since July 2023, with the median participant pencilling in one more before year-end.
BTC bottomed out around $75K for the month between those two events, nearly 8% below the level it entered the month at. However, from the second half of September, spot price had cleared $87K, a level it last traded at on Jan 29, 2026.
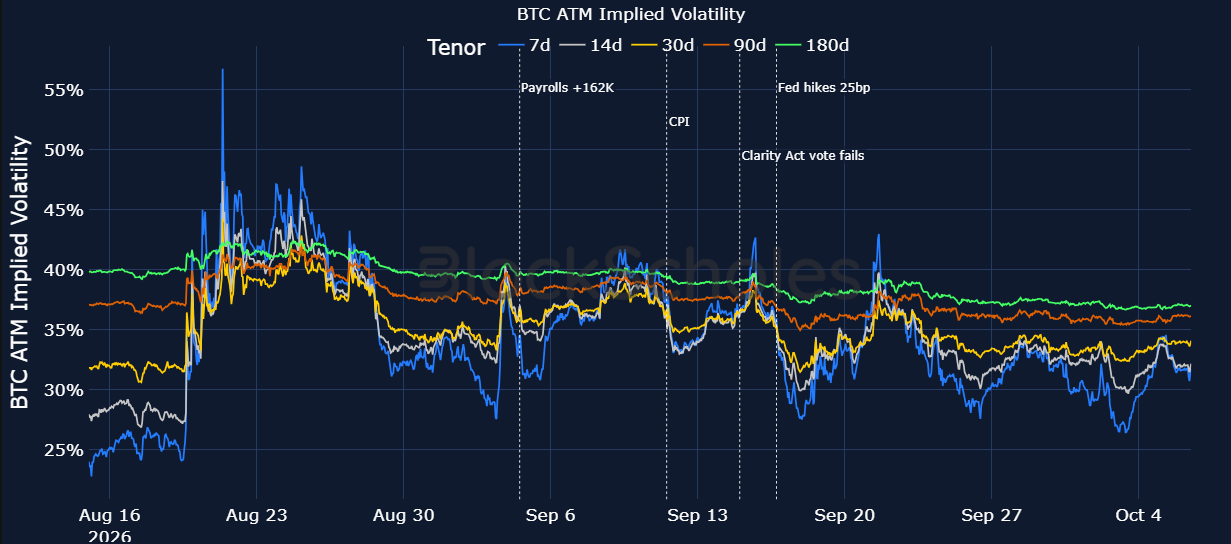
Through those series of events, September was still a relatively quiet month for options markets.
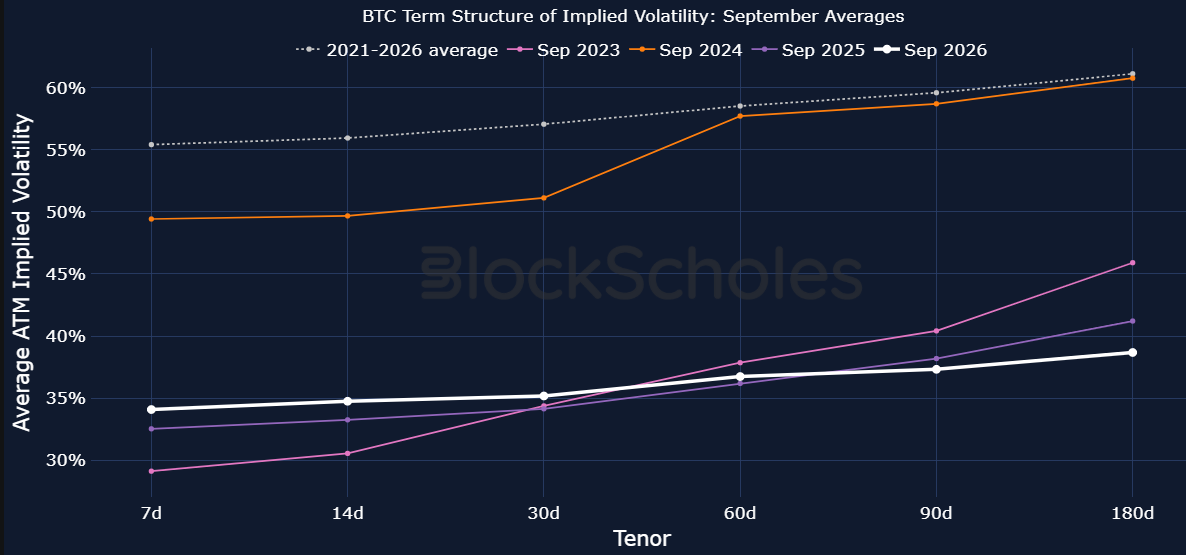
7-day at-the-money implied volatility averaged 34.0%. Its high for the month was 43.0% on Sept 21, well short of the preceding month’s 57.0% peak. The rest of the term structure barely moved too, with 30-day vol confined to a range of 31.5% to 39.0%. Further out on the curve, 180-day implied volatility averaged 38.7% over the month, making September 2026 the lowest month on record for 6-month BTC option-implied volatility over our entire sample period of 2021-2026.
The chart below takes the average level of implied volatility in September at each tenor and compares it to previous Septembers and to the historical average. The front of the curve looks much like the low vol periods of September 2023 and 2025. The difference is at longer tenors, where in those years, 6-month options traded 11.5 and 7.1 vol points above 1-month options respectively, while last month that gap was merely 3.5 points.
This is a surprisingly low level of volatility against the prevalent macro backdrop of the month, and that is best seen below.
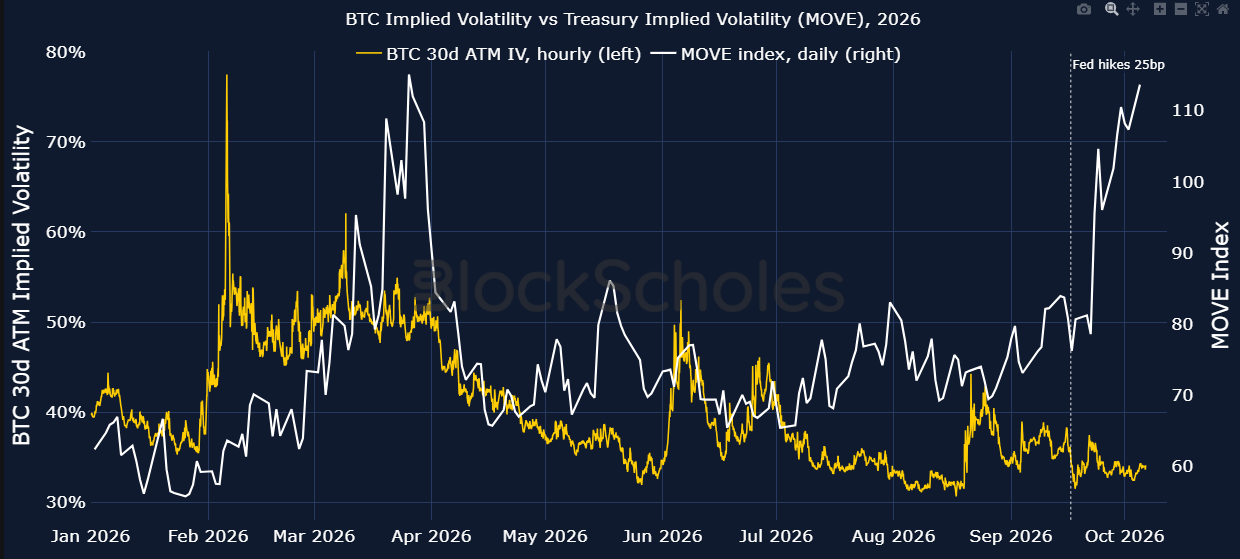
In the first half of the year at least, the volatility implied by 30-day BTC options tracked the MOVE index — a measure of short-term volatility expectations in US Treasuries. Longer-dated government bond yields surged in September, with the 10-year Treasury rising more than 50bps and closing at GFC level highs. Traders priced in high volatility expectations through the month, with the MOVE index climbing 47% in September to its highest level since the height of the US-Iran war in March — but the same was not priced into BTC options.
While the divergence in BTC options market volatility expectations from that of bond markets appeared to take place earlier in the year (around July 2026), unlike in the summer, September was a month that saw a much stronger negative correlation between BTC daily returns and daily changes in the 10-year US treasury yield. The correlation between the two was -0.47 in September, compared to -0.06 between January and August. That is, spot price had become more sensitive to the bond market at the same time its options market was pricing in less of the volatility that bond markets themselves expected.
The Fed's decision was arguably the most anticipated event of the month, and marked the central bank’s first interest rate increase in over three years.
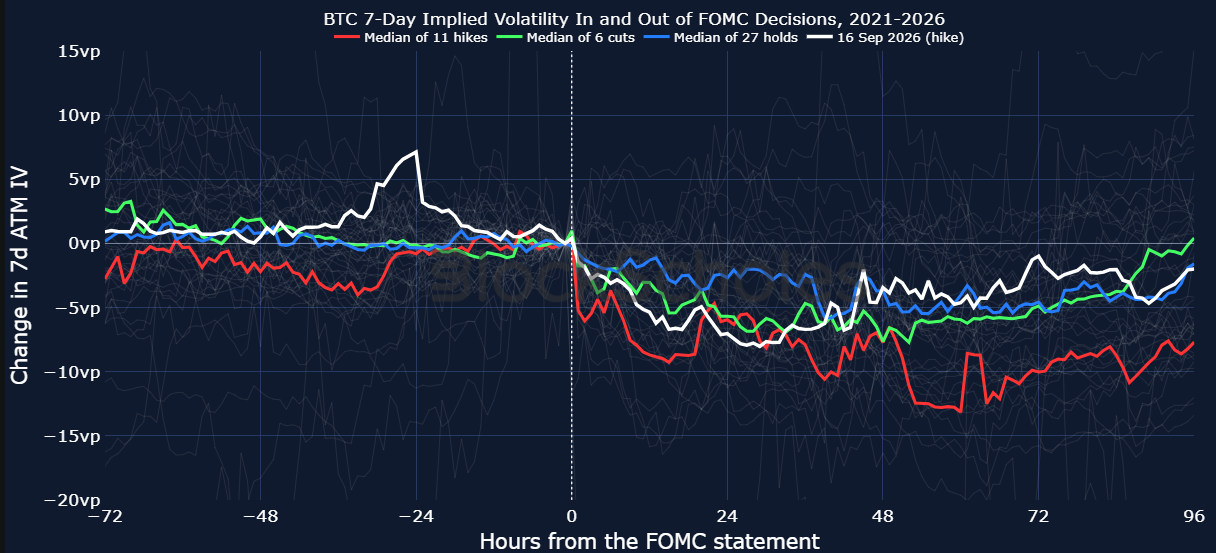
The meeting was priced by options markets as a modest event. Seven-day options carried the decision inside their window from Sept 9, and the only step up in implied vol over that week came on the day of the Clarity Act vote, when 7-day vol jumped from 36% to 42.7%. By the hour before Chair Warsh’s statement, it had faded to 35.6%. Comparing that with the 28.5% it reached a day later, the options market had attached a move of roughly 3% to the decision itself — in line with the median for a Fed meeting since 2021.
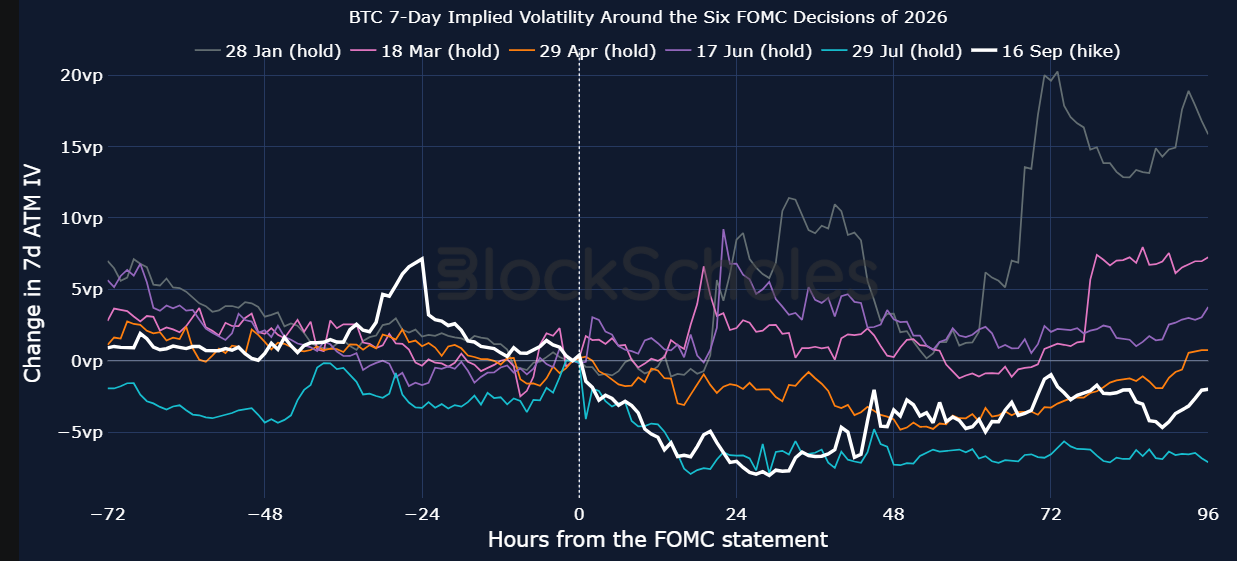
The decision ultimately delivered less of a move in spot price than what was implied by the market as spot price rose 1.2% over the 24 hours after the statement. 7-day implied vol dropped sharply by 7 points, the fifth-largest post-FOMC decline of the 45 meetings in our sample. This is a pattern that is common around Fed meetings — implied volatility has been lower 24 hours after an FOMC statement in 82% of meetings since 2021, with a median decline of 4 points, as the uncertainty of the event passes. The pattern is stronger for hikes than for holds or cuts: all 12 rate increases in the sample, including September, were followed by lower implied vol a day later.
August was the first month since September 2025 in which the 25-delta risk reversal turned positive at every tenor and September 2026 marked a continuation of that trend. The 30-day risk reversal was positive for 78% of the month, up from 33% of August, and September marked the first month since July 2025 in which 1-month skew had averaged a premium towards calls.
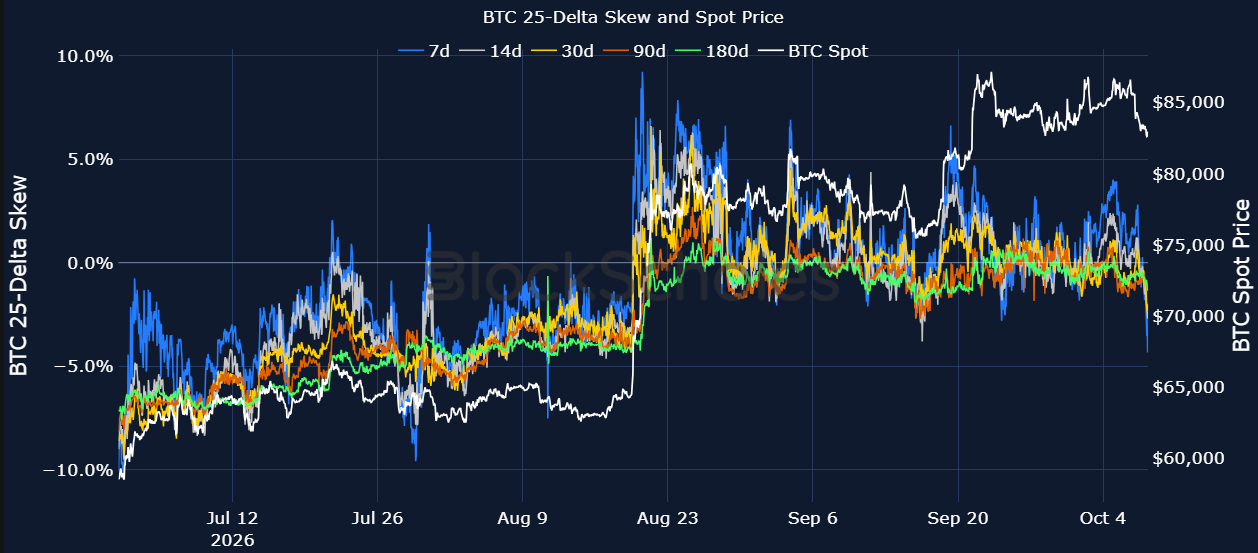
What’s interesting is how skew behaved in the first two weeks of the month, when spot price was selling off. Between the Sept 3 high and the Sept 15 low, BTC dropped 7.7% with the 7-day risk reversal averaging -0.9% and, at its most negative on the morning of the Fed decision, a modest -2.9%. Compare that to the first seven months of the year: in every period between January and July when BTC was down between 5% and 9% over 12 days, the 7-day risk reversal averaged -6.8%.
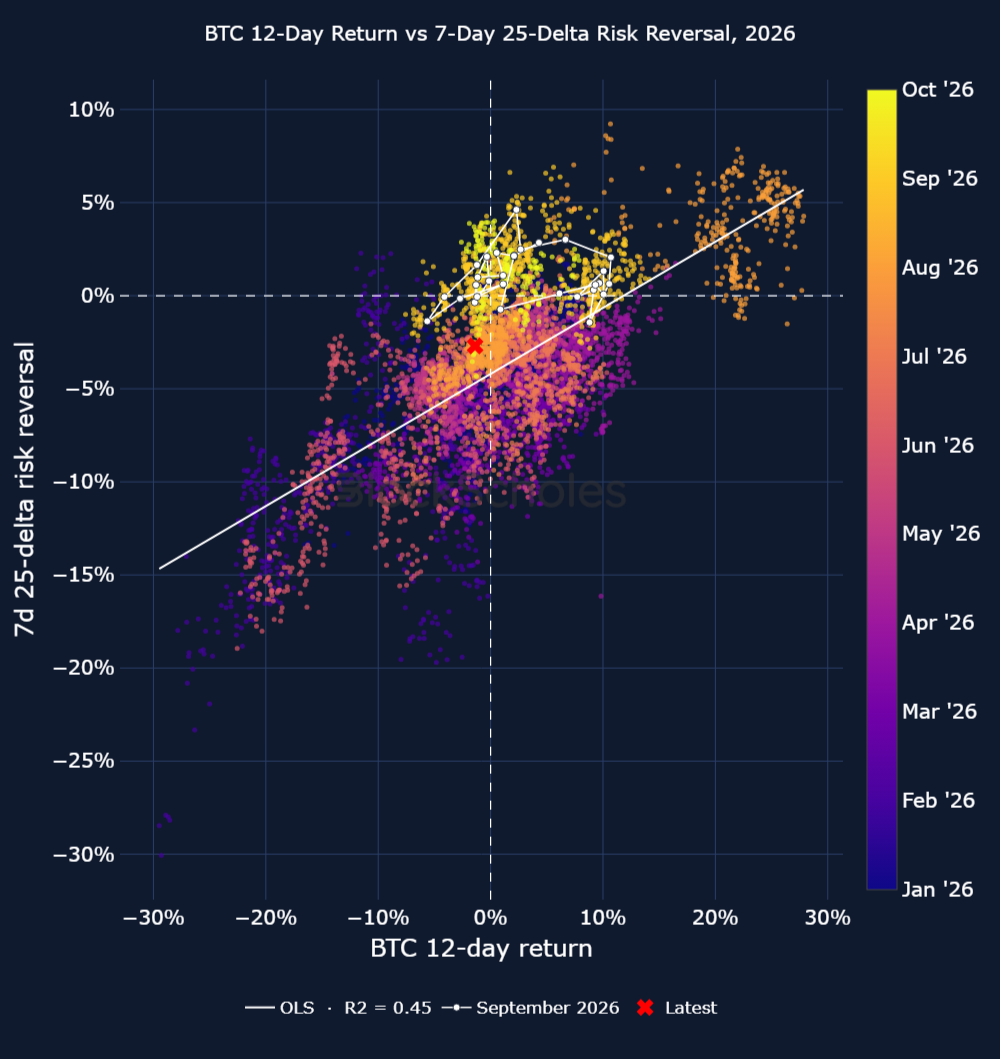
Then, as spot rallied in the second half of the month, skew followed it up but options traders did not chase the move as aggressively as we might have expected. The 7-day risk reversal peaked at +6.9% on Sept 3, when BTC first broke $81K, and at +6.6% on Sept 19 when it returned there. When BTC then pushed on to $86K-$87K, skew rose to +4.7% and had fallen back below zero within three days.
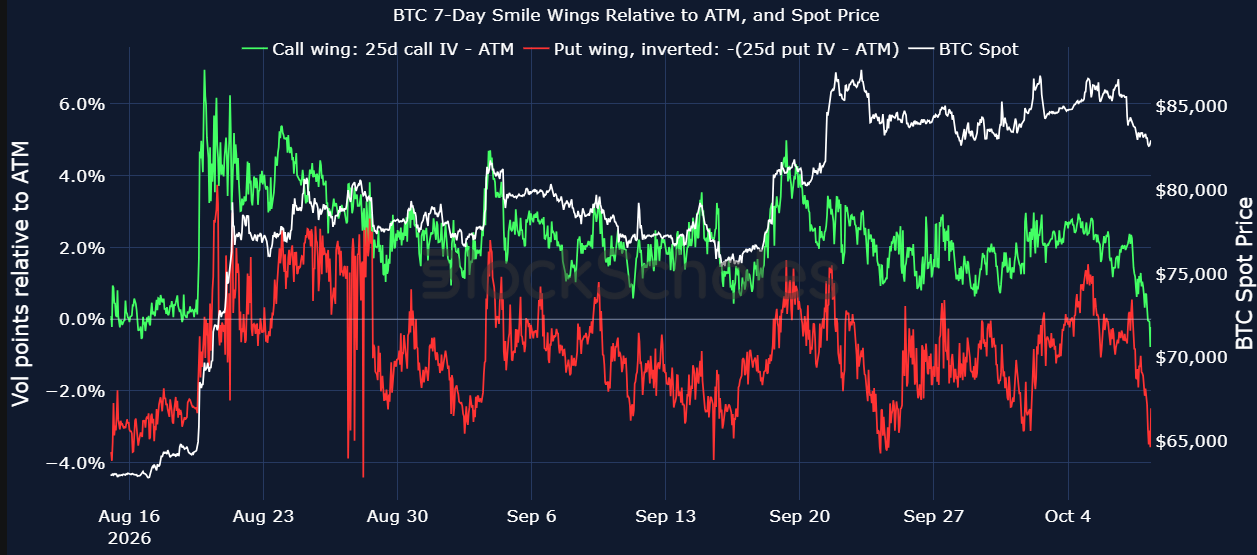
Decomposing the risk reversal into its two wings shows why. At $81K, 25-delta calls traded 3.7 vol points above at-the-money. At $86K, 6% higher, that premium had fallen to 2.8 points, and by Sept 25 it was 1.8 points. Over the same period the put wing went from trading below at-the-money to 2.3 points above it.
The premium for upside was highest during the breakout in spot, not at the local high, which may have been reflective of traders selling short-dated calls and adding downside protection into the gains rather than paying up for a continuation. That is also visible further out the curve, where the call premium has never fully taken hold. 90-day and 180-day risk reversals were positive for only 29% and 21% of September.
Nonetheless, taken together September marked a departure from the aggressive put buying bid that defined the first half of the year. Skew did not massively turn negative during the spot drawdown, and held a premium towards calls through a rate hike and a failed Senate bill.
Using monthly closes back to 2014, October has been BTC's strongest month of the year on both an average and a median basis, with a median return of 12.9% and gains in 9 of 12 years.
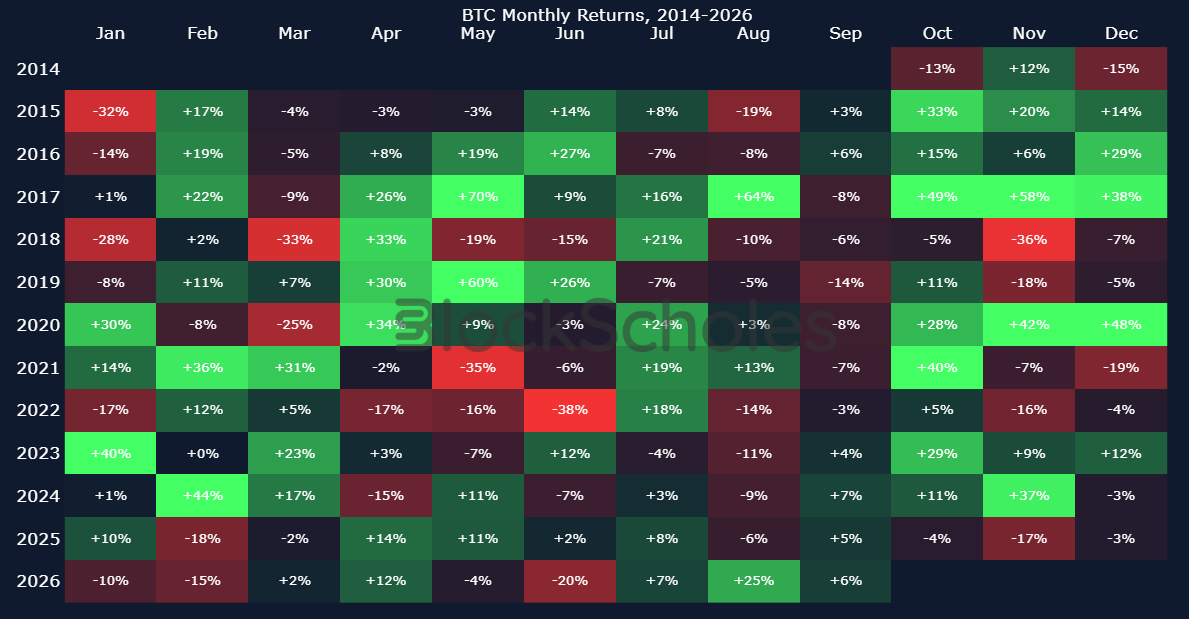
The fourth quarter as a whole has also been its best, with a median return of 26.6% against 7.4% for the next-best quarter. That comes with two caveats: Q4 is also the quarter with the largest spread of outcomes: it has been positive in 7 of 12 years, but the positive years averaged +92% while the negative ones averaged -22%. The second caveat is that the pattern failed last year, when October fell 3.9% and the quarter fell 23%.
The seasonality we observe in spot performance also applies to volatility. The summer lull in BTC implied vol has been followed by a sharp pickup in the fourth quarter in each of the last five years, and reasonably early in it: the first day on which 7-day vol traded 25% above its September average fell between Oct 11 and Nov 9 every year.
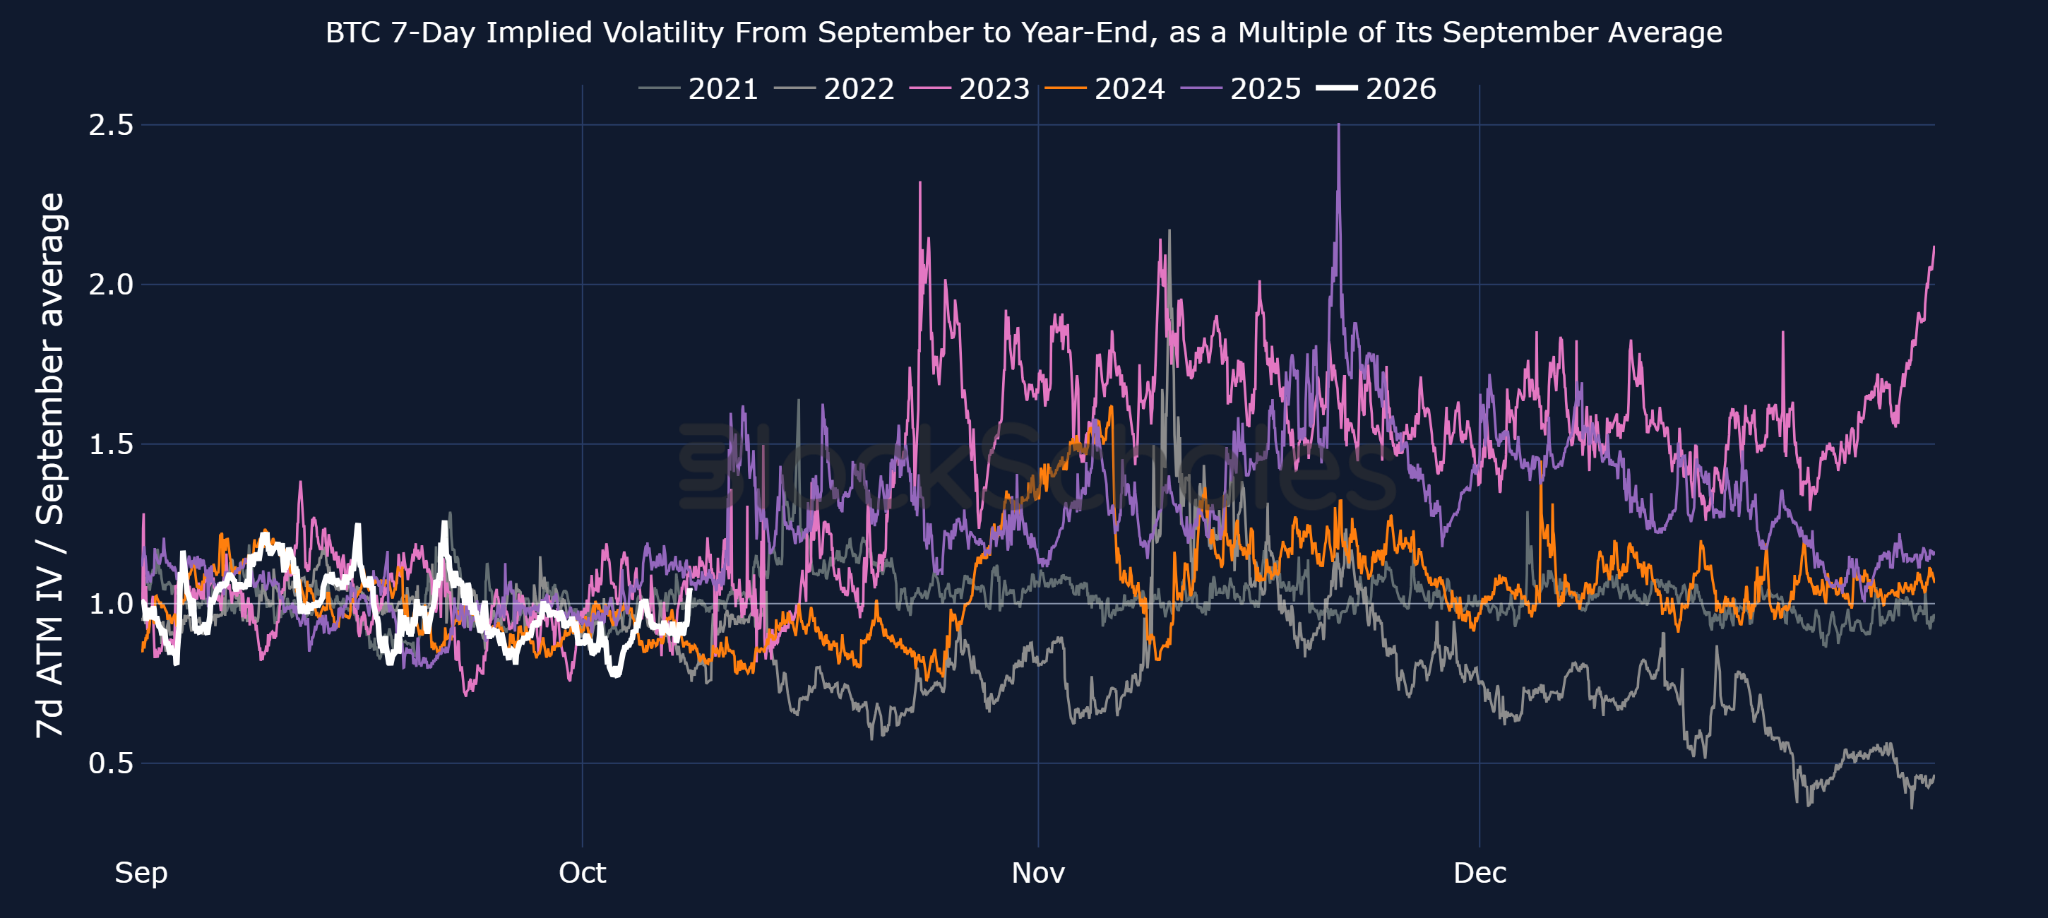
Each of those years had its own catalyst: the collapse of FTX in 2022, anticipation of spot ETF approvals in 2023, the US election in 2024 and October's liquidation cascade in 2025. This year's calendar is not short of candidates either, with two more FOMC decisions to go, an unresolved conflict in the Middle East and most importantly, the US midterm elections on Nov 3 that sits within the historical window in which vol has previously increased.