
Thahbib Rahman
Research Analyst
BTC volatility collapsed to year-to-date lows in July, with at-the-money implied volatility trading between 30-40% across the surface and 180-day IV printing levels seen on only six days since 2021. The summer lull was not confined to crypto: implied volatility in BTC and gold diverged from oil, where OVX repriced ~30 vol points higher on geopolitical headlines. Meanwhile a 7.4% BTC and 18.5% ETH spot recovery drove skew from a deep put premium into rare call-skewed territory, and a conditional study of 18 prior episodes shows that shift only precedes further outperformance when spot is trading well below its recent highs.

BTC volatility collapsed to year-to-date lows in July, with at-the-money implied volatility trading between 30-40% across the surface. This was the same range we saw BTC options trade at back in May 2026, though spot price then was comparatively much higher than it is today ($80K vs ~$65K).
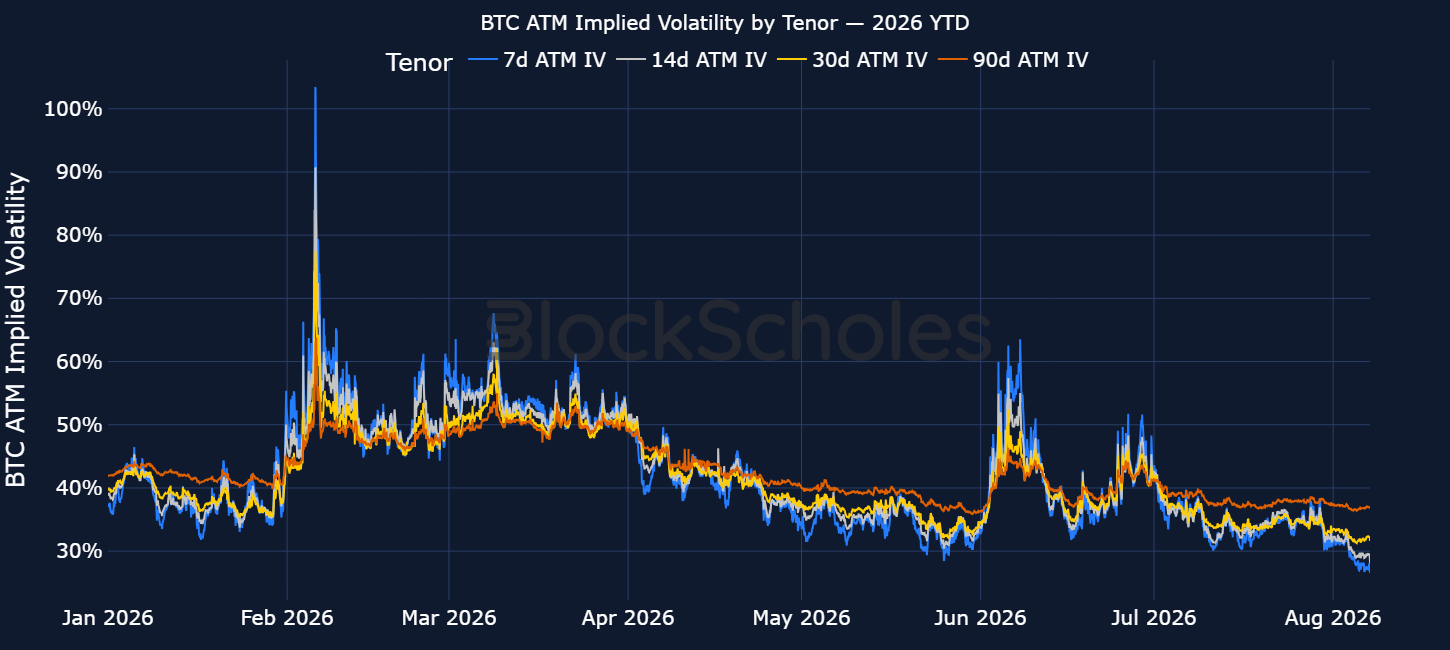
Figure 1: BTC at-the-money options’ implied volatility at several constant tenors. Sources: Block Scholes. Data behind this chart available via BlockScholes REST API.
Low volatility in July is a phenomenon we have observed since 2023 in previous years, both in delivered and implied measures of volatility. With the exception of a few cases, such as in June 2026 when Strategy announced it had sold a small portion of its BTC-stockpile and spot Bitcoin ETFs saw their longest streak of outflows on record, or August 2024 amidst the yen-carry trade unwind, summer months typically see the lowest volatility all year.
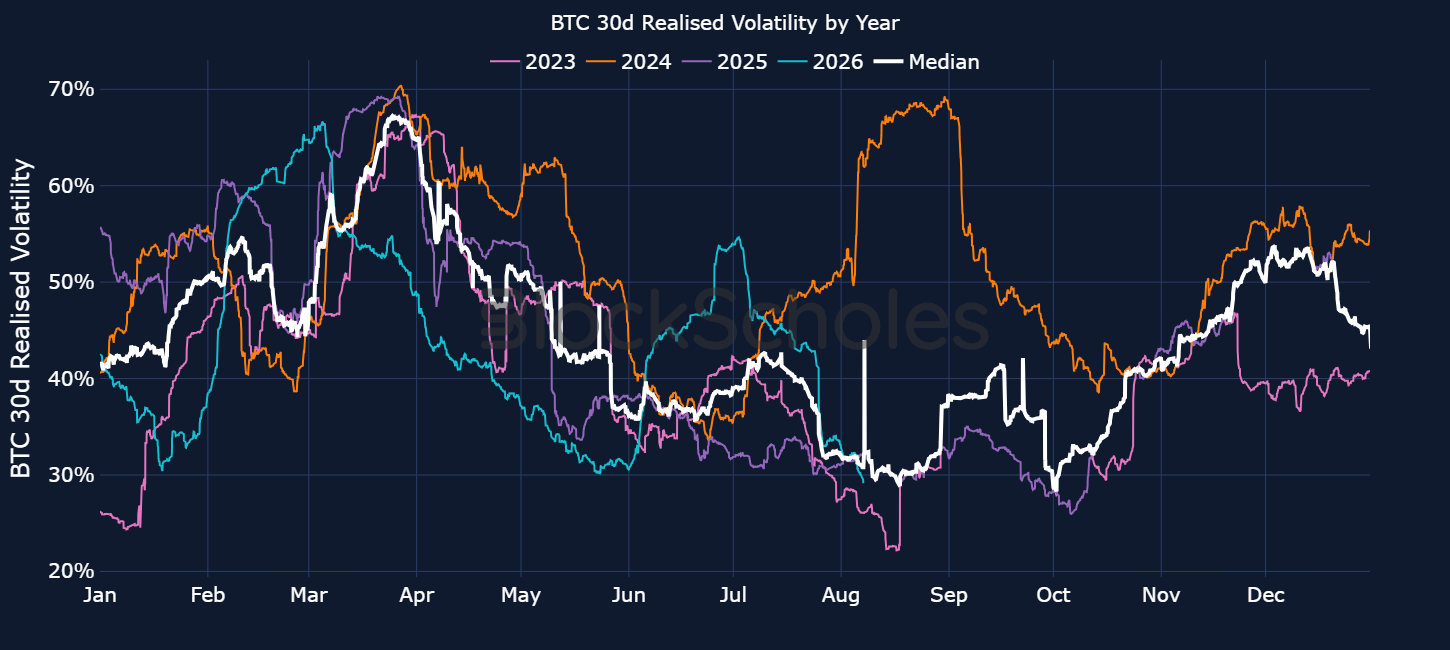
Figure 2: 30-day realised volatility on hourly returns categorised by year. Sources: Block Scholes. Data behind this chart available via REST API.
That’s not just in realised volatility either. The same seasonality trend appears in options markets: implied volatility rises through the first quarter of the year, sells off through the spring and then enters a summer volatility lull before rebounding through the third and fourth quarters.
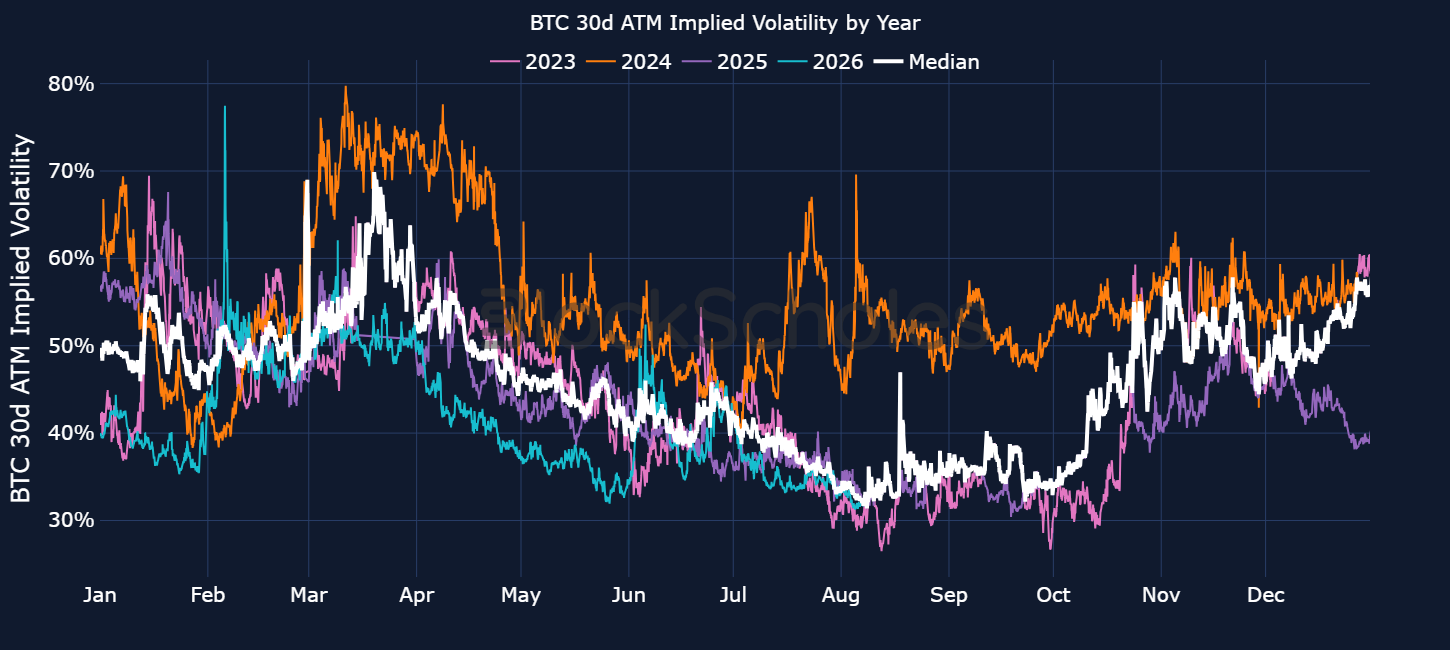
Figure 3: BTC 30-day at-the-money implied volatility categorised by year. Sources: Block Scholes. Data behind this chart available via BlockScholes REST API.
While implied volatility fell across the entire surface in July, it was most pronounced at the back end. Given where 7-day volatility traded through the month, implied volatility at longer tenors has only traded lower in one month over a 2021-2026 period, in August 2023 — another period of a summer volatility lull. The only six days in our data set when 180-day implied volatility closed below July's lowest daily print of 40.2%, was between 11 and 16 August 2023.
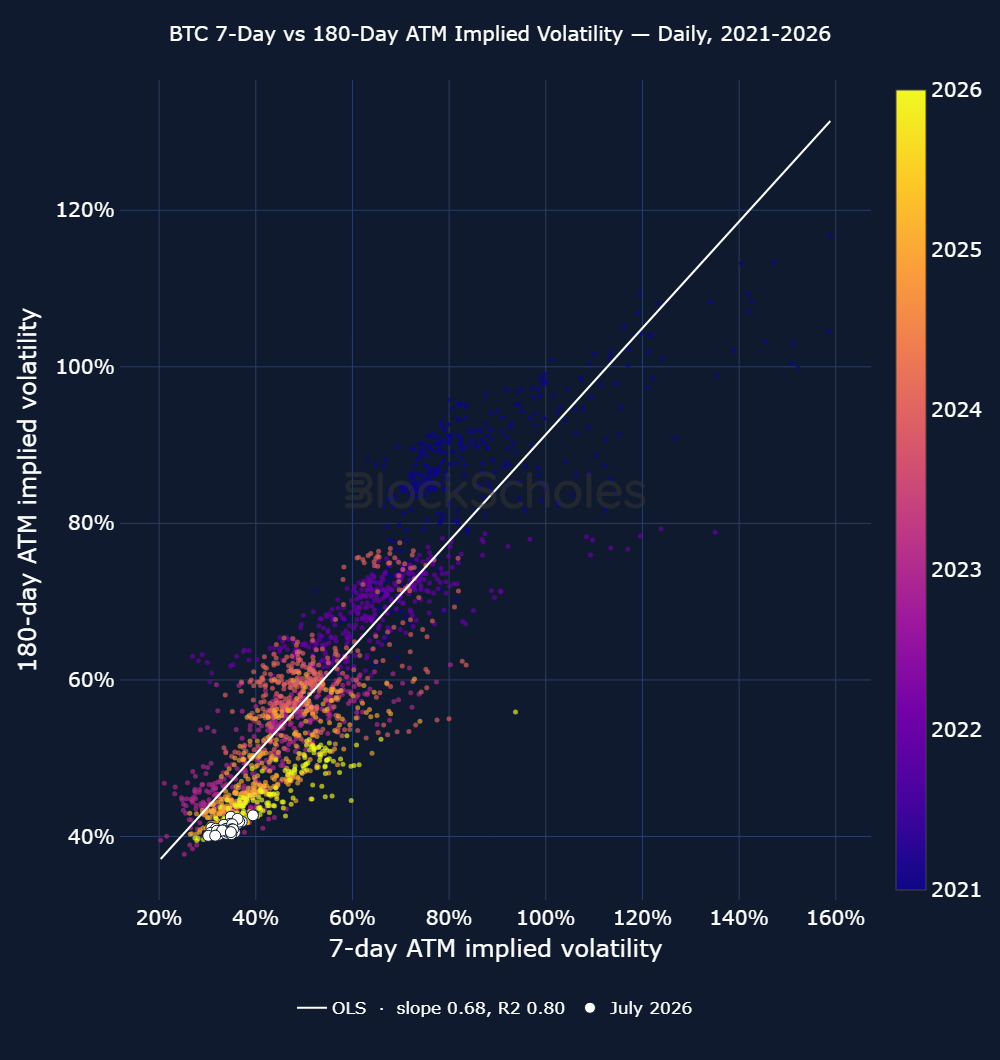
Figure 4: Scatter plot of 7-day BTC at-the-money implied volatility against 180-day at-the-money implied volatility, from 2021 to 2026. Sources: Block Scholes. Data behind this chart available via BlockScholes REST API.
This leaves the volatility market at an interesting juncture. The macro backdrop is considerably uncertain given a new Fed Chair in Kevin Warsh who is unwilling to provide forward guidance and continued geopolitical tensions, yet the forward-looking levels of volatility priced by options markets do not reflect this.
Looking at a basket of other macro assets provides supporting evidence that, unlike earlier in the year, volatility stemming from geopolitical tensions in July was mostly contained to oil and did not spread cross-asset.
We see this most clearly when comparing the 30-day at-the-money implied volatility of BTC options against 30-day OVX (crude oil) implied volatility. Options traders in oil did in fact react to every geopolitical development through the month. 30-day oil IV jumped nearly 30-vol points between the period when President Trump declared the June ceasefire “over” on July 7, 2026 and two-weeks of strikes on Iran by the US military. That was in strong contrast to late February when the Middle East conflict first began, and the volatility implied by both BTC and oil options markets spiked higher.
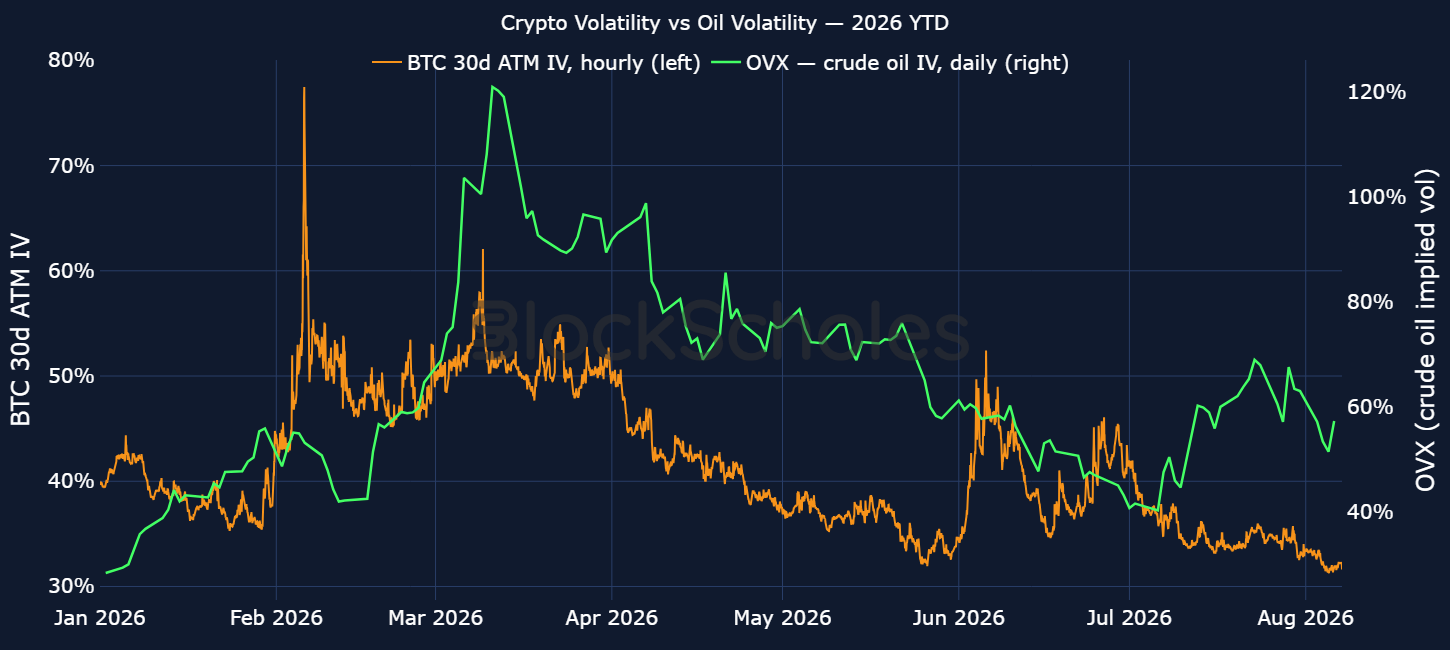
Figure 5: BTC 30-day at-the-money implied volatility (orange, left-hand axis) and oil OVX 30-day implied volatility (green, right-hand axis). Sources: Block Scholes, Bloomberg. Data behind this chart available via BlockScholes REST API.
Looking beyond BTC and oil, the traditional safe-haven and rate-sensitive asset gold spent most of the month consolidating sideways despite uncertain expectations for the July FOMC meeting and two-weeks of tit-for-tat strikes between the US and Iran. The first week of August however has seen gold respond more to the macro sensitivities it was more reluctant to react to in July. Spot gold is up more than 6%, supported by strong central bank and ETF buying as well as the market pricing out some expectations of a September FOMC rate hike.
While realised volatility in July was still above its 2000-2026 median of 15%, as spot price ranged between $4K and $4.1K through the month, realised volatility declined 10 percentage point decline from 30% down to 20% — and has only edged up once more in early August.
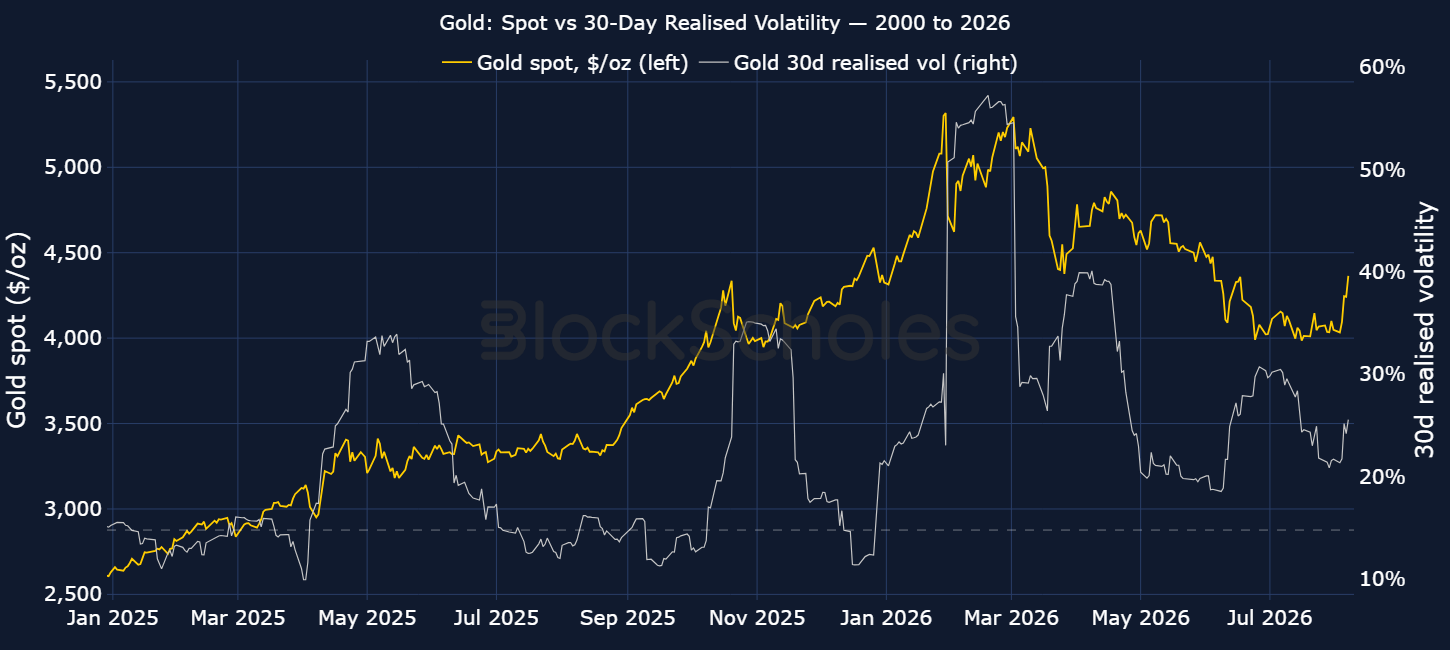
Figure 6: Spot gold price (yellow, left-hand axis) and 30-day realised volatility on daily returns (grey, right-hand axis). Horizontal dotted line represents median 30-day realised volatility since 2000. Sources: Bloomberg, Yahoo Finance.
Beyond altcoins, Block Scholes actively calibrates volatility surfaces on a universe of other tokens, including tokenised real-world assets. For example, in the chart below, we show the at-the-money implied volatility at several constant tenors for Tether gold (XAUT), calibrated from live listed-options across multiple venues including (Gateio, Bybit and Coincall).
Through July implied volatility sold off across the term structure, with 30-day implied falling from 25.3% to 20.9%, as options traders anticipated a continuation of the recently delivered range-bound spot trading.
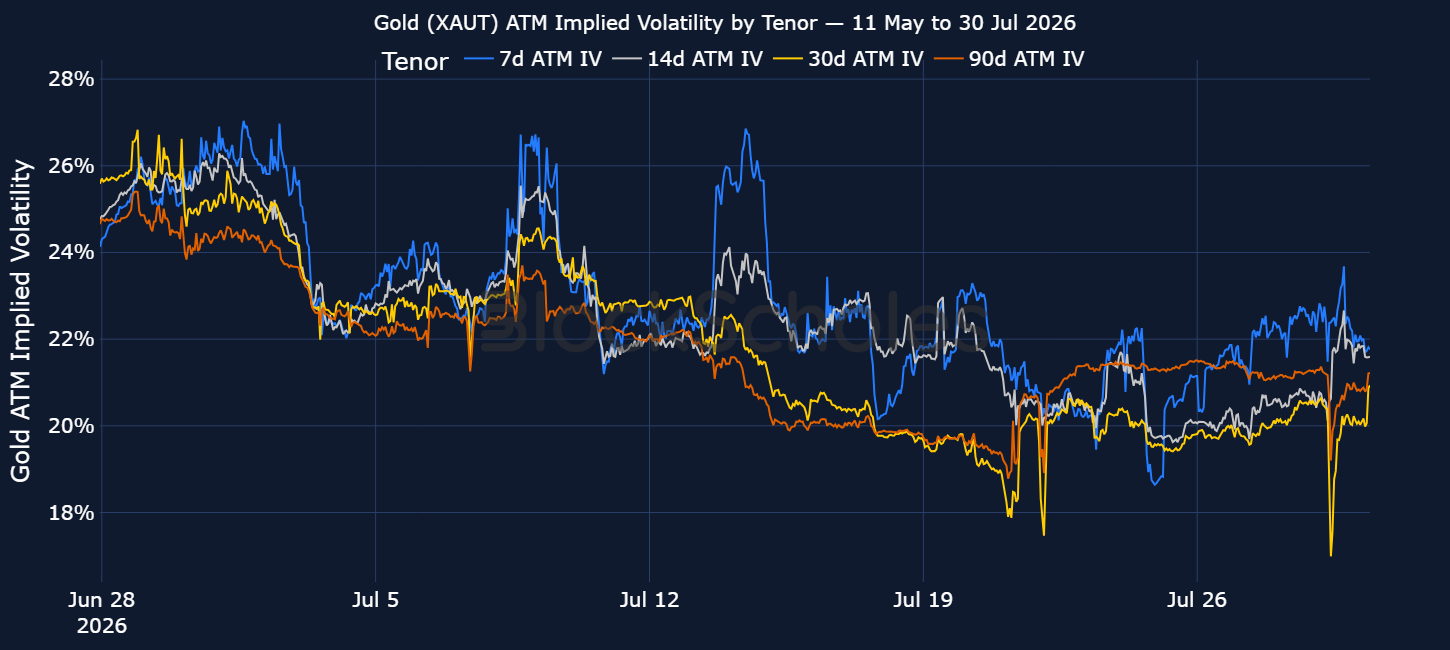
Figure 7: XAUT (Tether gold) at-the-money options’ implied volatility at several constant tenors. Sources: Block Scholes.
For US tech equities, July proved to be a risk-off month as the Nasdaq-100 declined 11% from its June highs and entered a ‘technical correction’.
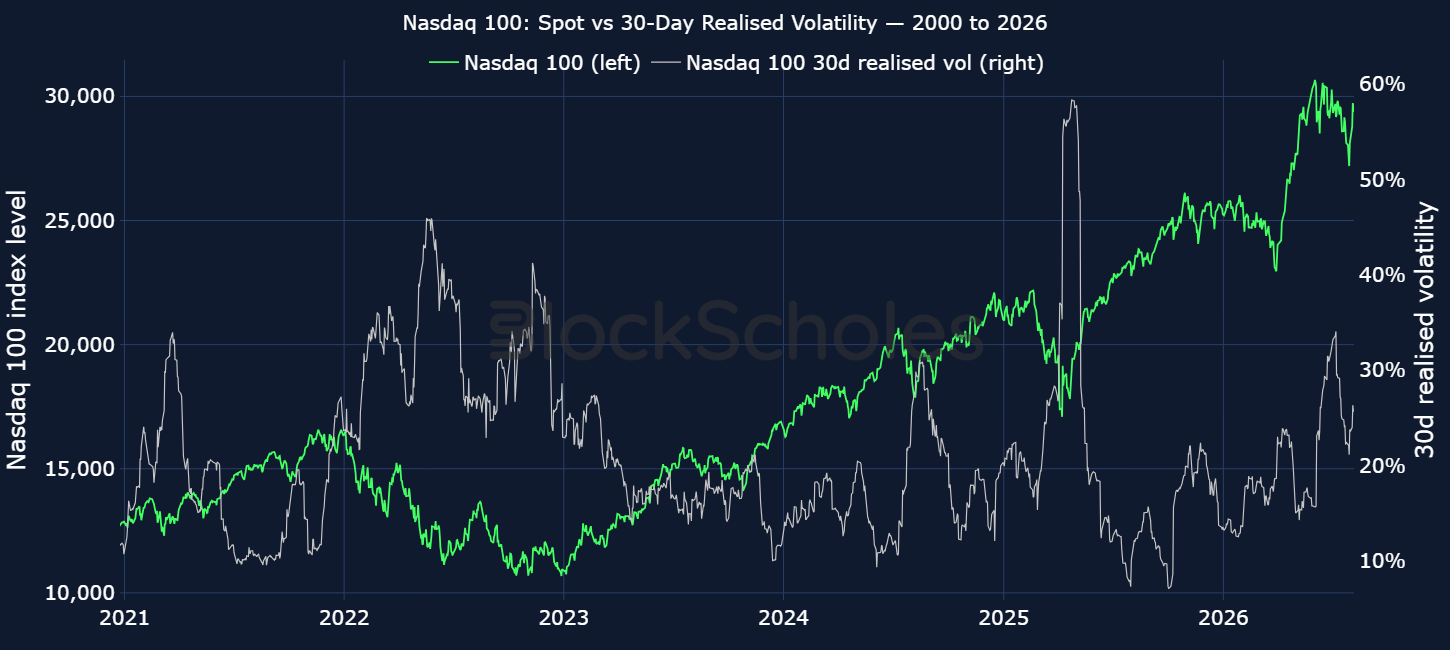
Figure 8: Nasdaq-100 price (green, left-hand axis) and 30-day realised volatility on daily returns (grey, right-hand axis). Sources: Bloomberg, Yahoo Finance.
Even then, the move lower in the Nasdaq-100 occurred with slightly less volatility than we've seen in other major selloffs since 2020. Back in April 2025 for example, the index fell more than 12% between April 2 and April 8, 2025 after President Trump’s Liberation Day tariffs announcement. On April 9, Trump then announced “THIS IS A GREAT TIME TO BUY”, dragging the Nasdaq-100 to close +11.4% in a single-day, recovering almost all of the previous week’s losses.
July marked a month of recovery in BTC and ETH’s spot price. BTC rallied 7.4% while ETH outperformed significantly — 18.5% over the same period. That move in spot markets was accompanied by an equally sharp recovery in put-call skew.
Not only did traders steadily reduce their demand for downside protection (pushing the 25-delta risk reversal from a deep put premium back towards neutral), July also marked one of only a handful of occasions this year when short-dated skew briefly shifted in favour of calls between July 21 and July 23.
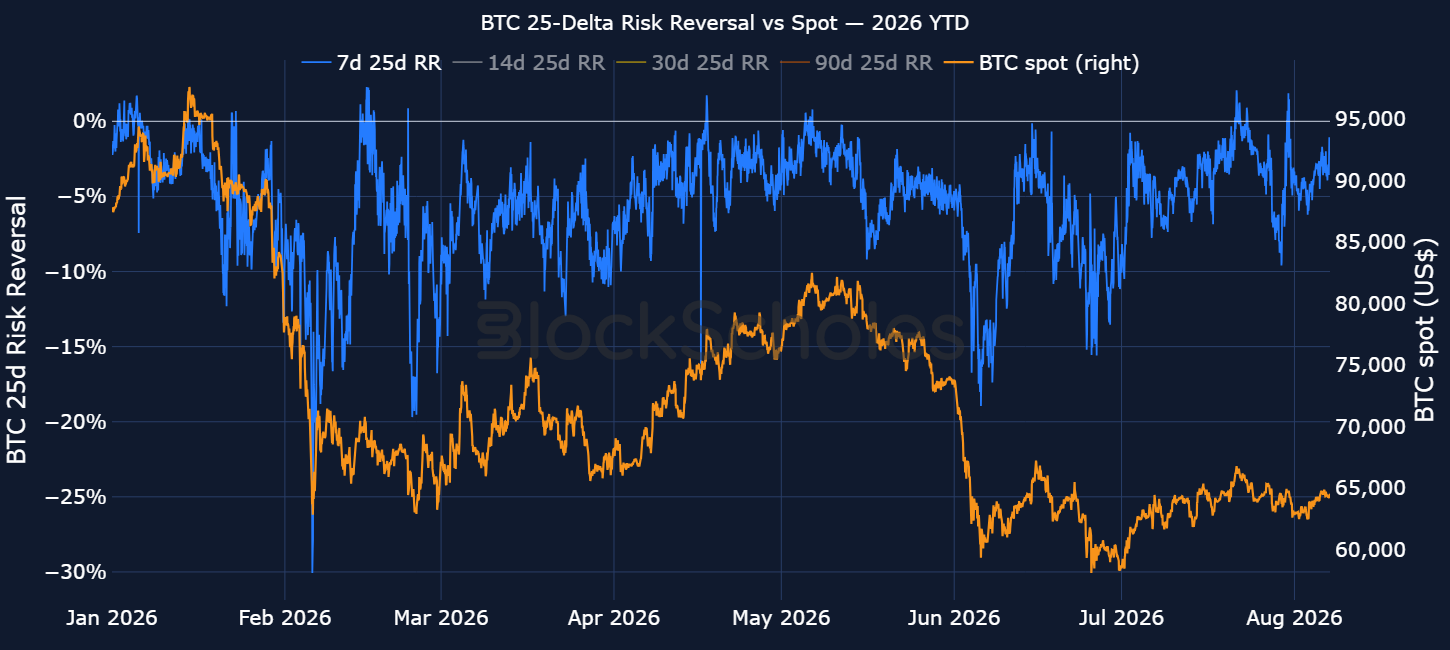
Figure 9: BTC 25-delta put-call skew ratio at 7-day tenor (blue, left axis) and BTC spot price (orange, right axis). Sources: Block Scholes. Data behind this chart available via BlockScholes REST API.
The recovery in ETH skew in particular stood out. 25-delta 7-day put-call skew entered the month at -10% and within three days, by July 3, it had already briefly turned positive.
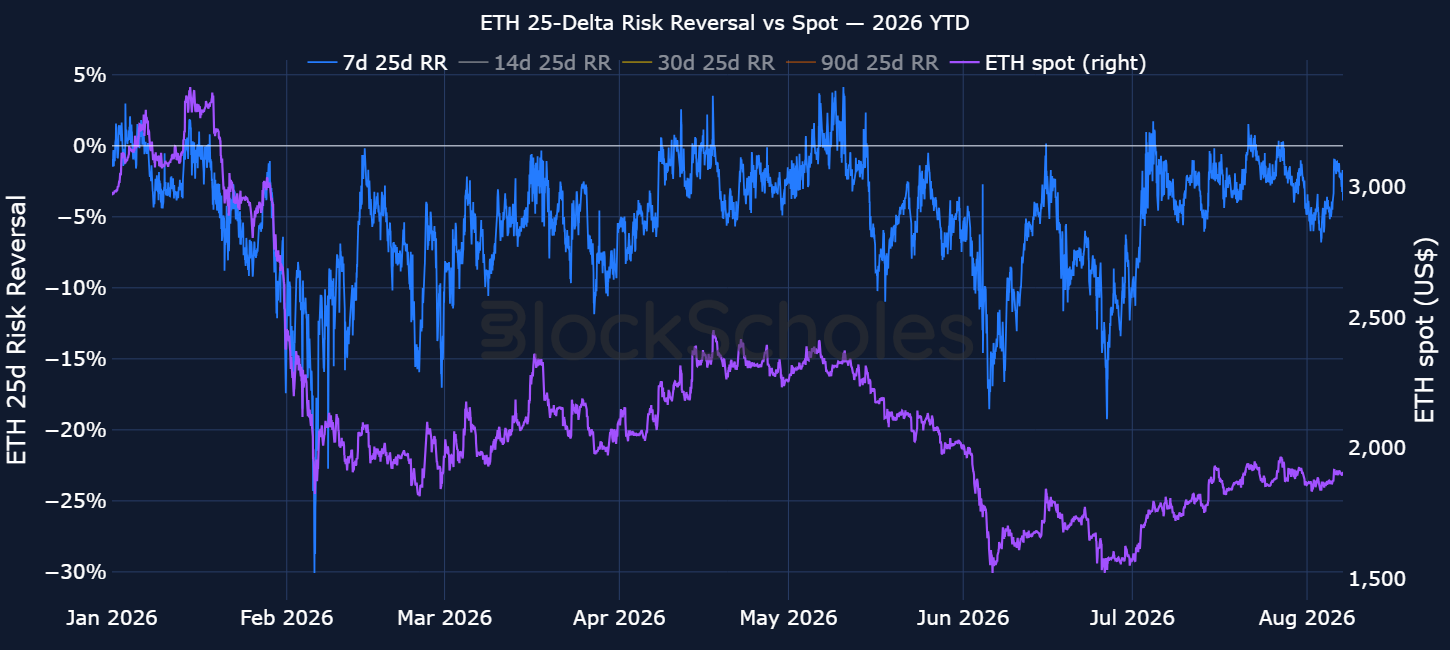
Figure 10: ETH 25-delta put-call skew ratio at 7-day tenor (blue, left axis) and ETH spot price (purple, right axis). Sources: Block Scholes. Data behind this chart available via BlockScholes REST API.
That raises the question: when skew changes sentiment from a deep put premium into call-skewed territory in only a few days, does spot tend to follow?
We ran a conditional analysis that first isolated every previous case of ETH’s 7-day risk reversal opening at or below -10%, before turning positive within three days — the same starting point and the same time frame as we saw in July. Then, we plotted ETH’s spot price 30 days after the first point that the skew turned positive in each case, revealing 18 previous cases since 2021.
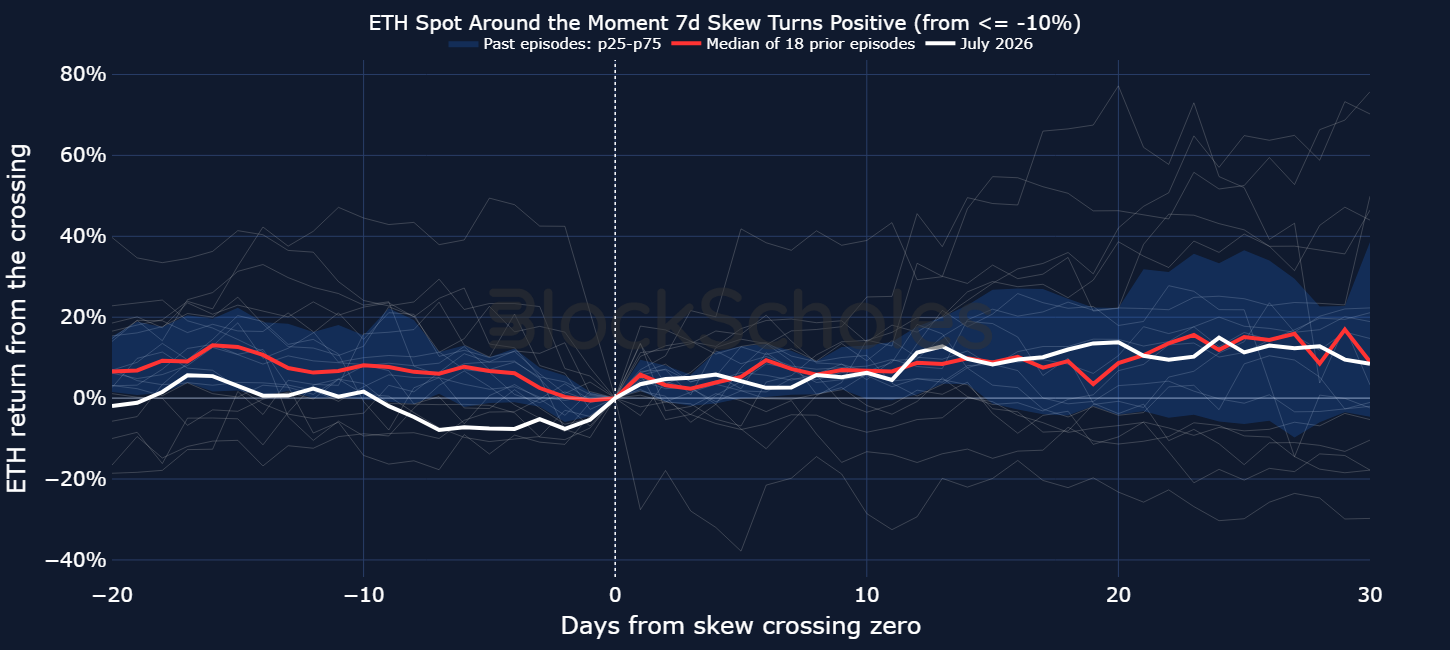
Figure 11: In/out chart of ETH returns prior to and 30-days after 7-day 25-delta put-call skew shifts positive from -10% or below within three days. Sources: Block Scholes.
In 18 cases, ETH rallied a median of 6.1% during the move from put-premium to call-premium. The median return over the following thirty days was a further 9% – ten cases where spot price was trading higher and eight cases where it fell, a roughly 50-50 split.
This suggests that a fast shift in skew sentiment over a short period of time does not always precede a continued outperformance in spot price. However, one factor that appears to influence the likelihood of these forward returns is where spot price was trading relative to its recent history at the time of the crossing in skew towards calls.
Historically, when ETH’s spot price is trading significantly below its recent highs, a fast shift in skew towards calls often precedes an outperformance in spot price. On the other hand, when spot price is already trading closer to its recent highs and skew changes direction, the median spot return has been -2.2%.
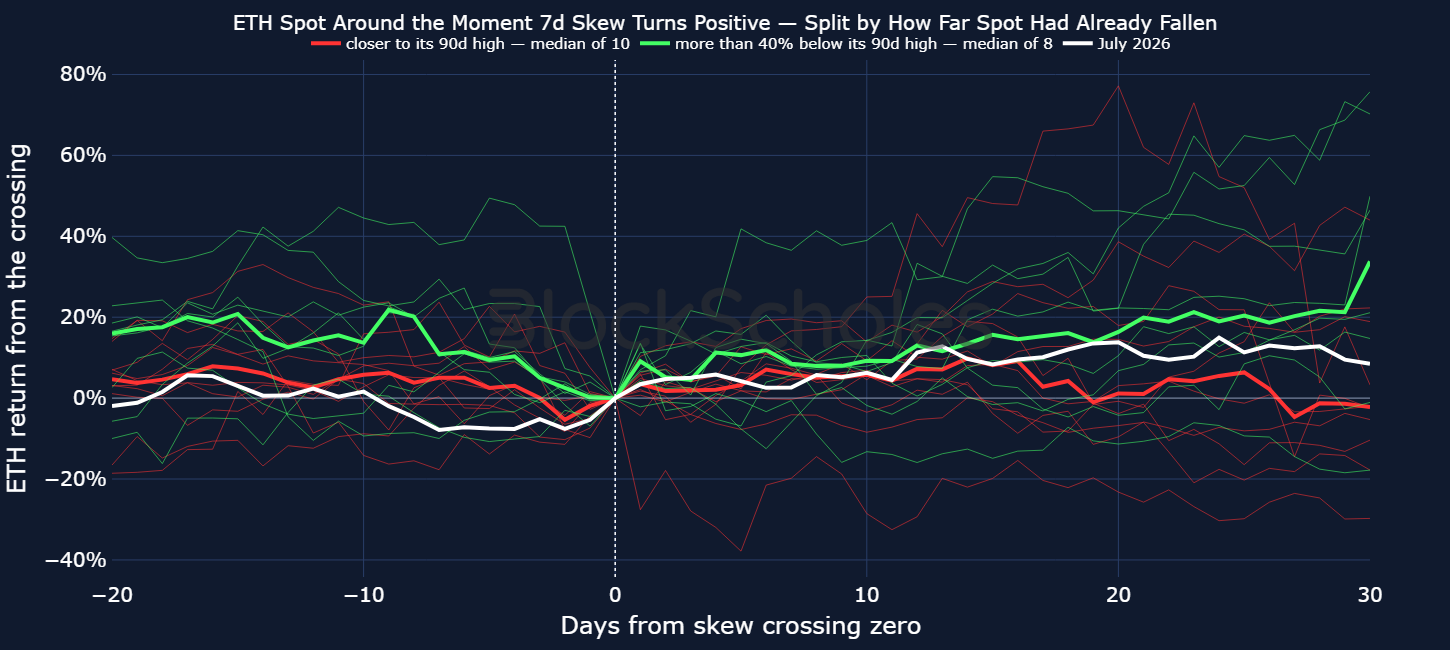
Figure 12: In/out chart of ETH returns prior to and 30-days after 7-day 25-delta put-call skew shifts positive from -10% or below within three days, separated by momentum in spot price prior to the crossing. Sources: Block Scholes.
Secondly, another factor is how much spot price itself moved during the period that skew rose from a put premium to a call premium. Historically, when spot price rallies more than 6% during the change in skew from negative to positive, it tends to continue outperforming, pointing towards a potential momentum effect. However, when spot price does not rally as hard during the recovery in skew, the rally tends to remain weak even after put-call skew remains tilted towards call options.
Overall, the month of July highlighted three interesting developments in crypto and real-world asset options markets: