

Catherine Fomenkova
Last Updated:
October 23, 2026
•
7 Minutes
DeFi Analytics 23rd October 2026
This week's edition of our Crypto DeFi Analytics.

Chain Fee Generation
Daily Fees Generated by Chain

Figure 1. Daily fees generated on each chain, USD. Source: Artemis, Block Scholes.
Stablecoins
Stablecoin Supply by Chain

Figure 2. Stablecoin supply by chain, USD. Source: Artemis, Block Scholes.
Stablecoin Volume by Chain

Figure 3. Stablecoin transaction volume by chain, USD. Source: Artemis, Block Scholes.
Real World Assets
RWA Perpetual Volume

Figure 4. Weekly trading volume in real-world-asset perpetual futures, USD. Source: Artemis, Block Scholes.
RWA Open Interest

Figure 5. Open interest in real-world-asset perpetual futures by venue, USD. Source: Artemis, Block Scholes.
Real World Assets - Weekly RWA perp volume hit a record $58.4B in the week from 12 October, above the previous high of $44.5B in late July and more than double any week in September. The current week, not yet complete, already stands at $55.6B. Open interest reached a record $7.9B in the week of 19 October, up from $5.0B in the week of 28 September. Most of that increase came from centralised exchanges over the same three weeks: Binance's open interest rose from $0.15B to $1.54B and Gate.io's from $0.65B to $1.50B, while trade.xyz's held near $3.8B, so its share of the total fell from 77% to 48%.
Separately, on 15 October Ripple Prime, the prime brokerage Ripple formed from its acquisition of Hidden Road, launched swaps on more than 100 equity, metal, energy and currency reference markets. Each swap tracks a trade.xyz perp on Hyperliquid, with Ripple Prime as counterparty, and trading continues through weekends. Clients can margin the swaps alongside their other positions at the firm, and in some jurisdictions post RLUSD as collateral. The product is available only from Ripple Prime's British Virgin Islands entity for now, and Virtu is among the first firms trading it. trade.xyz's open interest was little changed in the week after the launch.
Ethereum Gas Market
Hourly Average Gas Fees Burnt per Block

Figure 6. Hourly average gas fees burnt per Ethereum block. Source: Dune, Block Scholes.
Hourly Average Cost to Transfer ETH (21,000 Gas)

Figure 7. Hourly average cost of a standard ETH transfer (21,000 gas), USD. Source: Dune, Block Scholes.
Hourly Average Blob Gas Usage per Ethereum Block (Target: 6 Blobs)

Figure 8. Hourly average blob gas used per Ethereum block against the six-blob target. Source: Dune, Block Scholes.
Hourly Average Excess Blob Gas per Ethereum Block

Figure 9. Hourly average excess blob gas per Ethereum block. Source: Dune, Block Scholes.
Beacon Chain
Beacon Chain Summary

Figure 10. Beacon Chain balance in ETH (left-hand axis) with daily deposits, partial and full withdrawals (right-hand axis). Source: Dune, Block Scholes.
Beacon Chain Balance

Figure 11. Total ETH staked on the Beacon Chain. Source: Dune, Block Scholes.
Uniswap V3
Uniswap V3 Hourly Volumes - Arbitrum
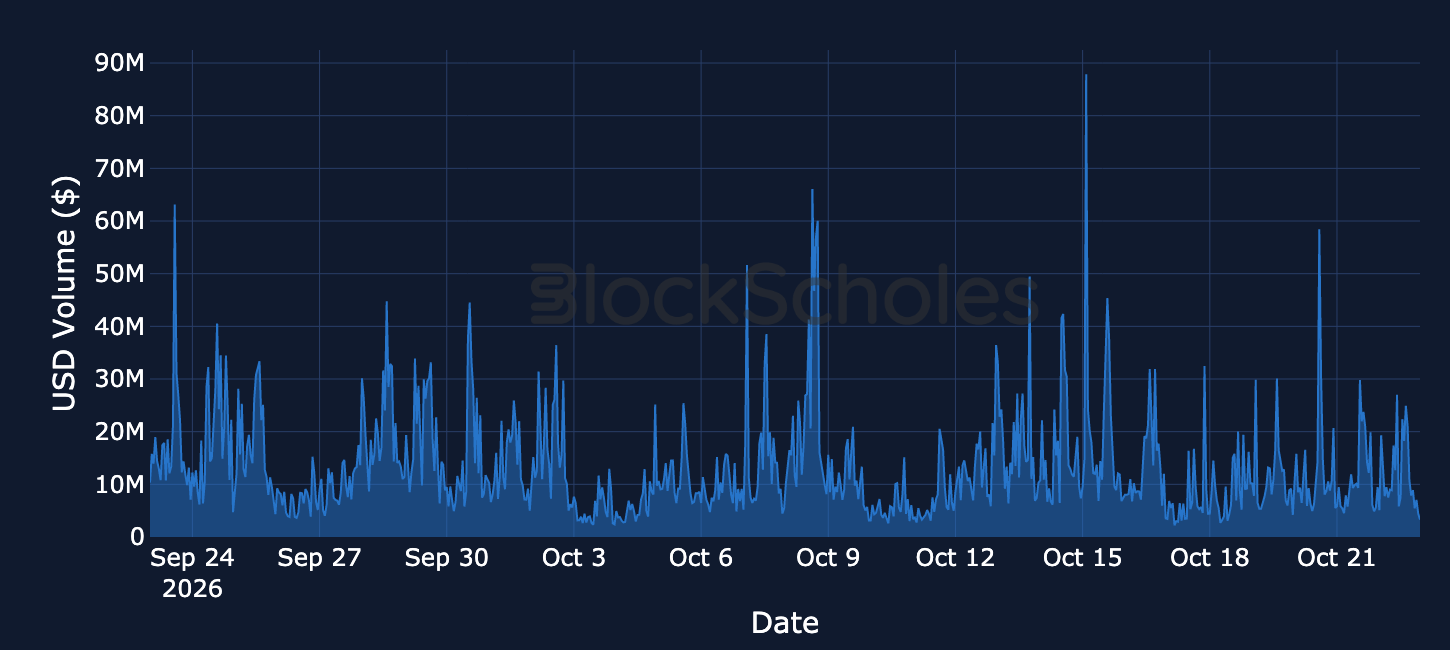
Figure 12. Hourly Uniswap V3 trading volume on Arbitrum, USD. Source: Dune, Block Scholes.
Uniswap V3 Hourly Transaction Count - Arbitrum
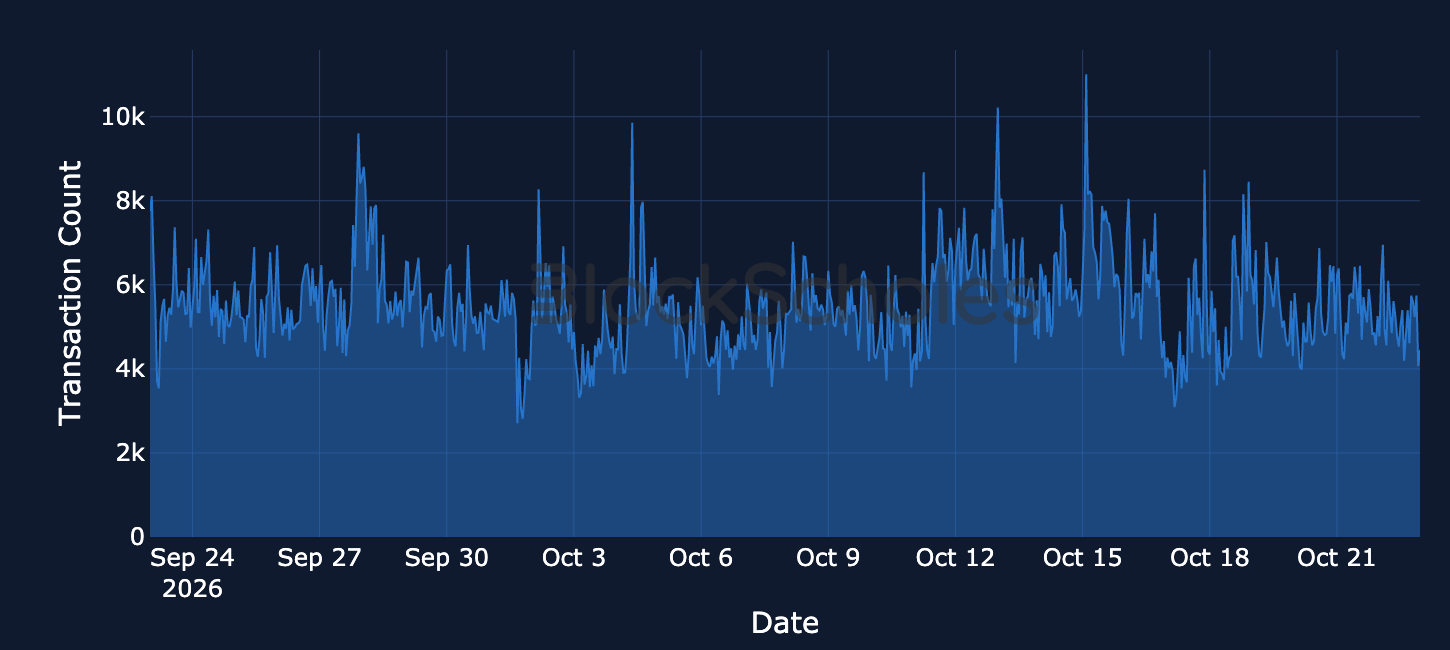
Figure 13. Hourly Uniswap V3 transaction count on Arbitrum. Source: Dune, Block Scholes.
Liquidations
Liquidations across Aave & Compound
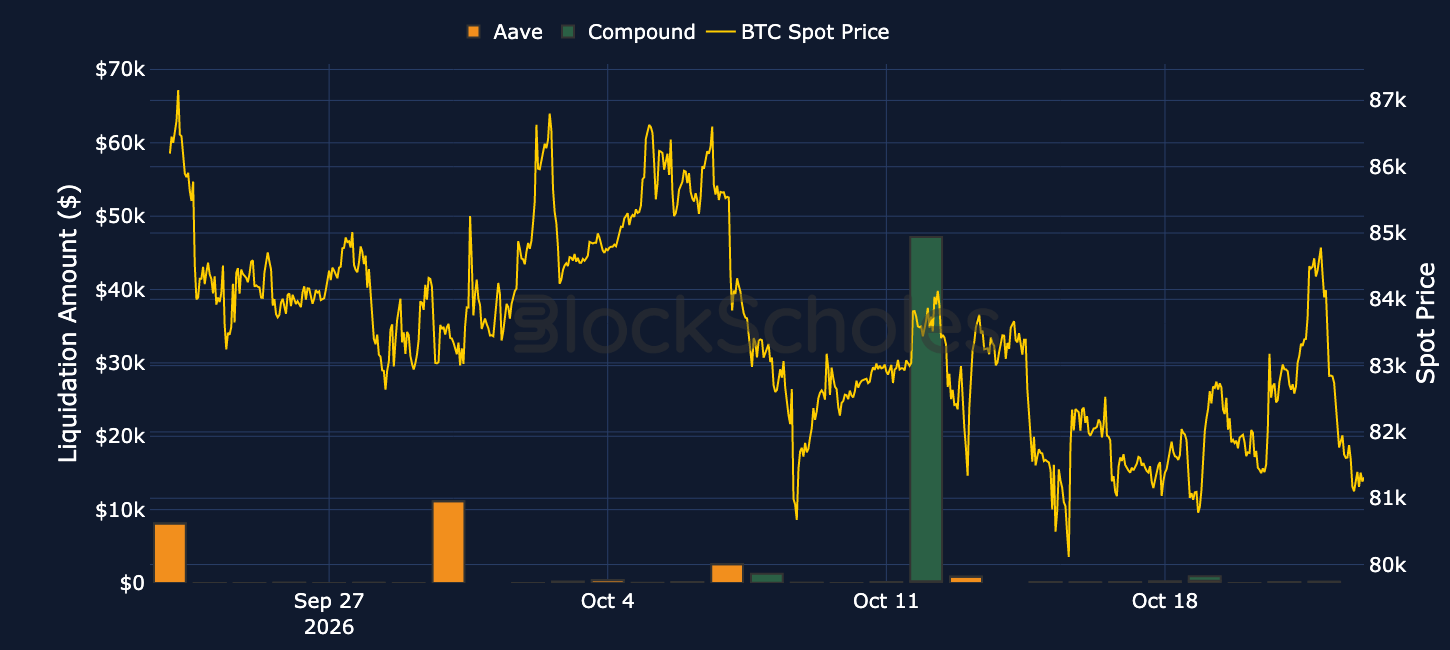
Figure 14. Daily liquidation amounts on Aave (orange) and Compound (green) with the BTC spot price (yellow, right-hand axis). Source: Dune, Block Scholes.


Free
PREMIUM
Institutional
DeFi Analytics 23rd October 2026
This week's edition of our Crypto DeFi Analytics.

Free
PREMIUM
Institutional
Uniswap Can Now Route Trades Through Liquidity on Curve, Fluid and PancakeSwap
The selloff in AI-related shares returned on Thursday after disappointing earnings from Meta, Tesla and Lam Research, with the Philadelphia Semiconductor index plunging 6.72% and all 30 of its members ending lower. The 10-year US Treasury yield fell around 17bps to 4.96%, its biggest one-day decline since March 2023, even as Brent crude rose 4.0% to its highest close since May. Uniswap launched aggregator hooks that let v4 route trades through liquidity on Fluid, Curve and PancakeSwap, while SoFi launched a tokenised bank deposit paying 4.4% APY.

Free
PREMIUM
Institutional
Crypto Risk Appetite Report 22nd October 2026
This week's edition of our Market Sentiment Report.