
Back to Research
Last Updated:  
October 8, 2026
•
4 Minutes

Crypto Risk Appetite Report 8th October 2026

This week's edition of our Market Sentiment Report.

BLOCK SCHOLES BTC RISK APPETITE INDEX

Our Risk Appetite Index remains in a bullish region though has been declining since mid-September as BTC’s spot price has struggled to break out of the $82,500 and $87,500 it has ranged between for almost a month now.
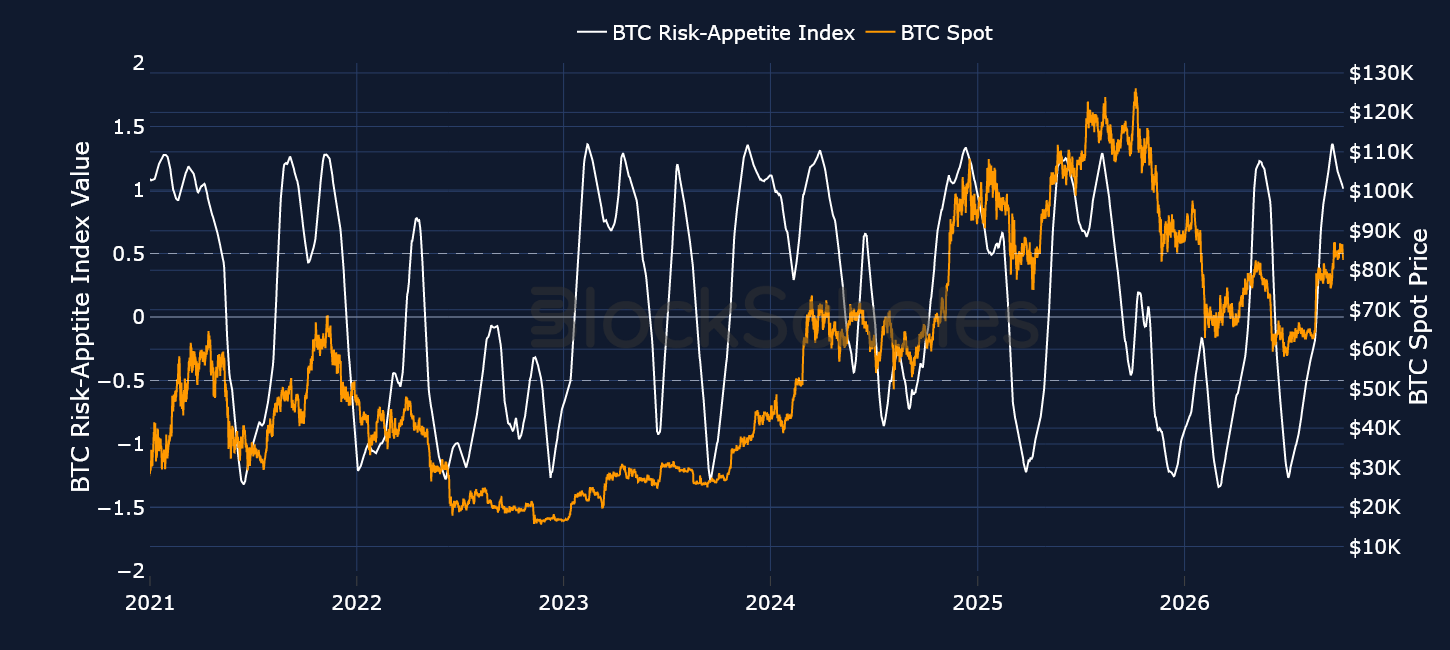
Figure 1. Block Scholes BTC Risk-Appetite Index (white, left axis) against the BTC spot price (right axis). Source: Block Scholes.

BTC SPOT RETURNS AFTER RISK APPETITE INDEX CROSSES FROM BELOW -1.0 THRESHOLD:

Figure 2. BTC spot returns in the days around each time the BTC Risk-Appetite Index crossed up through -1.0, with the current episode in white and the mean of prior episodes in red. Source: Block Scholes.

BLOCK SCHOLES ETH RISK APPETITE INDEX

Sentiment in ETH has also been on a slight decline after peaking at 1.34 on Sept 18, 2026. Institutional appetite in the token has recently hit a wall with spot ETH ETF products seeing seven straight days of outflows.
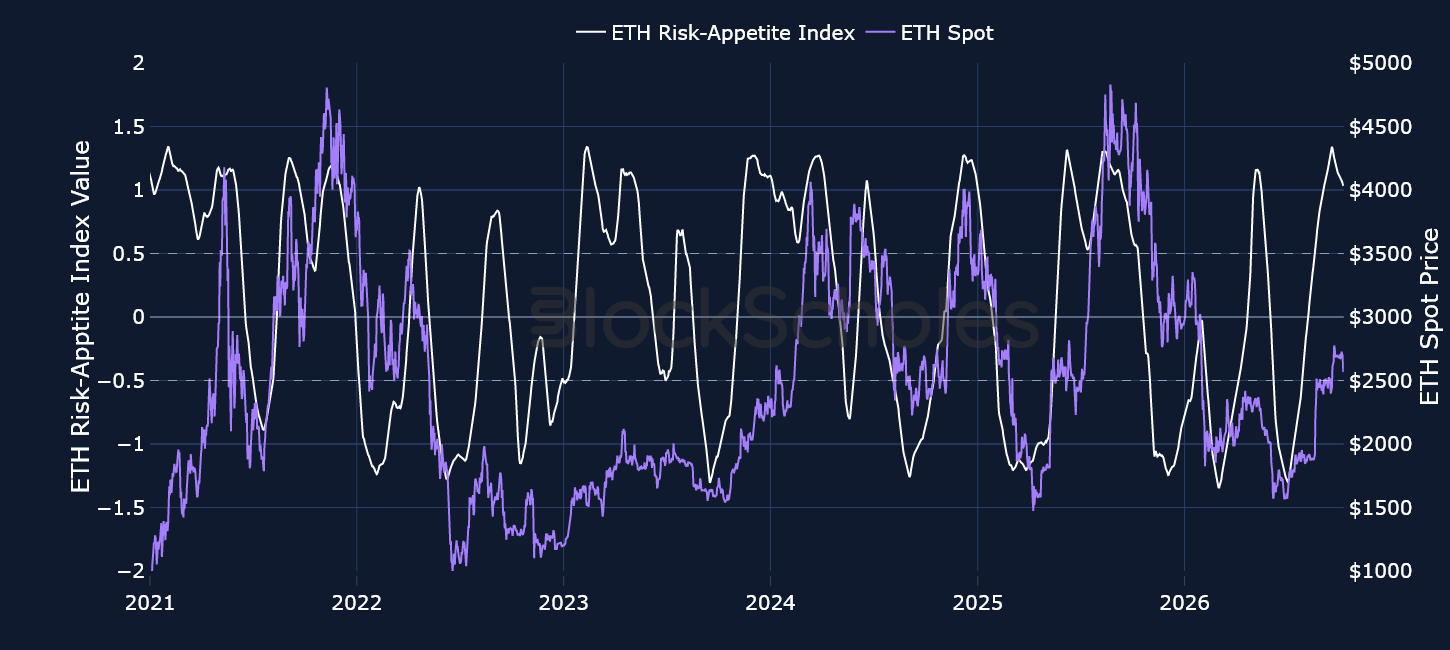
Figure 3. Block Scholes ETH Risk-Appetite Index (white, left axis) against the ETH spot price (right axis). Source: Block Scholes.
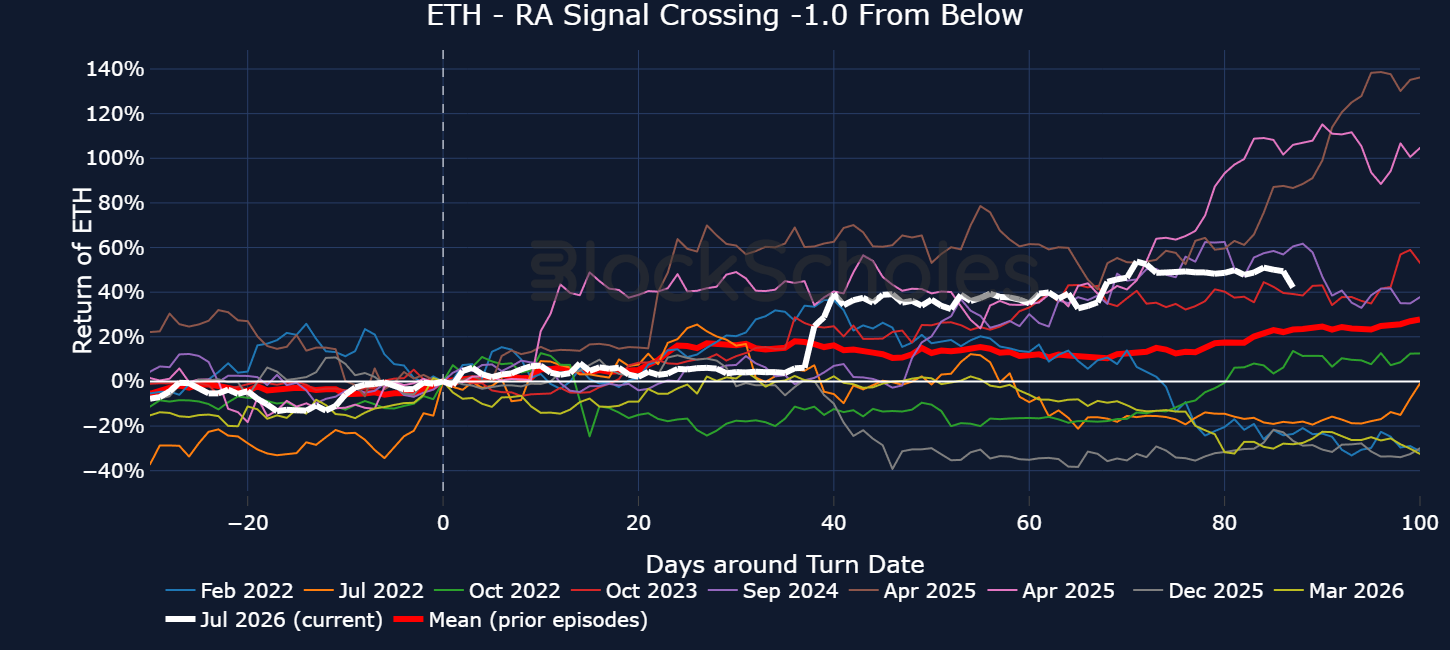
ETH SPOT RETURNS AFTER RISK APPETITE INDEX CROSSES FROM BELOW -1.0 THRESHOLD:

Figure 4. ETH spot returns in the days around each time the ETH Risk-Appetite Index crossed up through -1.0, with the current episode in white and the mean of prior episodes in red. Source: Block Scholes.

Data behind Risk Appetite charts: BlockScholes BTC/ETH/ SOL/ SUI/ XRP composite spot index price. Available via the BlockScholes REST API.
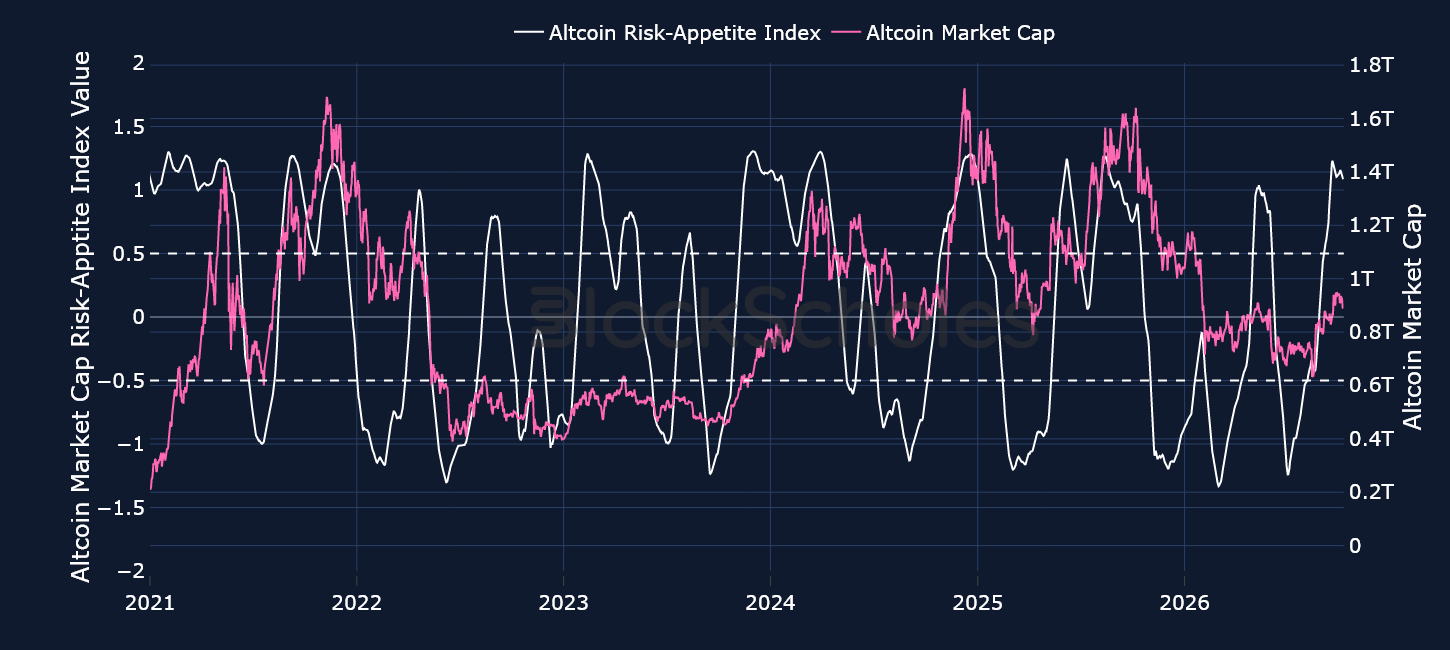
BLOCK SCHOLES ALTCOIN RISK APPETITE INDEX

Figure 5. Block Scholes Altcoin Risk-Appetite Index (white, left axis) against altcoin market capitalisation (right axis). Source: Block Scholes.
BLOCK SCHOLES XRP RISK APPETITE INDEX

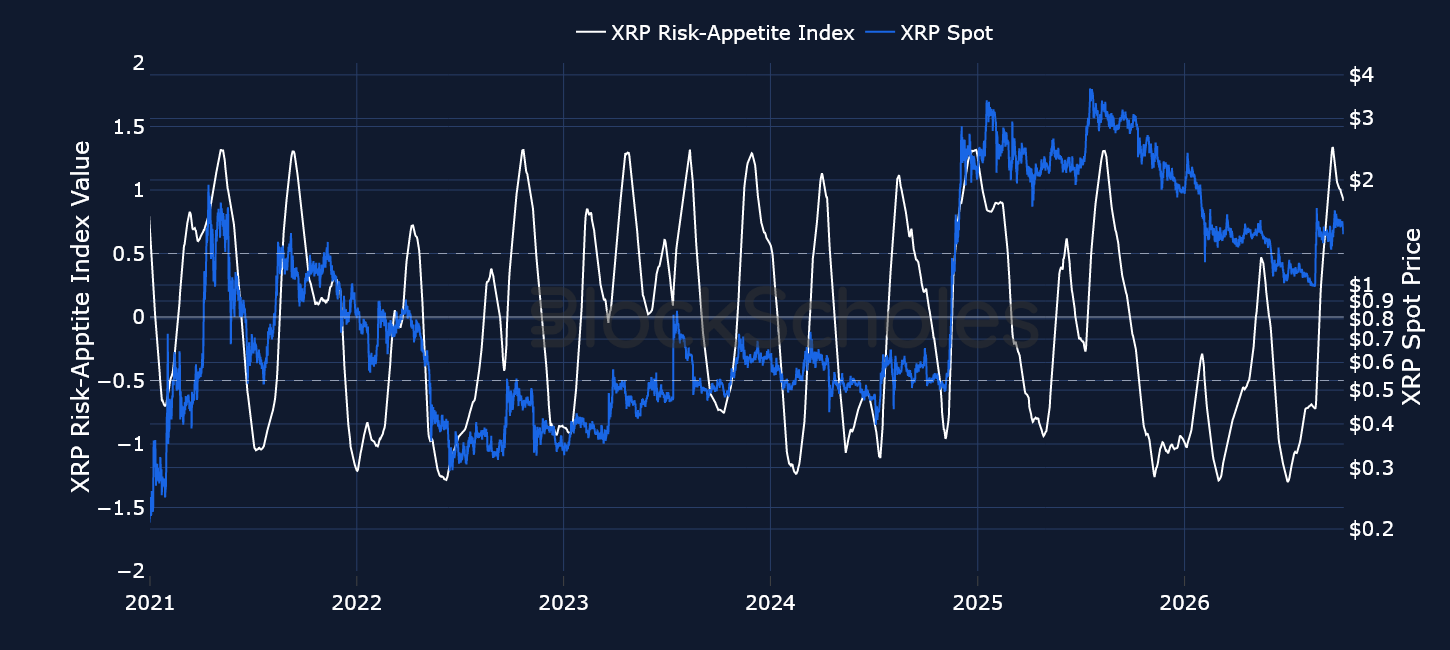
Figure 6. Block Scholes XRP Risk-Appetite Index (white, left axis) against the XRP spot price (right axis). Source: Block Scholes.
BLOCK SCHOLES SUI RISK APPETITE INDEX

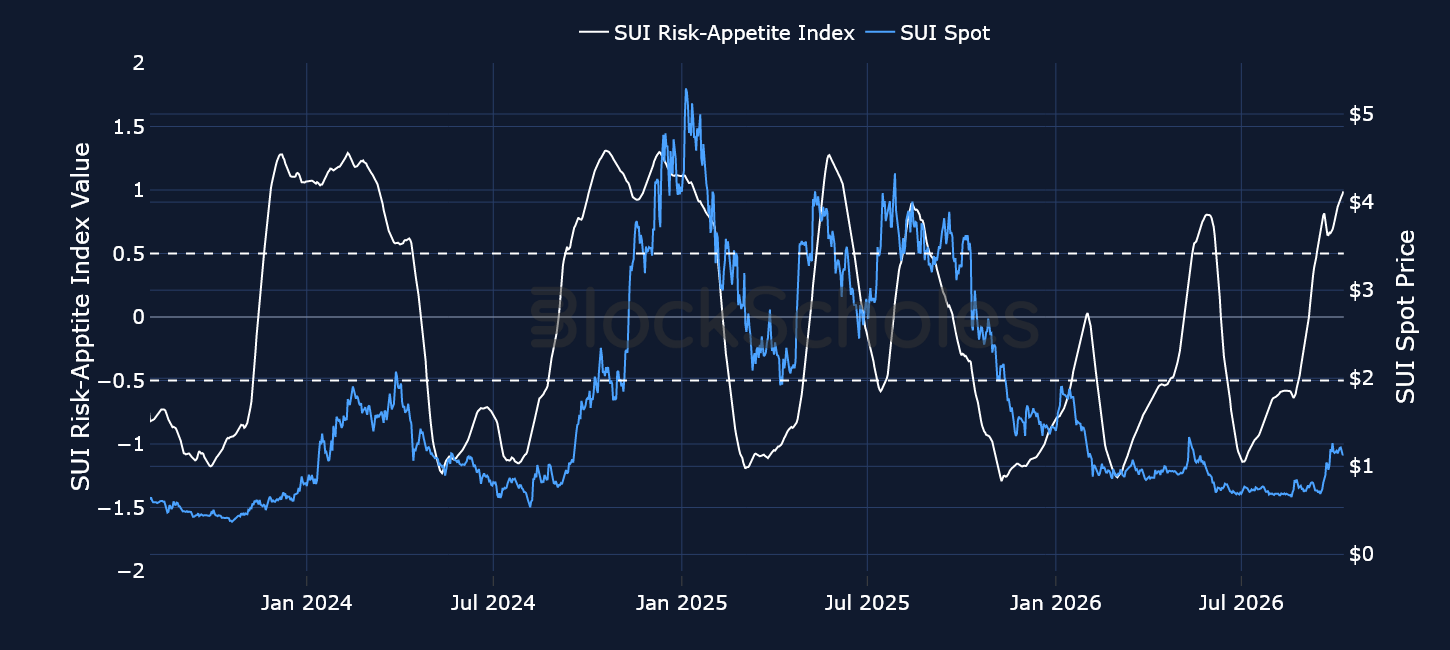
Figure 7. Block Scholes SUI Risk-Appetite Index (white, left axis) against the SUI spot price (right axis). Source: Block Scholes.
BLOCK SCHOLES SOL RISK APPETITE INDEX

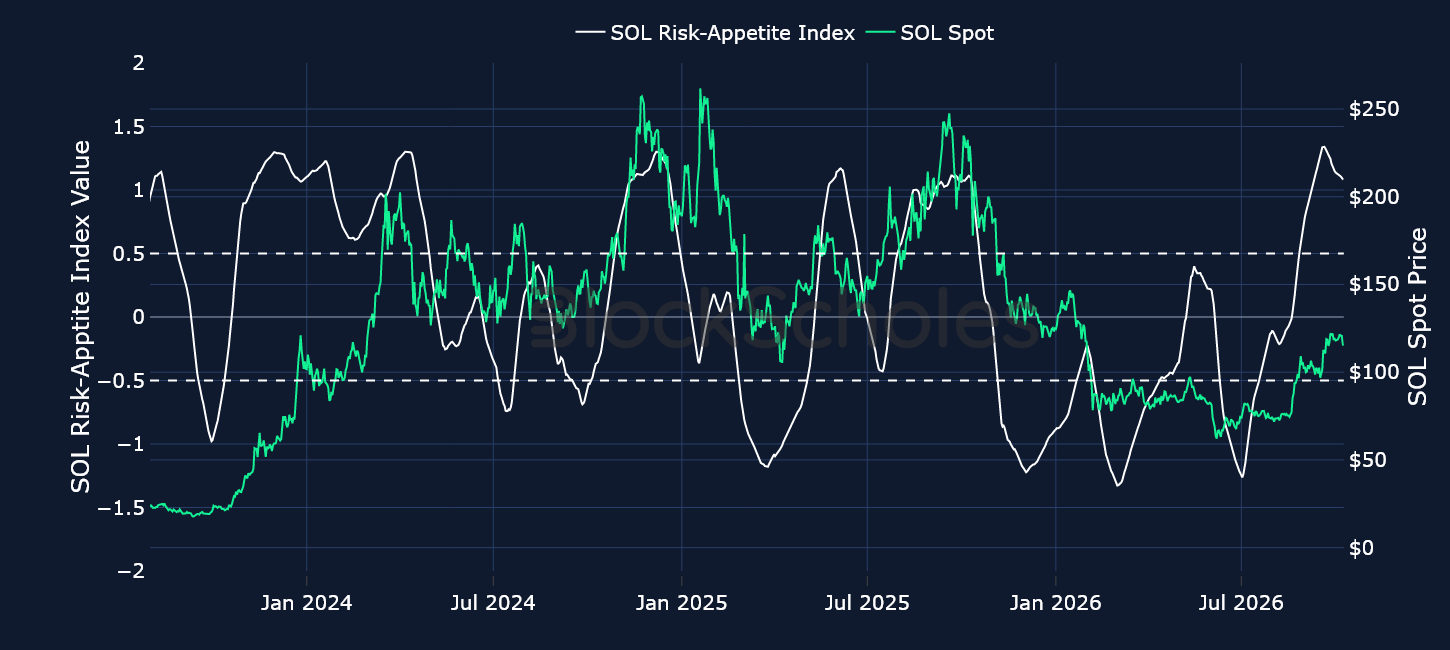
Figure 8. Block Scholes SOL Risk-Appetite Index (white, left axis) against the SOL spot price (right axis). Source: Block Scholes.


Share this post
Copy URL
www.blockscholes.com/premium-research/crypto-risk-appetite-report-8th-october-2026

BLOCK SCHOLES BTC RISK APPETITE INDEX

Our Risk Appetite Index remains in a bullish region though has been declining since mid-September as BTC’s spot price has struggled to break out of the $82,500 and $87,500 it has ranged between for almost a month now.

Figure 1. Block Scholes BTC Risk-Appetite Index (white, left axis) against the BTC spot price (right axis). Source: Block Scholes.
BTC SPOT RETURNS AFTER RISK APPETITE INDEX CROSSES FROM BELOW -1.0 THRESHOLD:

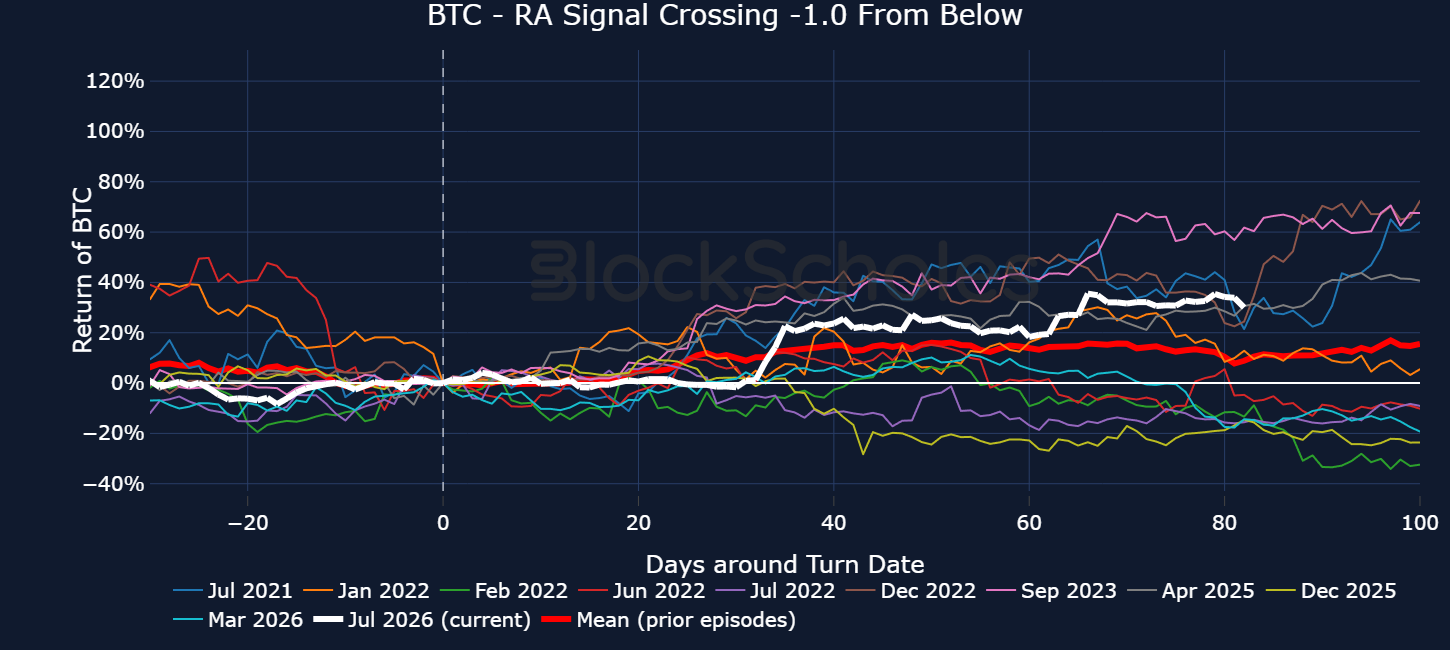
Figure 2. BTC spot returns in the days around each time the BTC Risk-Appetite Index crossed up through -1.0, with the current episode in white and the mean of prior episodes in red. Source: Block Scholes.

BLOCK SCHOLES ETH RISK APPETITE INDEX

Sentiment in ETH has also been on a slight decline after peaking at 1.34 on Sept 18, 2026. Institutional appetite in the token has recently hit a wall with spot ETH ETF products seeing seven straight days of outflows.

Figure 3. Block Scholes ETH Risk-Appetite Index (white, left axis) against the ETH spot price (right axis). Source: Block Scholes.

ETH SPOT RETURNS AFTER RISK APPETITE INDEX CROSSES FROM BELOW -1.0 THRESHOLD:

‍

‍

‍

‍

‍

‍

‍

‍

‍

‍

‍

‍

‍

‍

‍

‍

‍

‍

BLOCK SCHOLES BTC RISK APPETITE INDEX

Our Risk Appetite Index remains in a bullish region though has been declining since mid-September as BTC’s spot price has struggled to break out of the $82,500 and $87,500 it has ranged between for almost a month now.

Figure 1. Block Scholes BTC Risk-Appetite Index (white, left axis) against the BTC spot price (right axis). Source: Block Scholes.

BTC SPOT RETURNS AFTER RISK APPETITE INDEX CROSSES FROM BELOW -1.0 THRESHOLD:

Figure 2. BTC spot returns in the days around each time the BTC Risk-Appetite Index crossed up through -1.0, with the current episode in white and the mean of prior episodes in red. Source: Block Scholes.

BLOCK SCHOLES ETH RISK APPETITE INDEX

Sentiment in ETH has also been on a slight decline after peaking at 1.34 on Sept 18, 2026. Institutional appetite in the token has recently hit a wall with spot ETH ETF products seeing seven straight days of outflows.

Figure 3. Block Scholes ETH Risk-Appetite Index (white, left axis) against the ETH spot price (right axis). Source: Block Scholes.

ETH SPOT RETURNS AFTER RISK APPETITE INDEX CROSSES FROM BELOW -1.0 THRESHOLD:

‍

‍

‍

‍

‍

‍

‍

‍

‍

‍

‍

‍

‍

‍

‍

‍

‍

‍