
Back to Research
Last Updated:  
September 17, 2026
4 Minutes

Crypto Risk Appetite Report 17th September 2026

This week's edition of our Market Sentiment Report.

BLOCK SCHOLES BTC RISK APPETITE INDEX

The first rate hike from the Federal Reserve since July 2023 and a median dot plot which suggests participants expect at least one more rate increase before the end of the year weighed on sentiment for risk assets. BTC has however held up with resilience, falling only to $76K following the decision, the lower-bound of where it has traded over the past month.
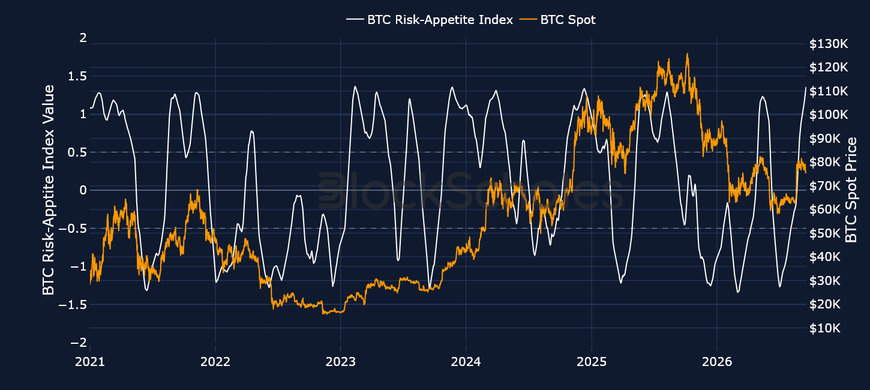
Figure 1. Block Scholes BTC Risk-Appetite Index (white, left axis) against the BTC spot price (right axis). Source: Block Scholes.
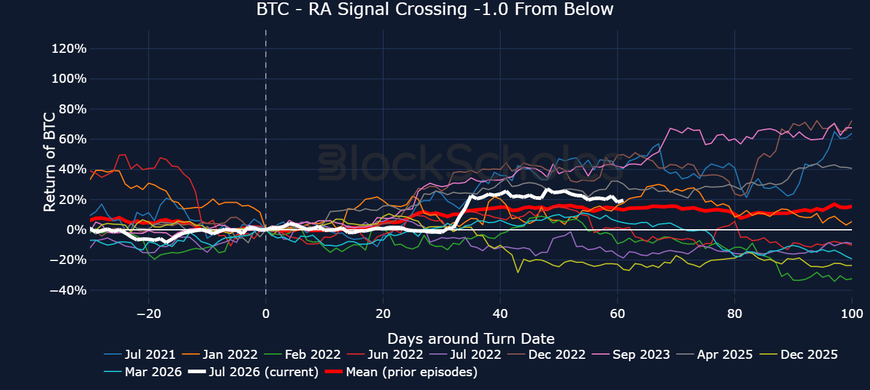
Figure 1. Block Scholes BTC Risk-Appetite Index (white, left axis) against the BTC spot price (right axis). Source: Block Scholes.

BTC SPOT RETURNS AFTER RISK APPETITE INDEX CROSSES FROM BELOW -1.0 THRESHOLD:

Figure 2. BTC spot returns in the days around each time the BTC Risk-Appetite Index crossed up through -1.0, with the current episode in white and the mean of prior episodes in red. Source: Block Scholes.

Figure 2. BTC spot returns in the days around each time the BTC Risk-Appetite Index crossed up through -1.0, with the current episode in white and the mean of prior episodes in red. Source: Block Scholes.

BLOCK SCHOLES ETH RISK APPETITE INDEX

ETH also continues to consolidate below $2,500 after it’s major rally in August. Chairman Kevin Warsh said in his press conference that the Fed “removed a dose of accommodation” given that he is finding it “hard pressed to describe broad financial conditions as restrictive”.
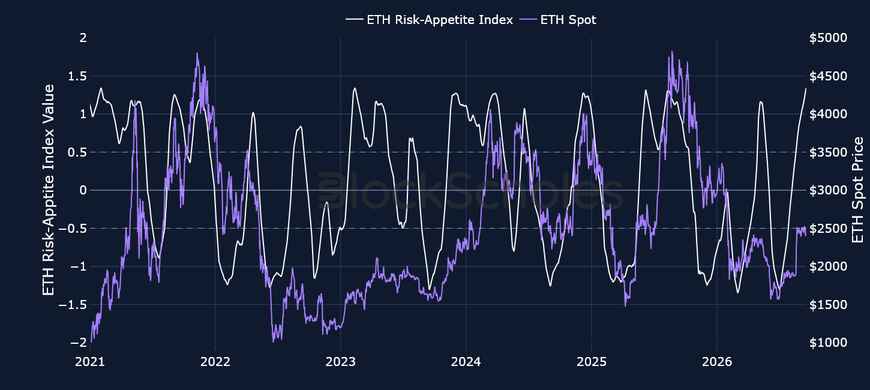
Figure 3. Block Scholes ETH Risk-Appetite Index (white, left axis) against the ETH spot price (right axis). Source: Block Scholes.
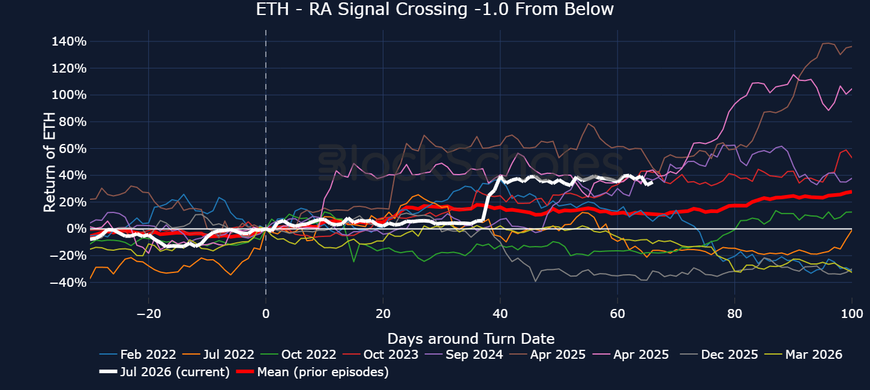
Figure 3. Block Scholes ETH Risk-Appetite Index (white, left axis) against the ETH spot price (right axis). Source: Block Scholes.

ETH SPOT RETURNS AFTER RISK APPETITE INDEX CROSSES FROM BELOW -1.0 THRESHOLD:

Figure 4. ETH spot returns in the days around each time the ETH Risk-Appetite Index crossed up through -1.0, with the current episode in white and the mean of prior episodes in red. Source: Block Scholes.

Figure 4. ETH spot returns in the days around each time the ETH Risk-Appetite Index crossed up through -1.0, with the current episode in white and the mean of prior episodes in red. Source: Block Scholes.

Data behind Risk Appetite charts: BlockScholes BTC/ETH/ SOL/ SUI/ XRP composite spot index price. Available via the BlockScholes REST API.
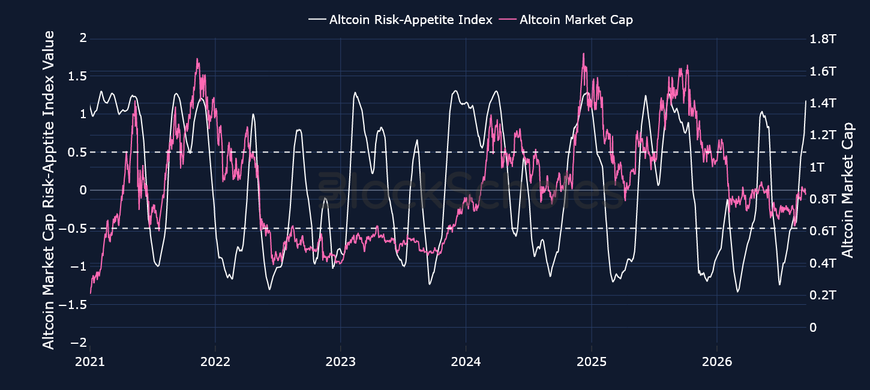
BLOCK SCHOLES ALTCOIN RISK APPETITE INDEX

Figure 5. Block Scholes Altcoin Risk-Appetite Index (white, left axis) against altcoin market capitalisation (right axis). Source: Block Scholes.
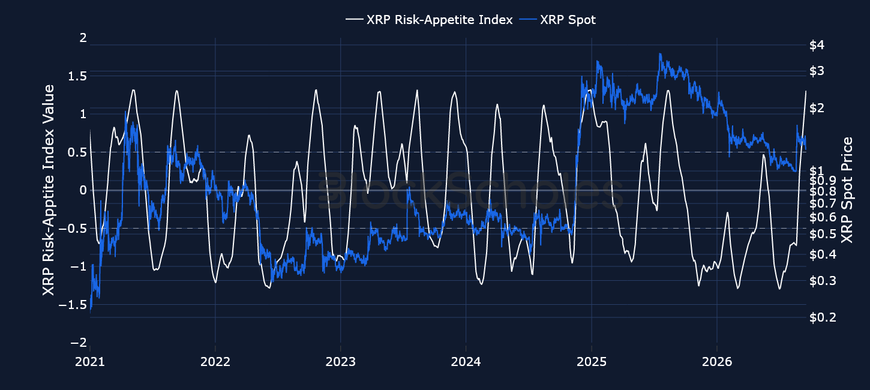
Figure 5. Block Scholes Altcoin Risk-Appetite Index (white, left axis) against altcoin market capitalisation (right axis). Source: Block Scholes.

BLOCK SCHOLES XRP RISK APPETITE INDEX

Figure 6. Block Scholes XRP Risk-Appetite Index (white, left axis) against the XRP spot price (right axis). Source: Block Scholes.
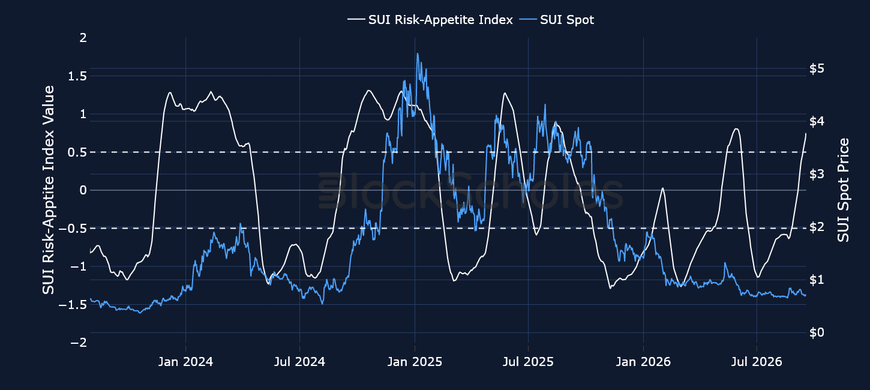
Figure 6. Block Scholes XRP Risk-Appetite Index (white, left axis) against the XRP spot price (right axis). Source: Block Scholes.

BLOCK SCHOLES SUI RISK APPETITE INDEX

Figure 7. Block Scholes SUI Risk-Appetite Index (white, left axis) against the SUI spot price (right axis). Source: Block Scholes.
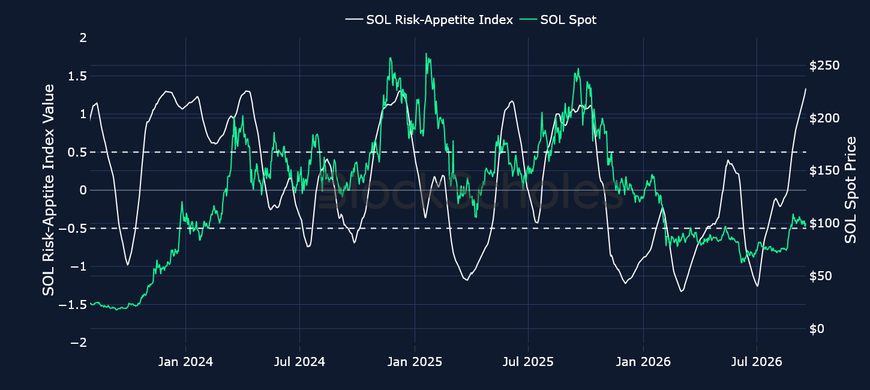
Figure 7. Block Scholes SUI Risk-Appetite Index (white, left axis) against the SUI spot price (right axis). Source: Block Scholes.

BLOCK SCHOLES SOL RISK APPETITE INDEX

Figure 8. Block Scholes SOL Risk-Appetite Index (white, left axis) against the SOL spot price (right axis). Source: Block Scholes.


Figure 8. Block Scholes SOL Risk-Appetite Index (white, left axis) against the SOL spot price (right axis). Source: Block Scholes.

Share this post
Copy URL
https://www.blockscholes.com/premium-research/crypto-risk-appetite-report-17th-september-2026

BLOCK SCHOLES BTC RISK APPETITE INDEX

The first rate hike from the Federal Reserve since July 2023 and a median dot plot which suggests participants expect at least one more rate increase before the end of the year weighed on sentiment for risk assets. BTC has however held up with resilience, falling only to $76K following the decision, the lower-bound of where it has traded over the past month.

Figure 1. Block Scholes BTC Risk-Appetite Index (white, left axis) against the BTC spot price (right axis). Source: Block Scholes.

Figure 1. Block Scholes BTC Risk-Appetite Index (white, left axis) against the BTC spot price (right axis). Source: Block Scholes.

BTC SPOT RETURNS AFTER RISK APPETITE INDEX CROSSES FROM BELOW -1.0 THRESHOLD:

Figure 2. BTC spot returns in the days around each time the BTC Risk-Appetite Index crossed up through -1.0, with the current episode in white and the mean of prior episodes in red. Source: Block Scholes.

Figure 2. BTC spot returns in the days around each time the BTC Risk-Appetite Index crossed up through -1.0, with the current episode in white and the mean of prior episodes in red. Source: Block Scholes.

BLOCK SCHOLES ETH RISK APPETITE INDEX

ETH also continues to consolidate below $2,500 after it’s major rally in August. Chairman Kevin Warsh said in his press conference that the Fed “removed a dose of accommodation” given that he is finding it “hard pressed to describe broad financial conditions as restrictive”.

Figure 3. Block Scholes ETH Risk-Appetite Index (white, left axis) against the ETH spot price (right axis). Source: Block Scholes.

Figure 3. Block Scholes ETH Risk-Appetite Index (white, left axis) against the ETH spot price (right axis). Source: Block Scholes.

ETH SPOT RETURNS AFTER RISK APPETITE INDEX CROSSES FROM BELOW -1.0 THRESHOLD:

BLOCK SCHOLES BTC RISK APPETITE INDEX

The first rate hike from the Federal Reserve since July 2023 and a median dot plot which suggests participants expect at least one more rate increase before the end of the year weighed on sentiment for risk assets. BTC has however held up with resilience, falling only to $76K following the decision, the lower-bound of where it has traded over the past month.

Figure 1. Block Scholes BTC Risk-Appetite Index (white, left axis) against the BTC spot price (right axis). Source: Block Scholes.

Figure 1. Block Scholes BTC Risk-Appetite Index (white, left axis) against the BTC spot price (right axis). Source: Block Scholes.

BTC SPOT RETURNS AFTER RISK APPETITE INDEX CROSSES FROM BELOW -1.0 THRESHOLD:

Figure 2. BTC spot returns in the days around each time the BTC Risk-Appetite Index crossed up through -1.0, with the current episode in white and the mean of prior episodes in red. Source: Block Scholes.

Figure 2. BTC spot returns in the days around each time the BTC Risk-Appetite Index crossed up through -1.0, with the current episode in white and the mean of prior episodes in red. Source: Block Scholes.

BLOCK SCHOLES ETH RISK APPETITE INDEX

ETH also continues to consolidate below $2,500 after it’s major rally in August. Chairman Kevin Warsh said in his press conference that the Fed “removed a dose of accommodation” given that he is finding it “hard pressed to describe broad financial conditions as restrictive”.

Figure 3. Block Scholes ETH Risk-Appetite Index (white, left axis) against the ETH spot price (right axis). Source: Block Scholes.

Figure 3. Block Scholes ETH Risk-Appetite Index (white, left axis) against the ETH spot price (right axis). Source: Block Scholes.

ETH SPOT RETURNS AFTER RISK APPETITE INDEX CROSSES FROM BELOW -1.0 THRESHOLD: