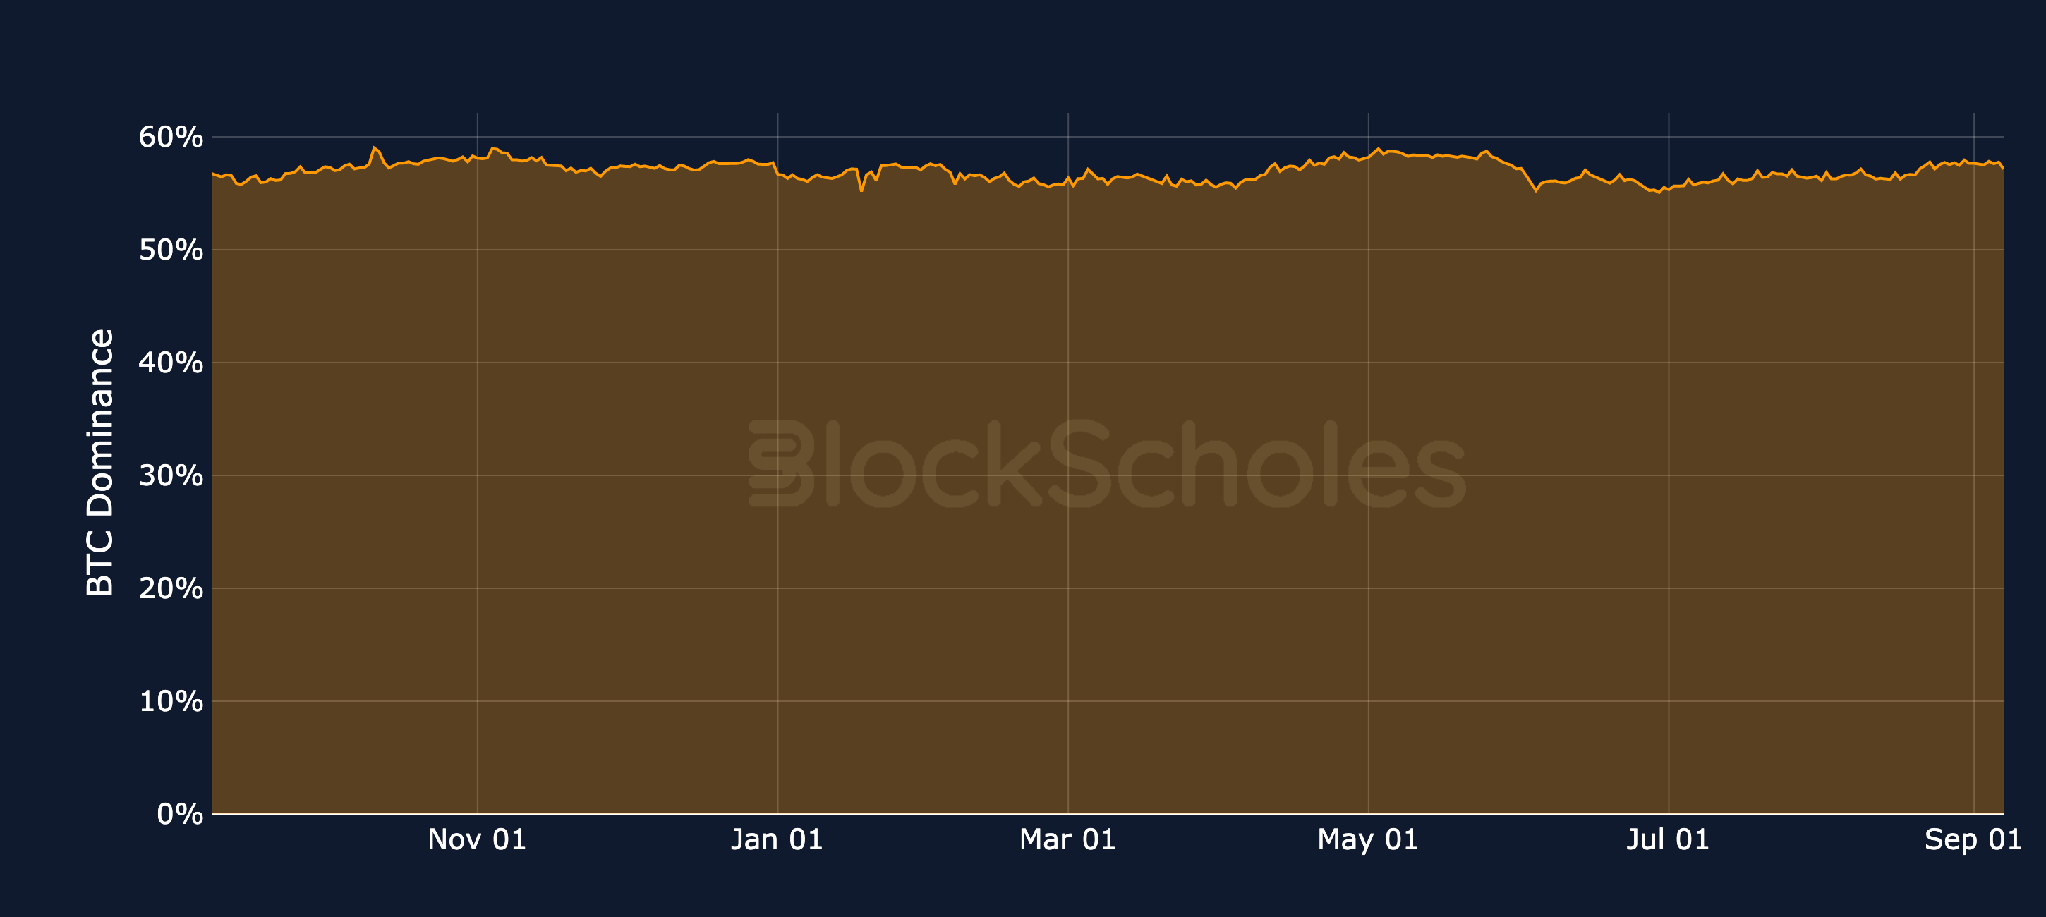
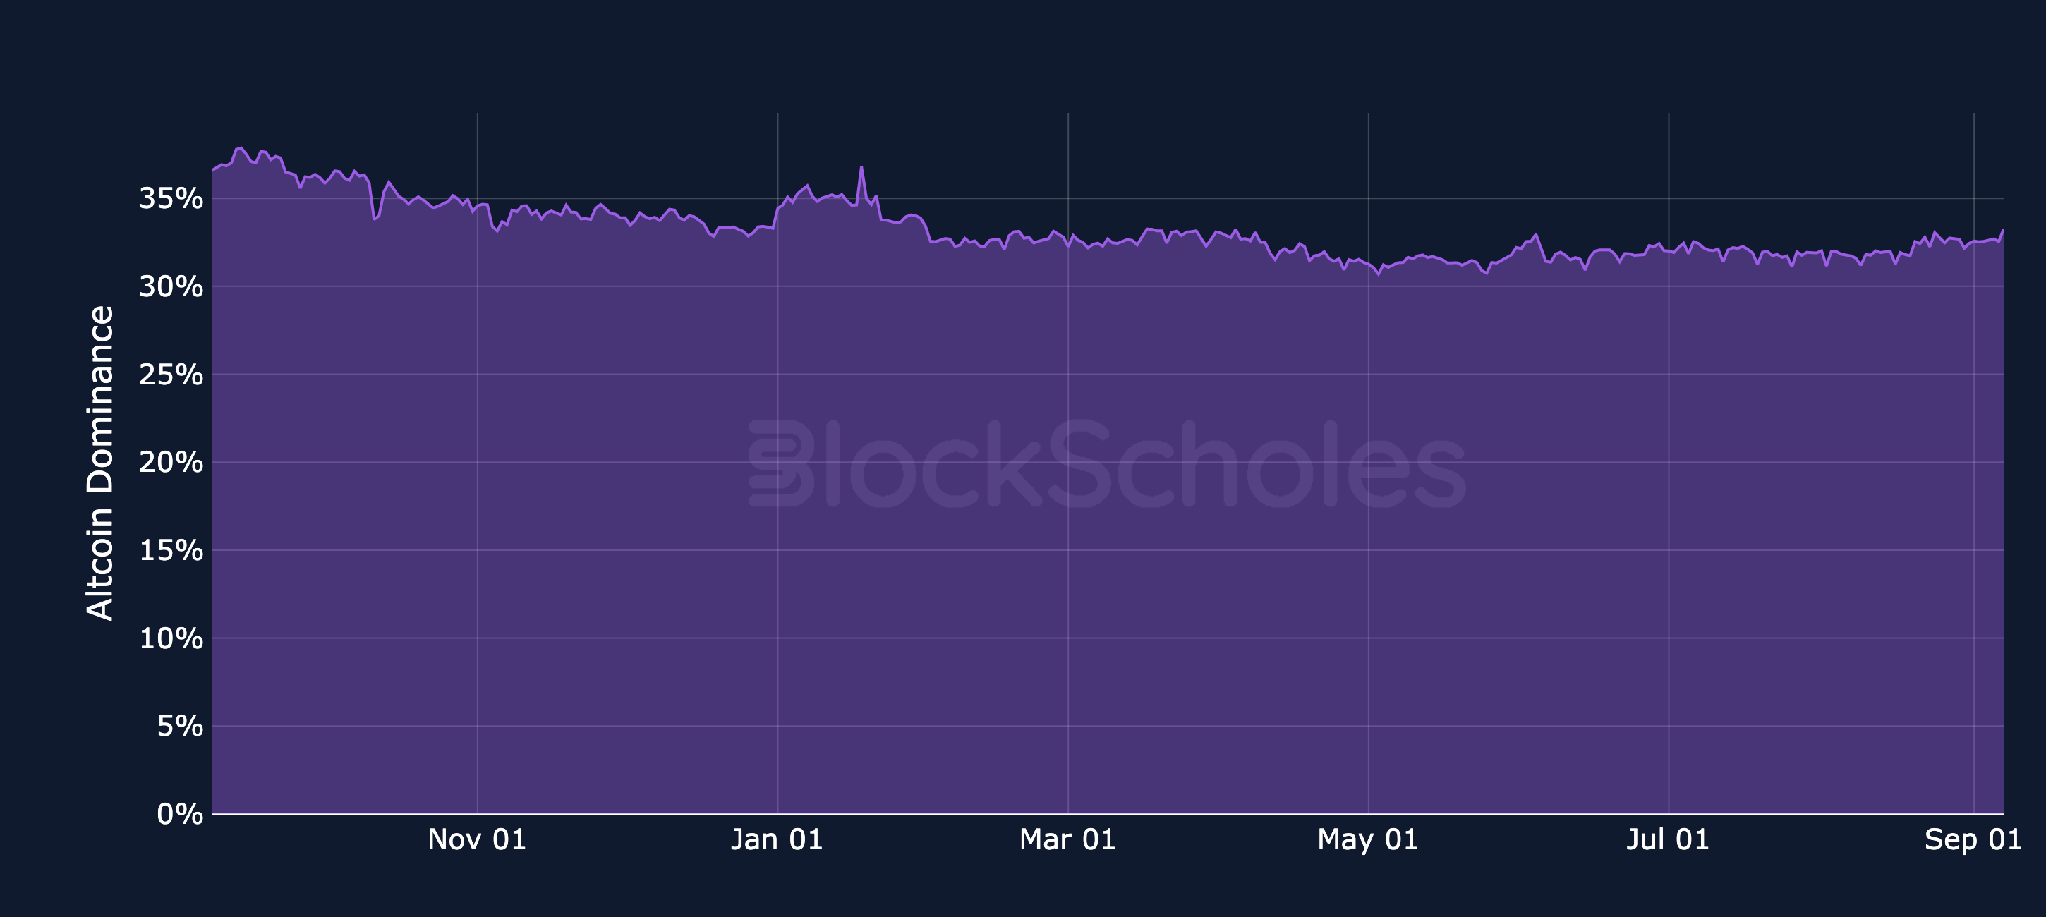
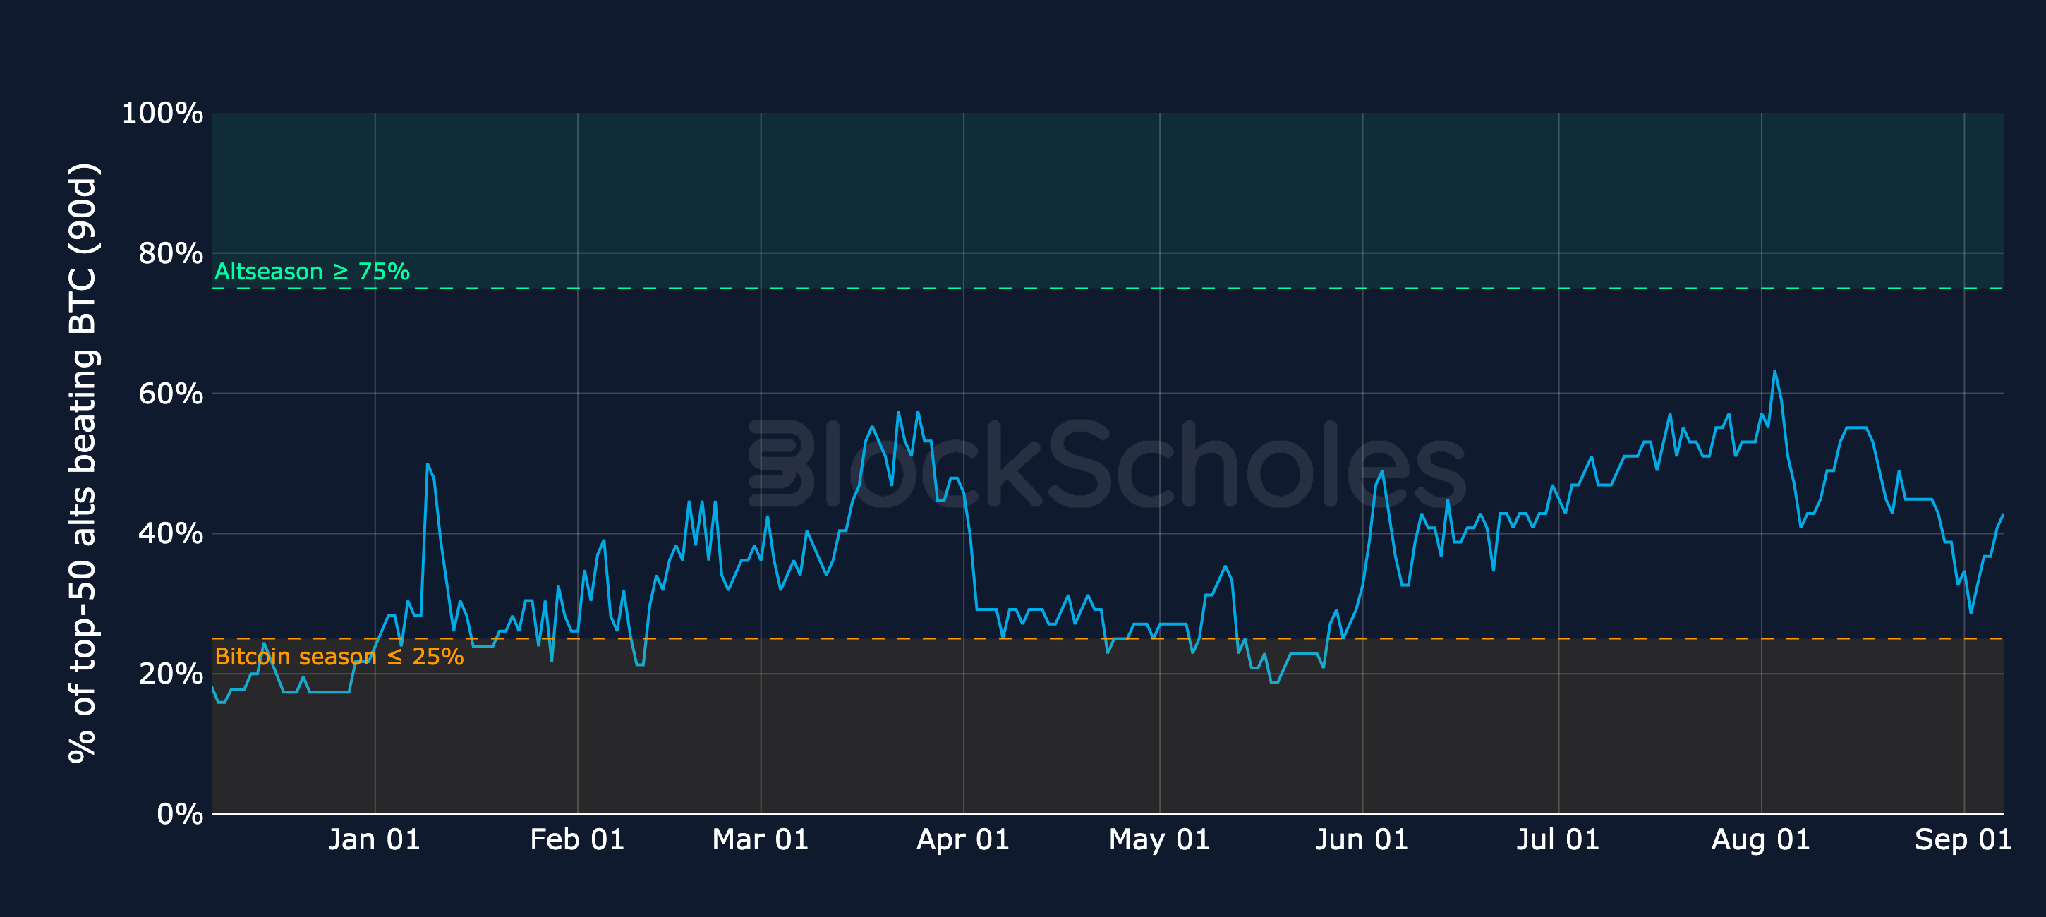
Altcoin Season Gauge (slow-moving by construction, 90-day lookback): % of top-50 altcoins outperforming BTC over the trailing 90 days (current constituents)
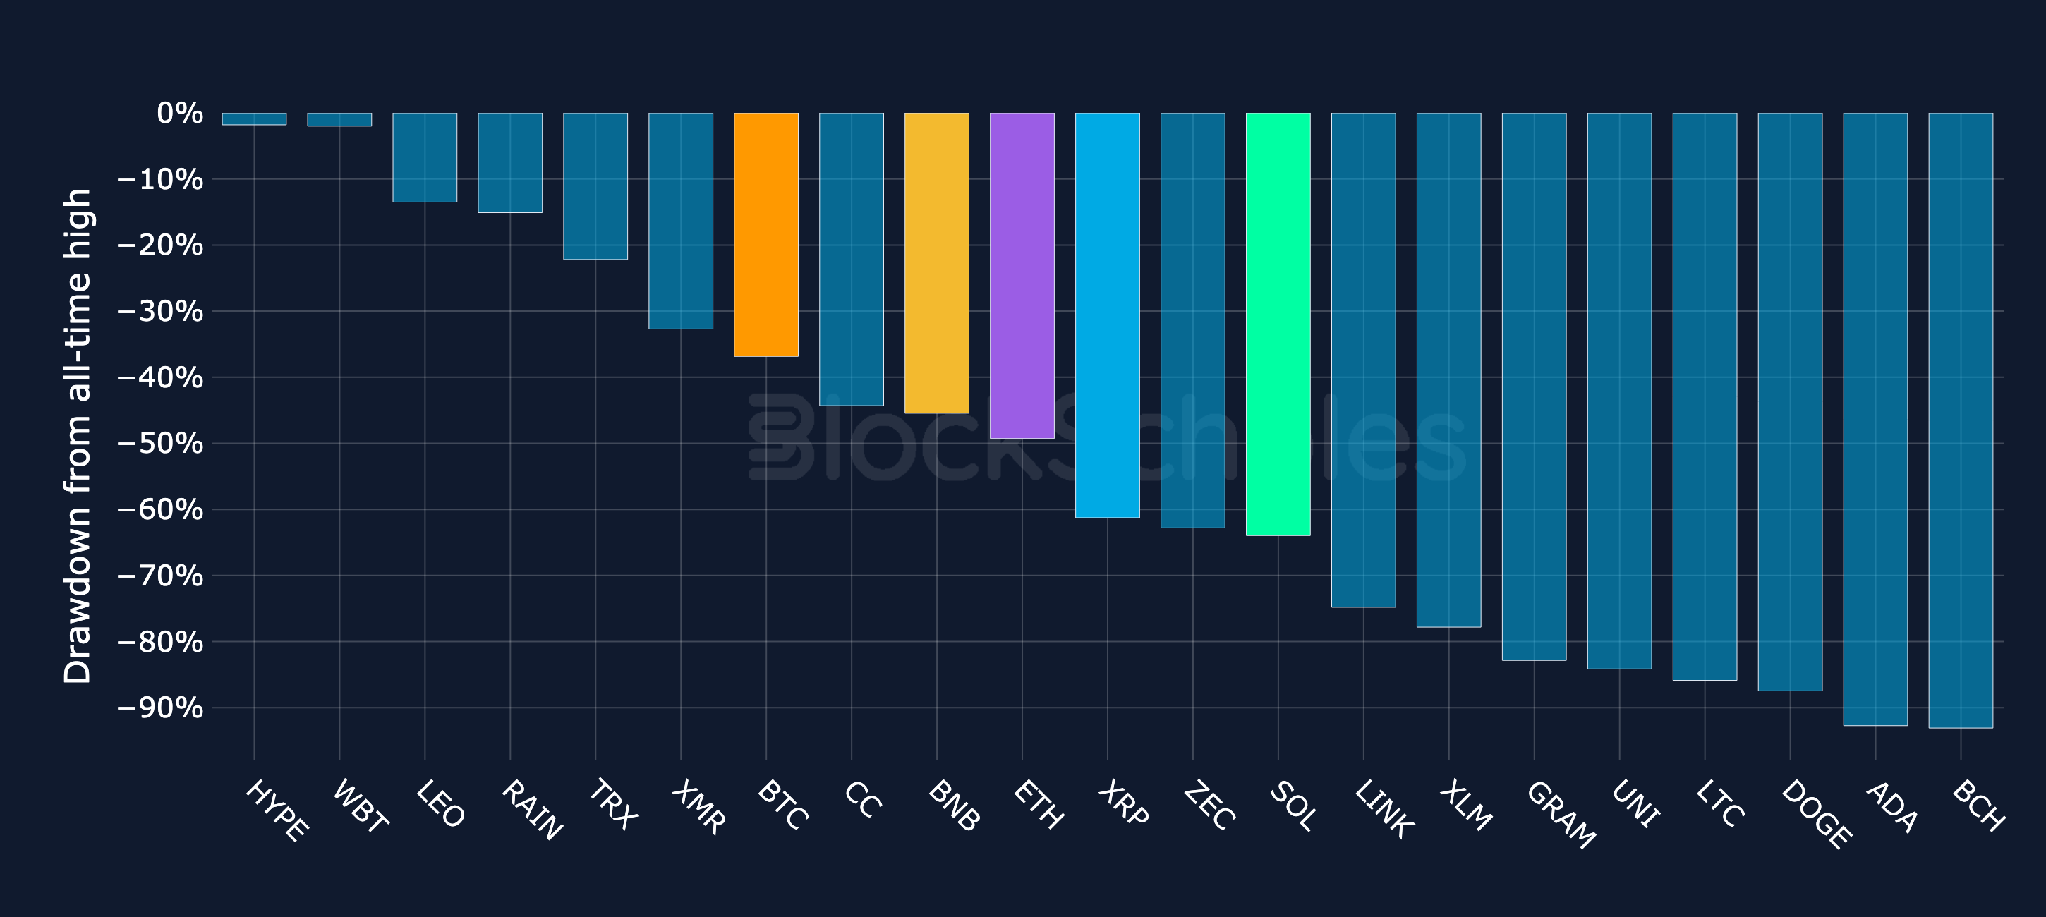
Drawdown from all-time high: BTC + top-20 altcoins by market cap
Altcoins / BTC Spot Crosses
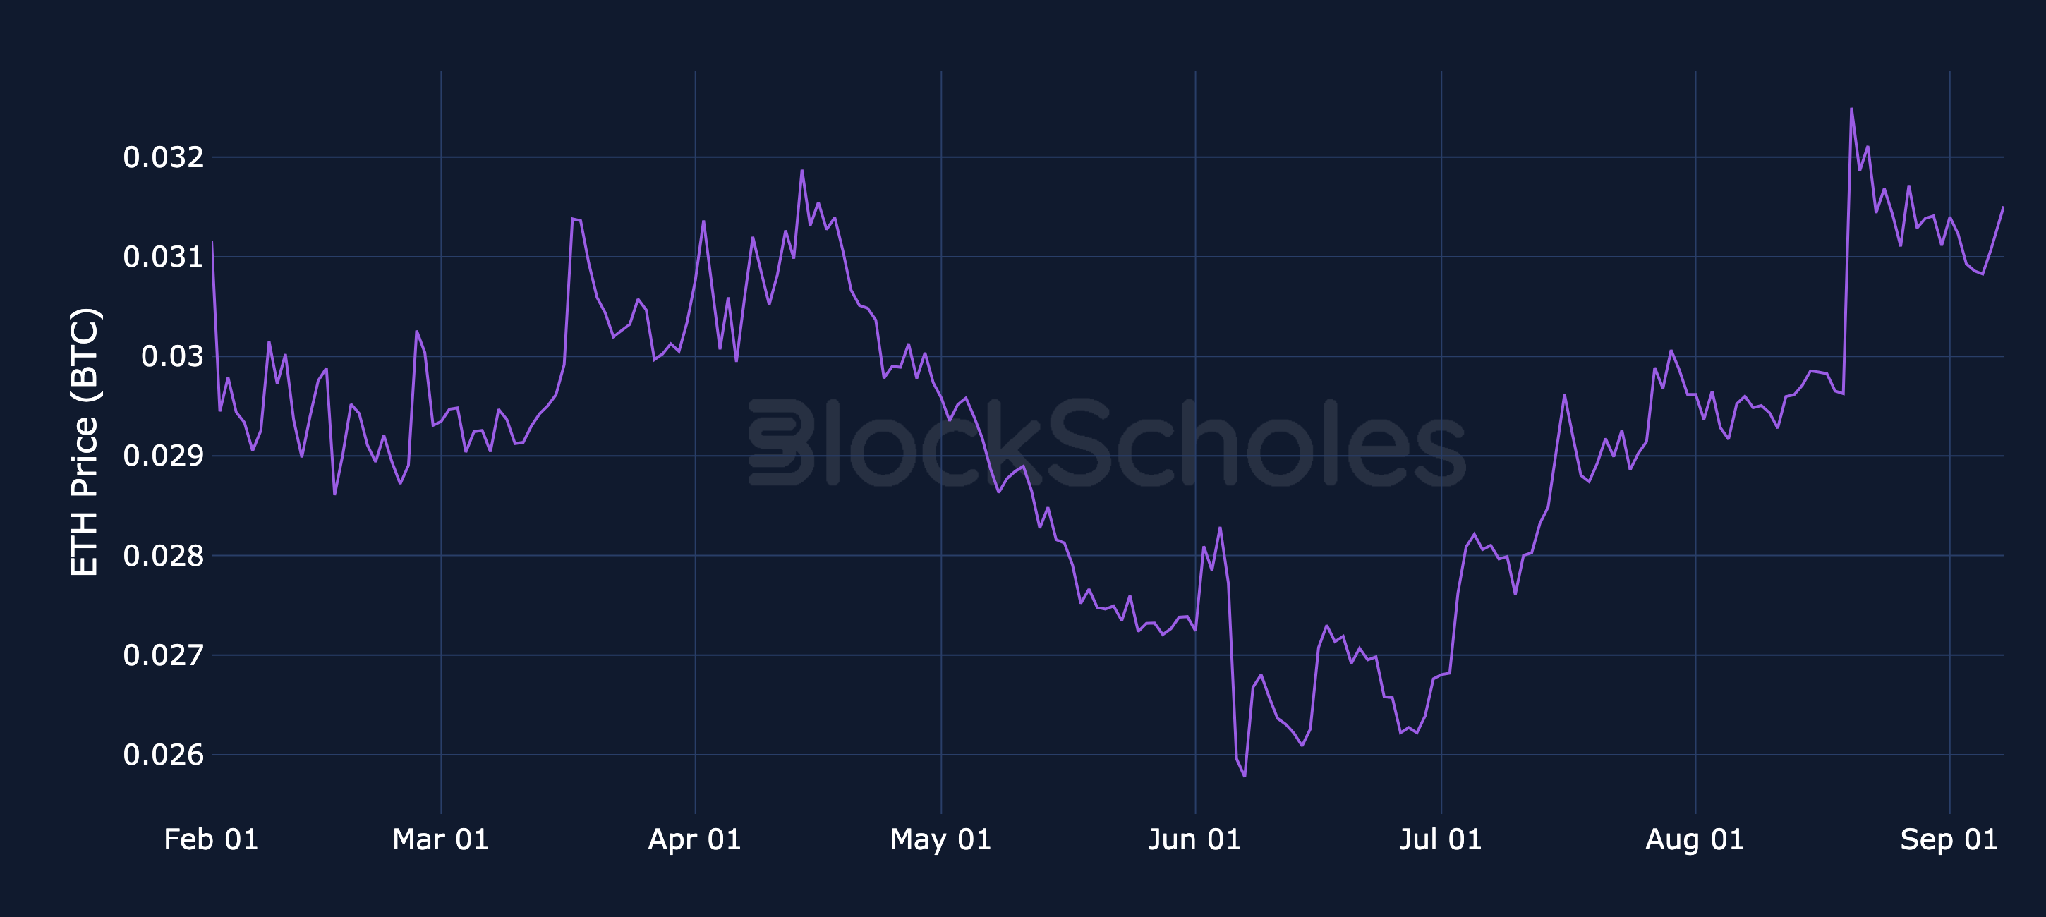
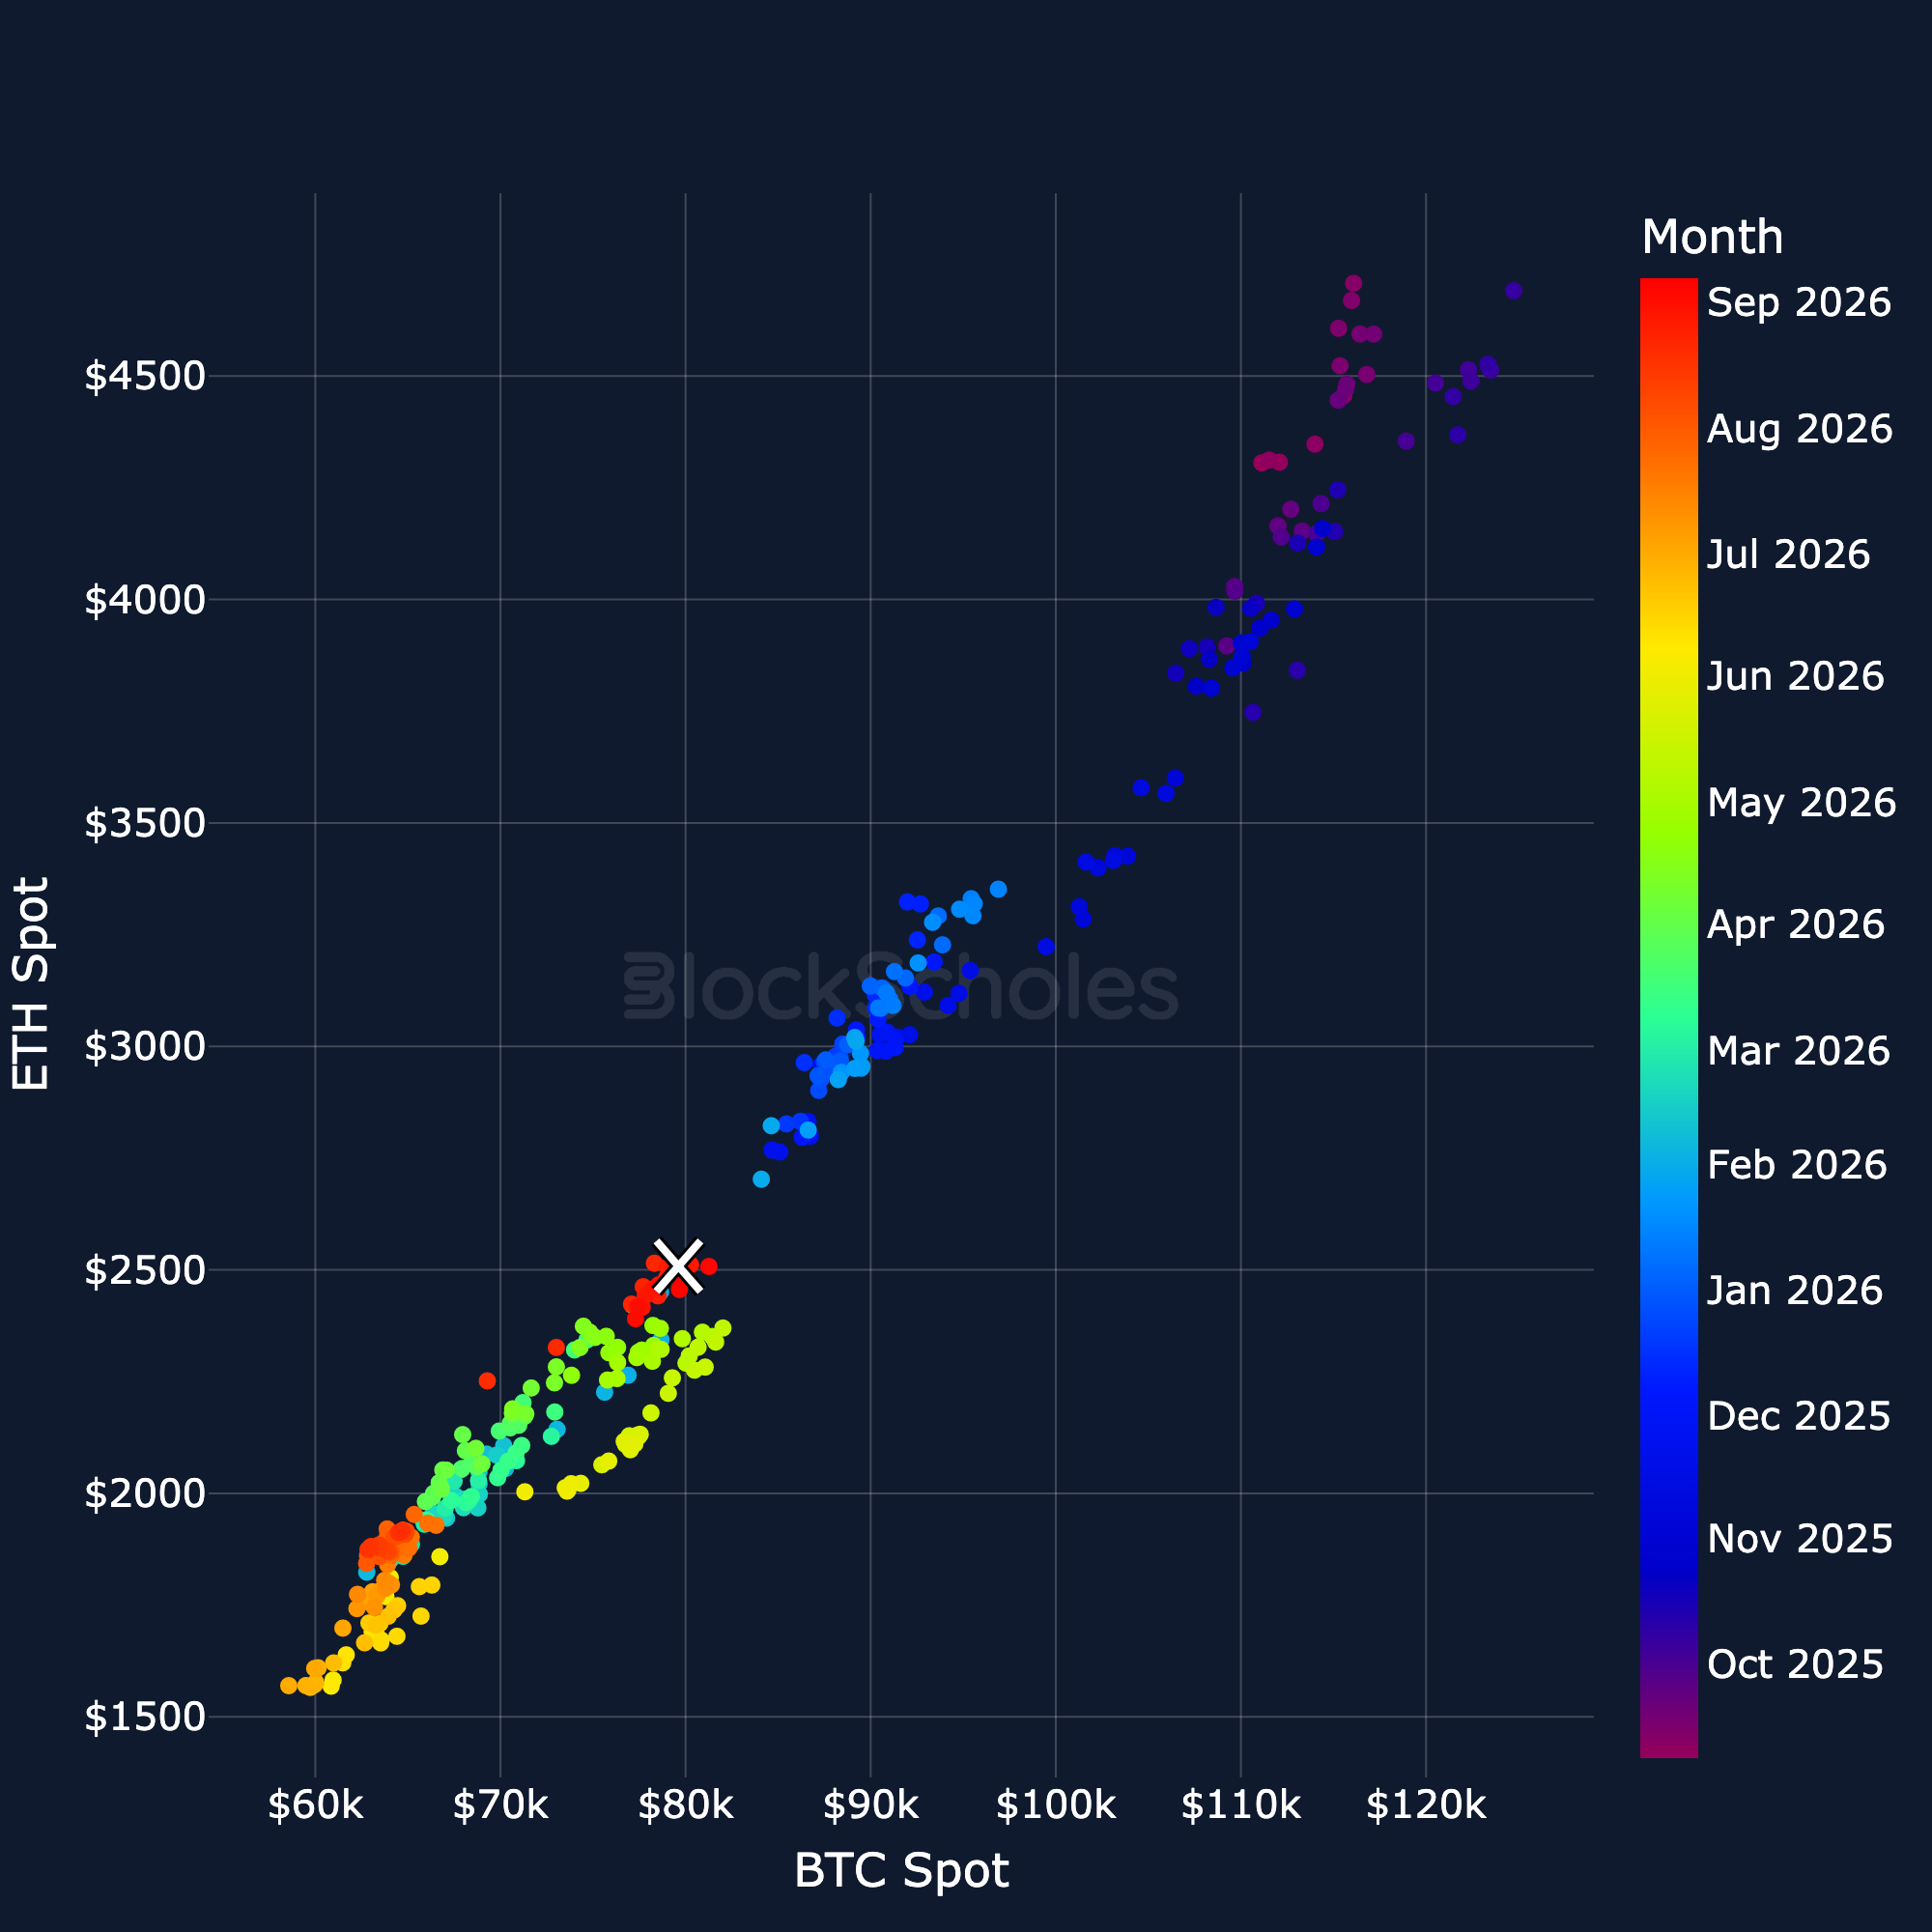
Altcoin spot prices denominated in BTC: ETH
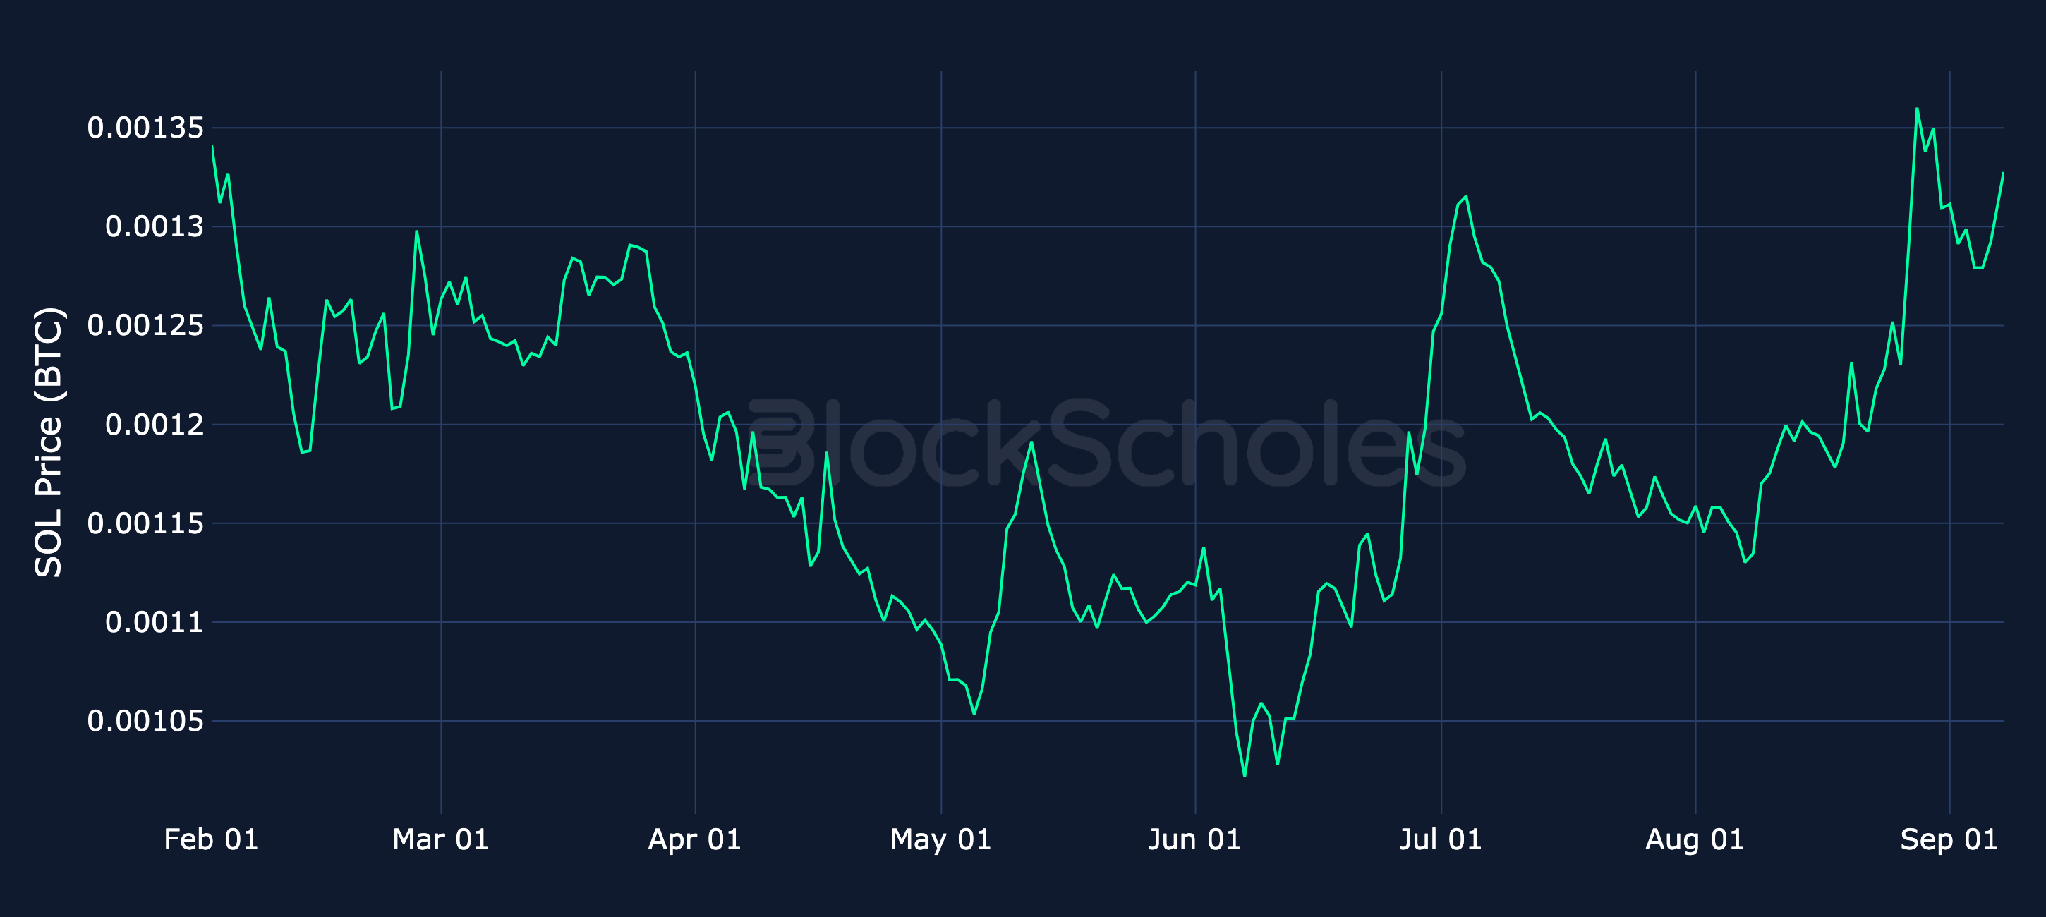
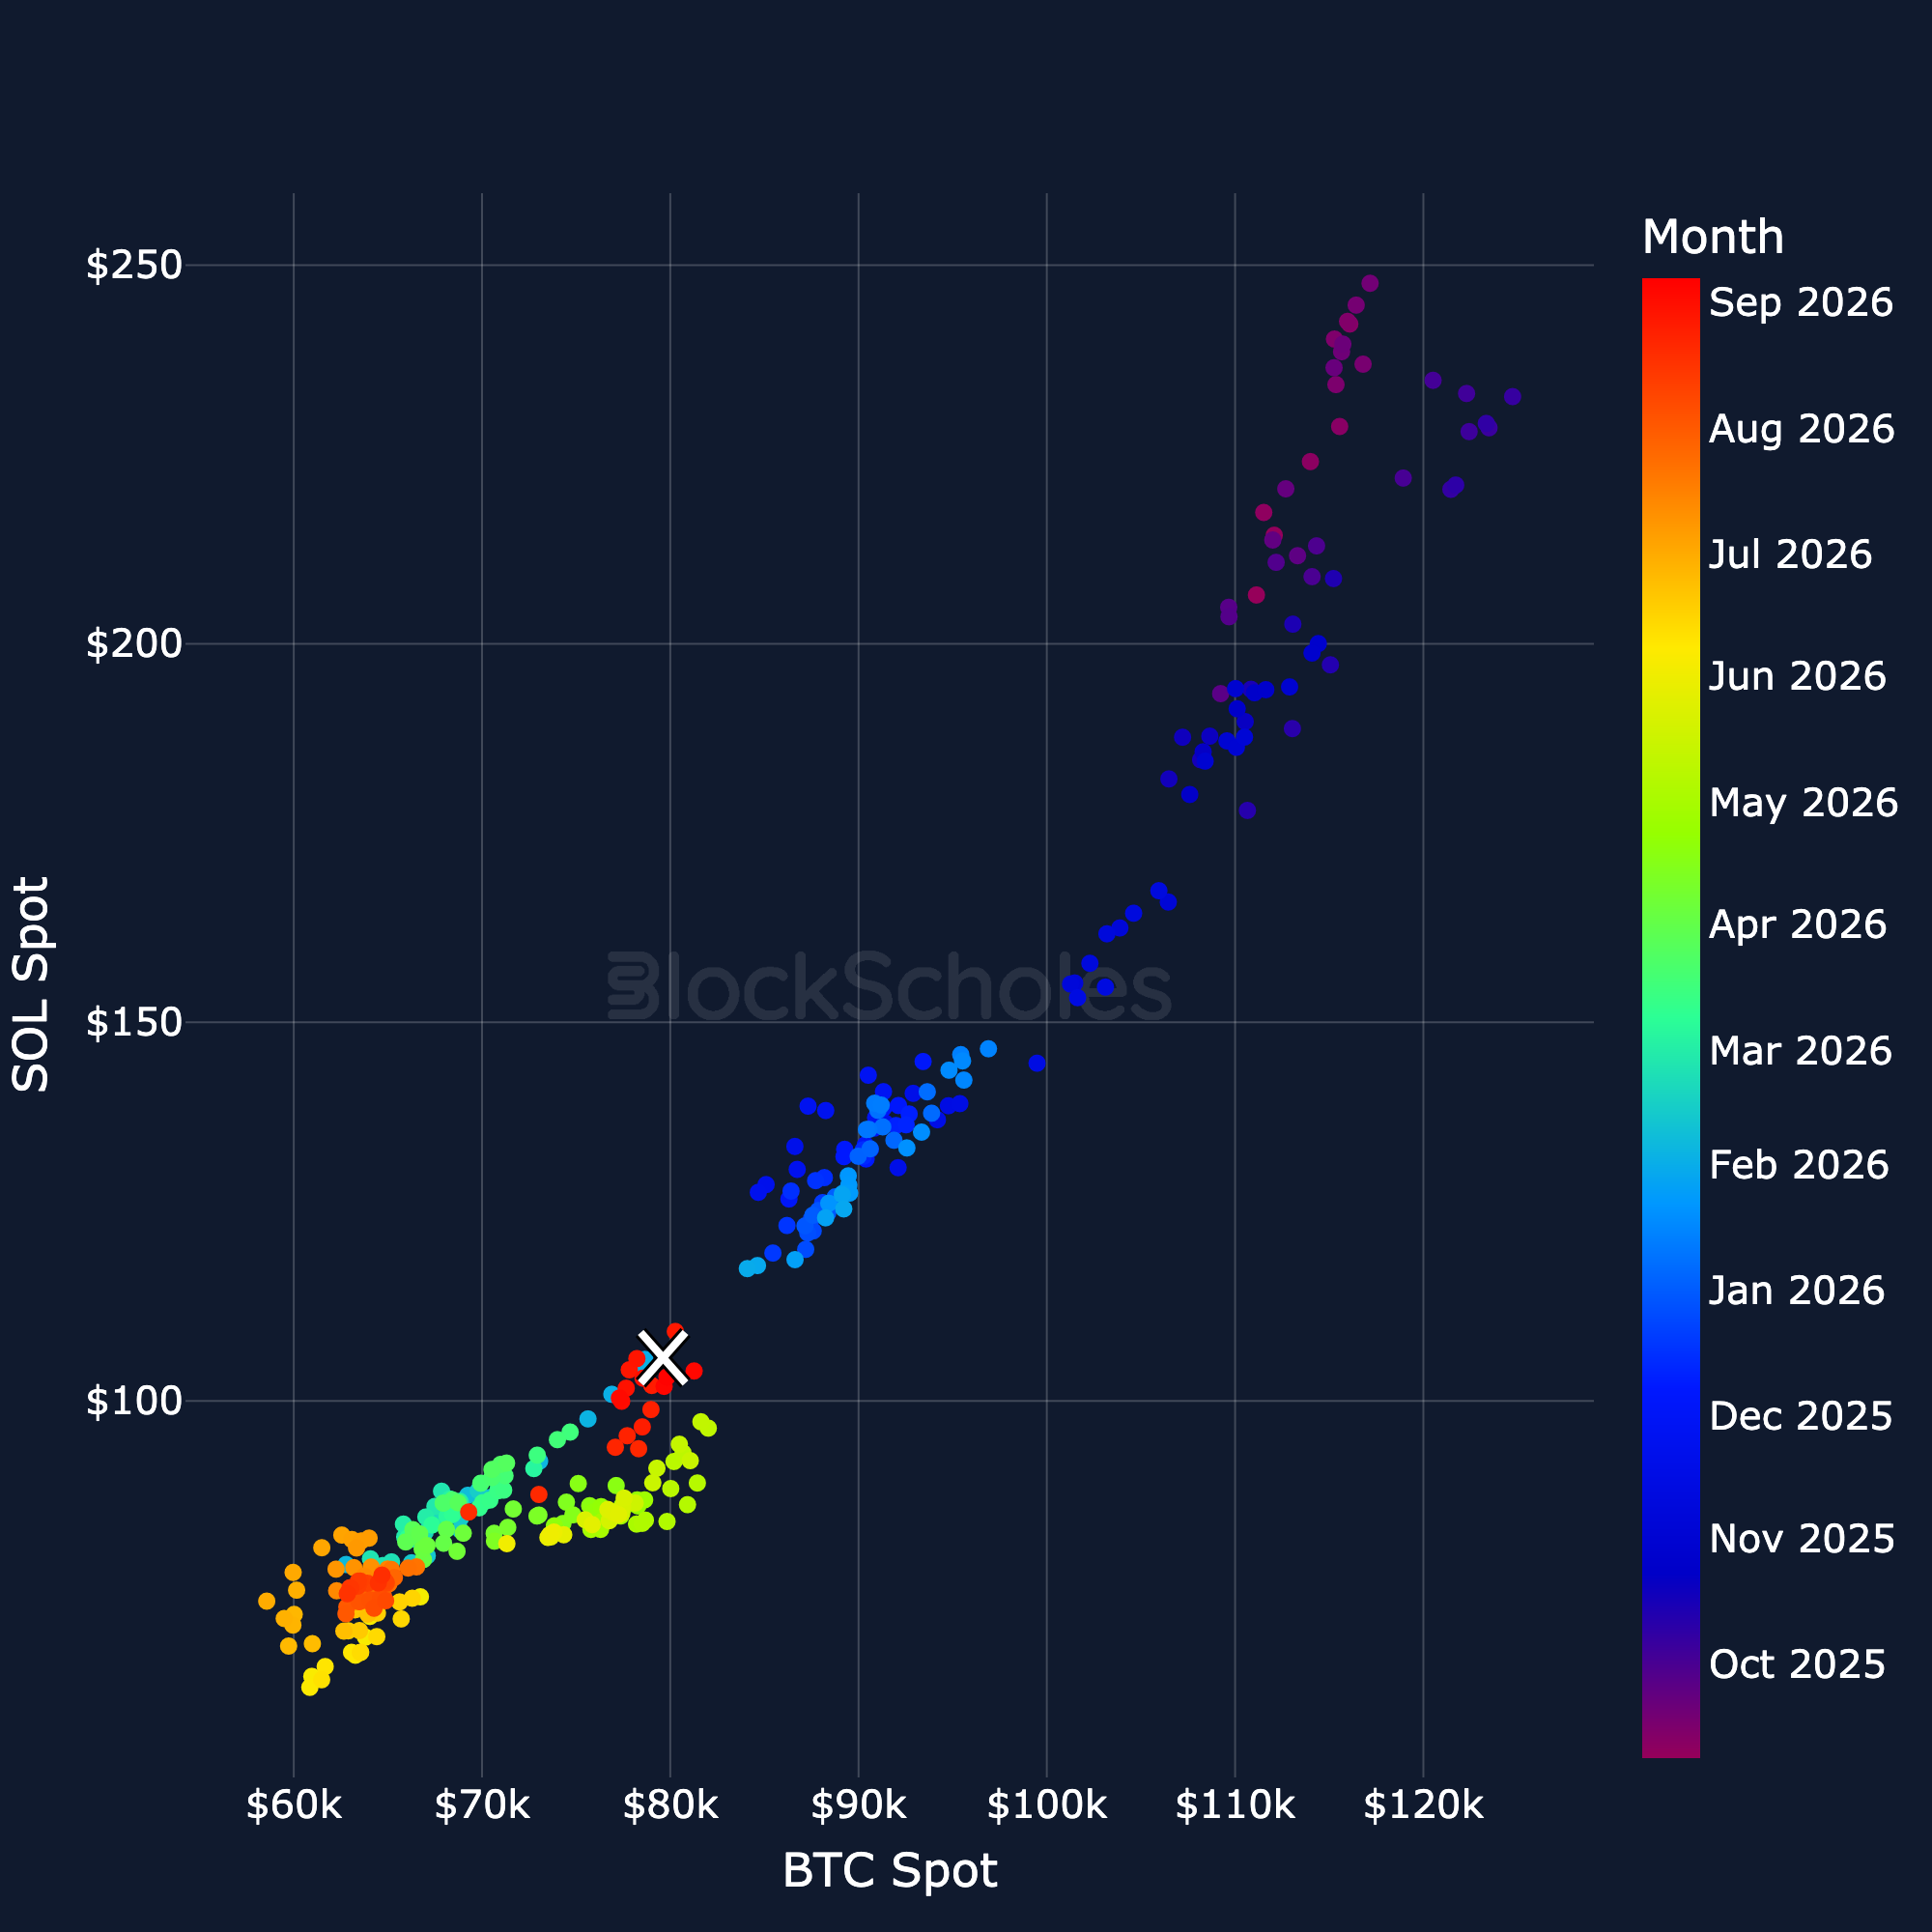
Altcoin spot prices denominated in BTC: SOL
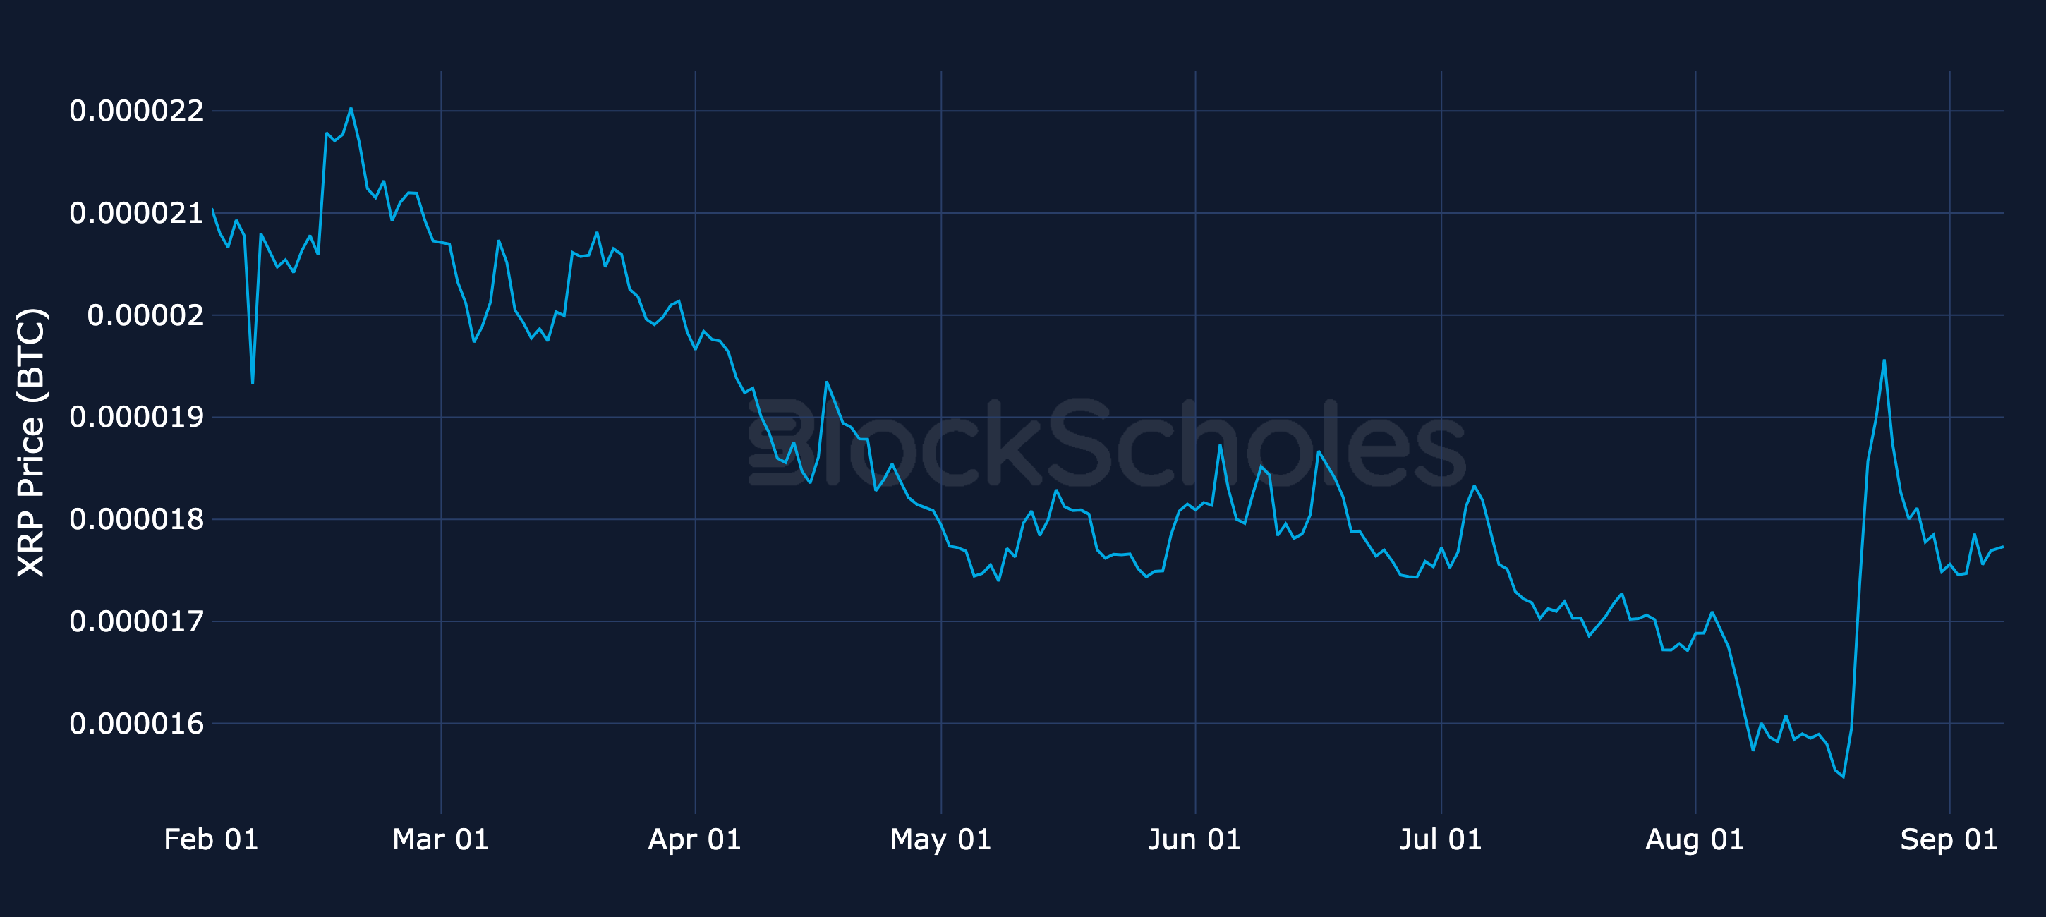
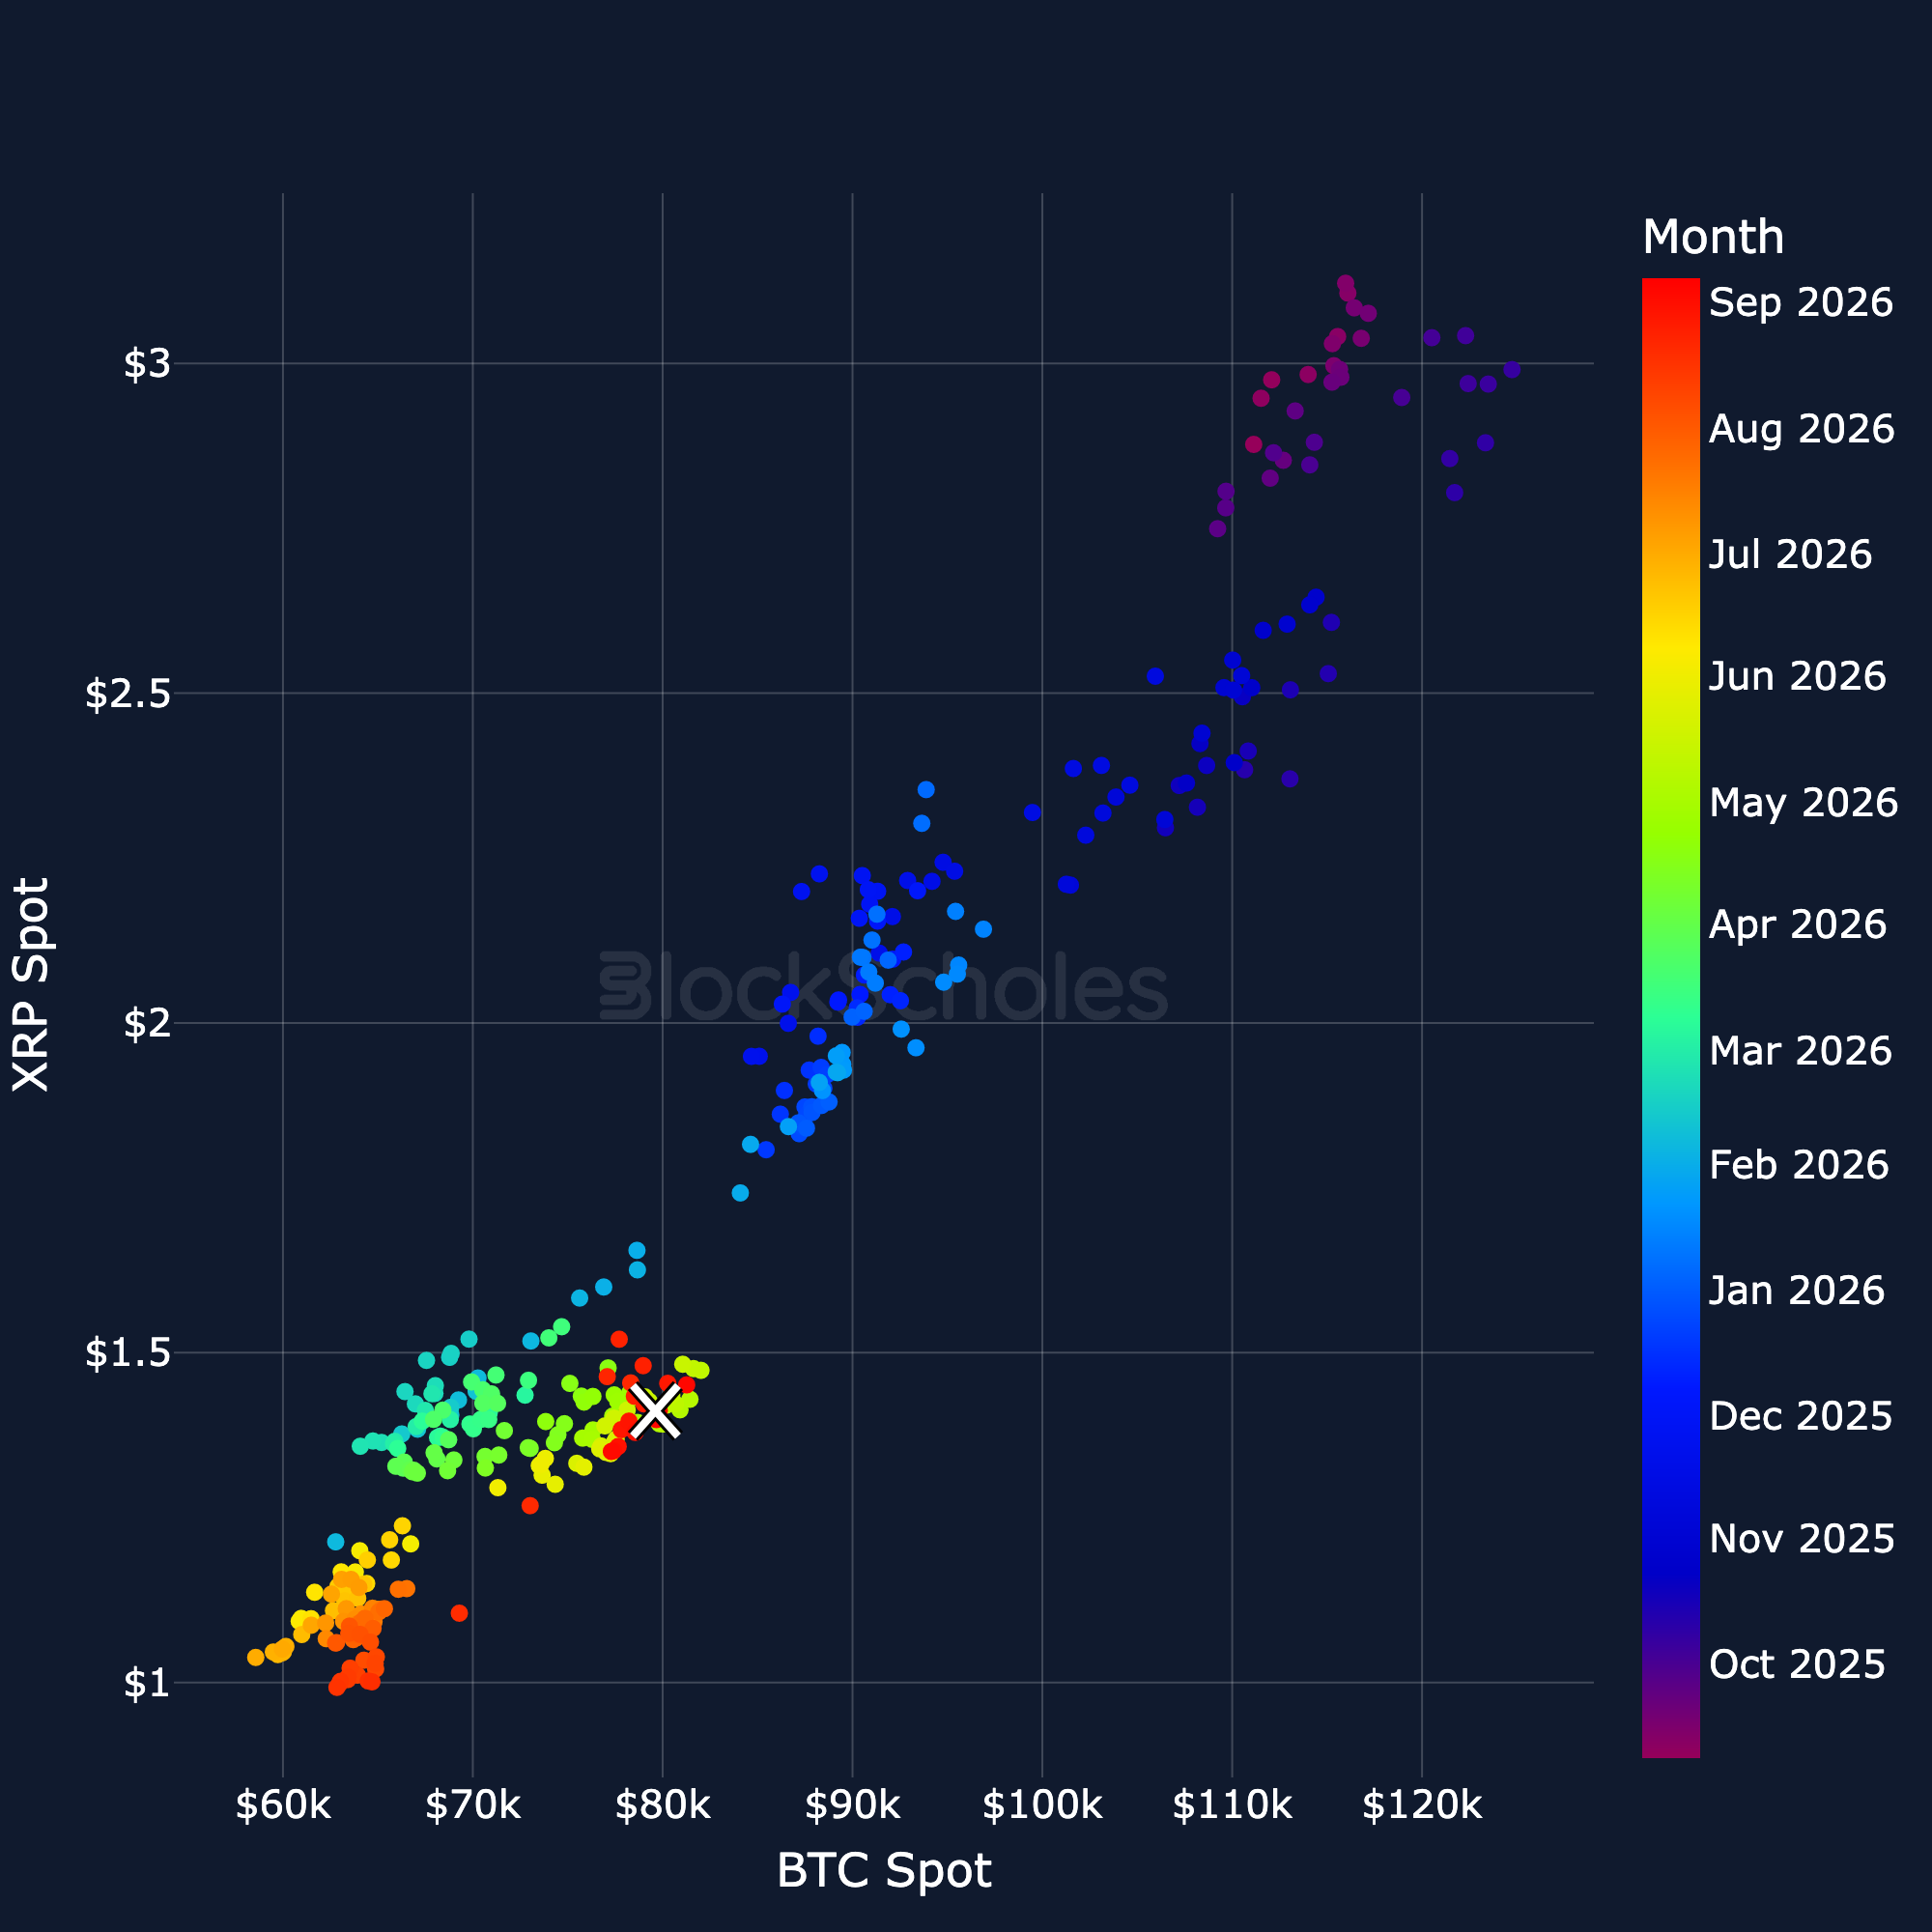
Altcoin spot prices denominated in BTC: XRP
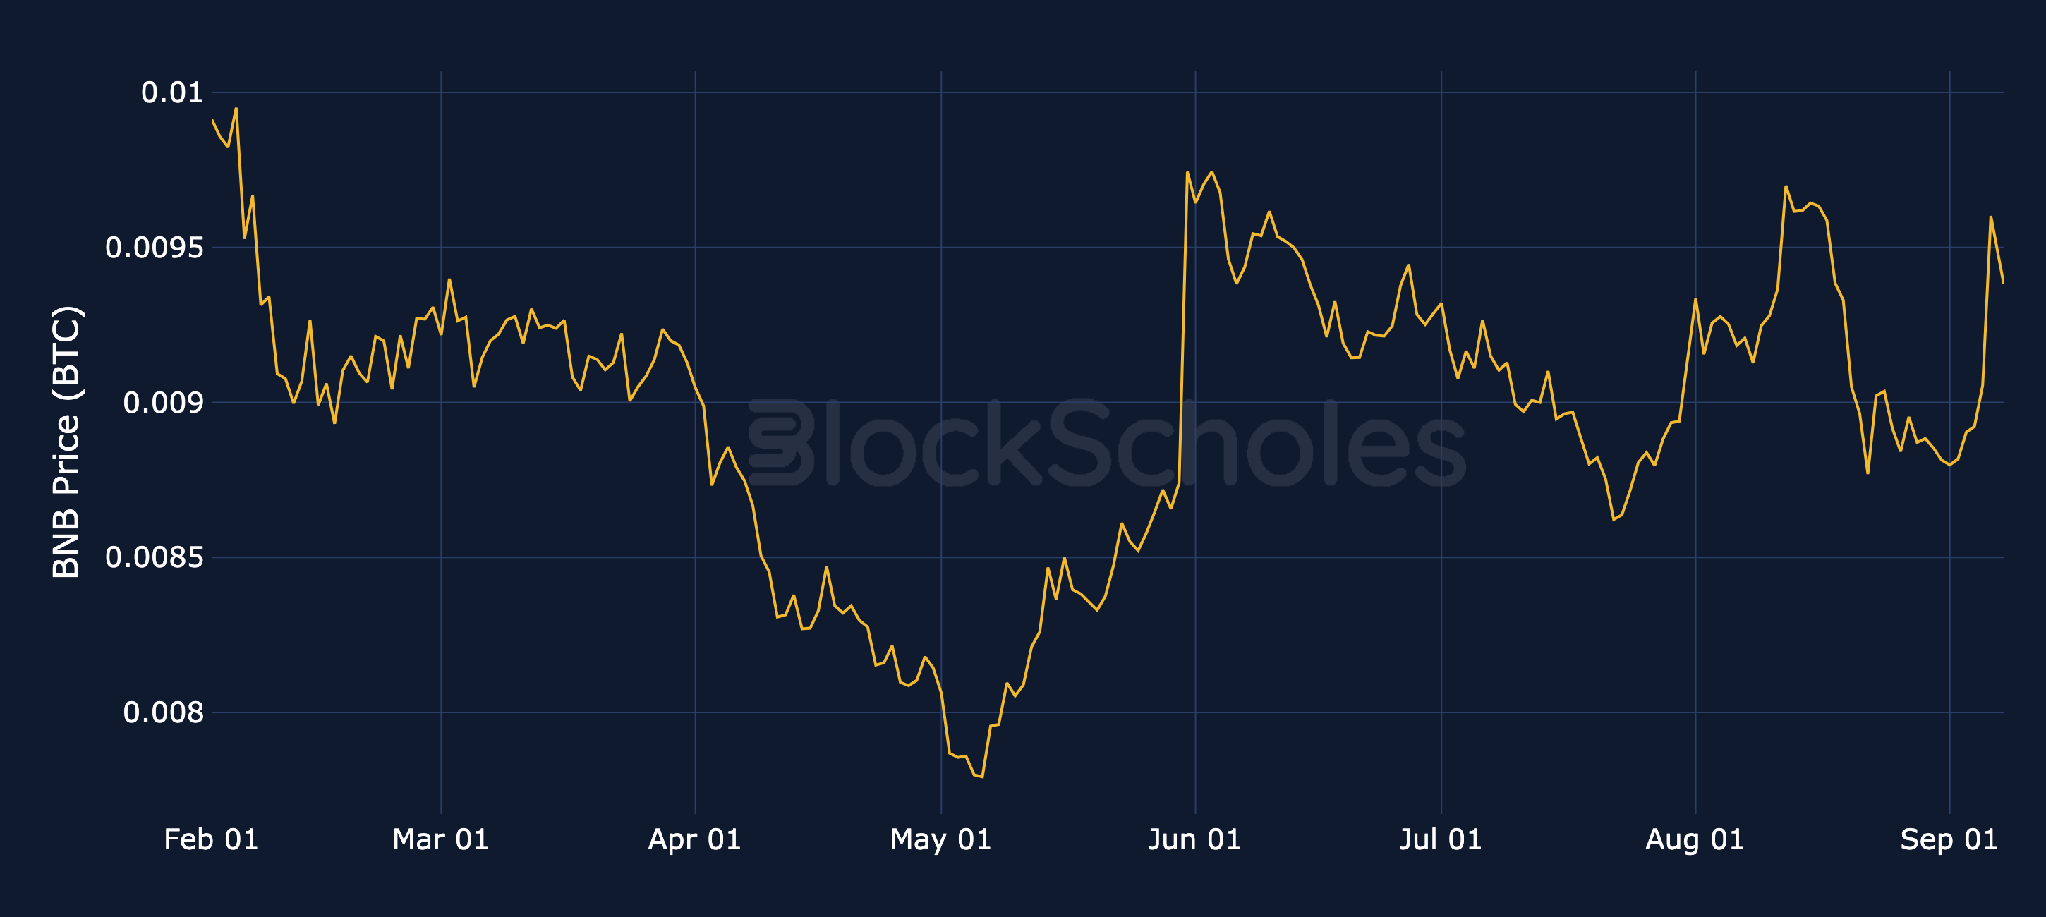
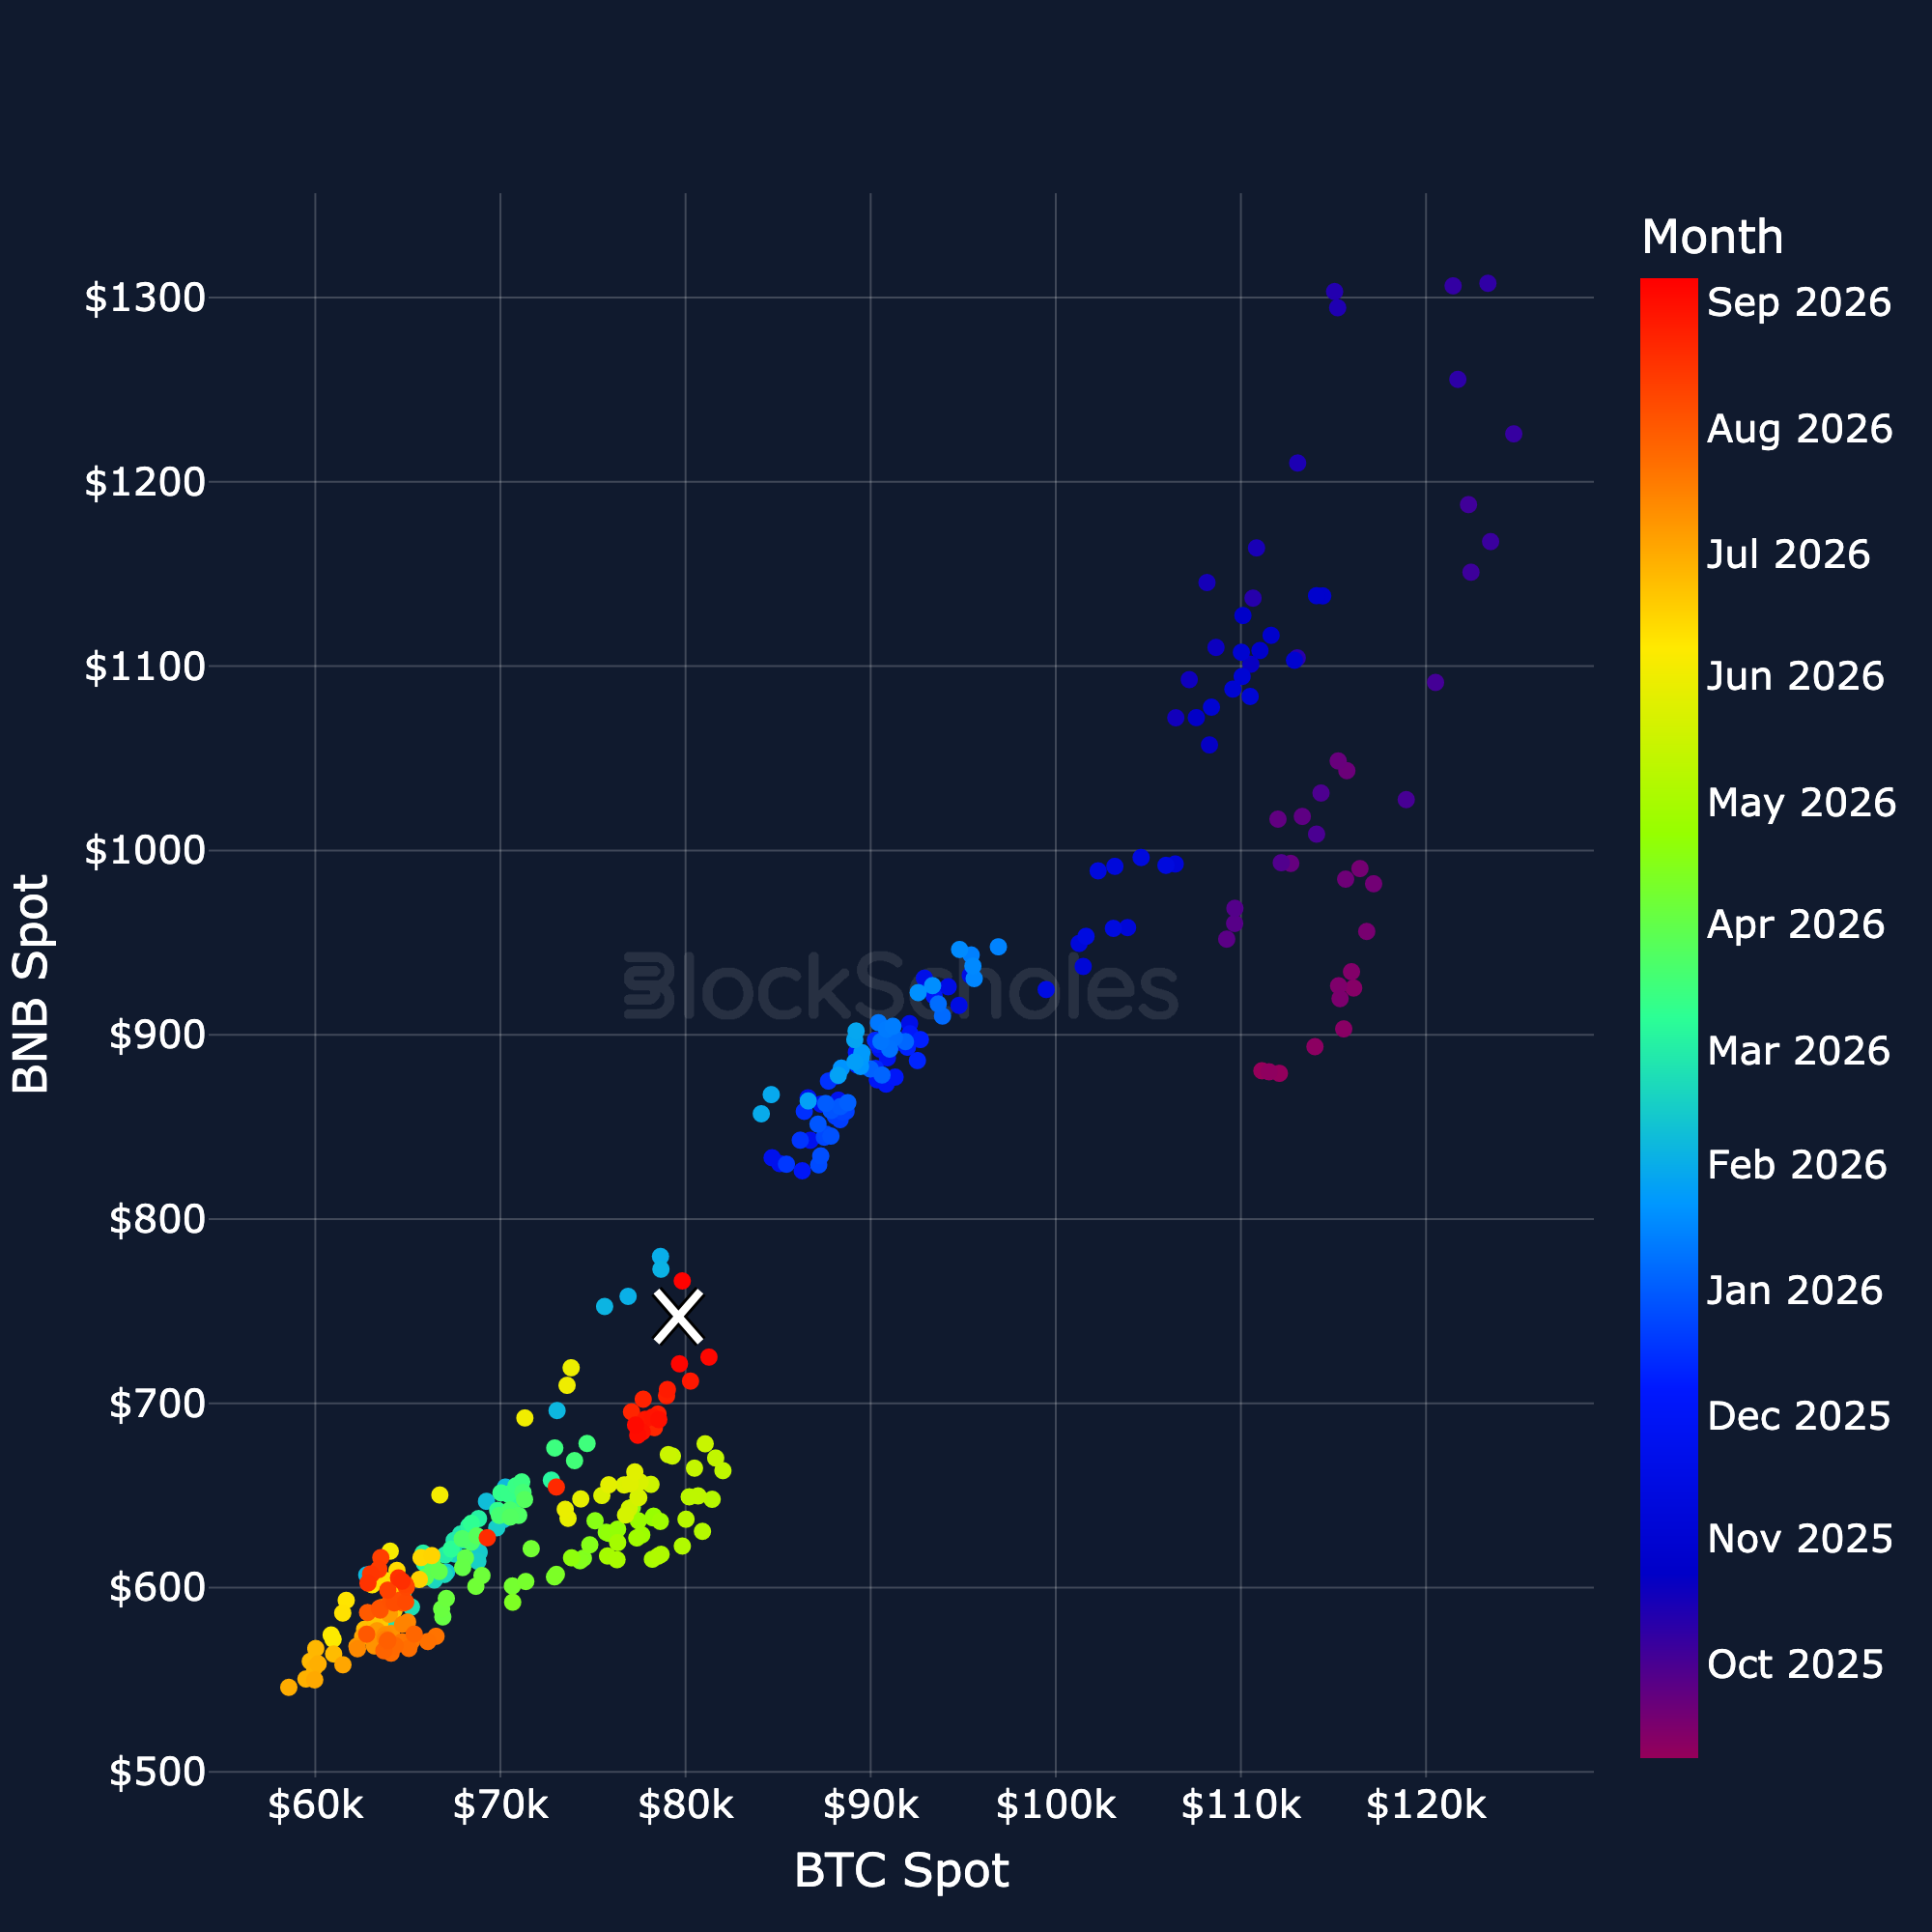
Altcoin spot prices denominated in BTC: BNB
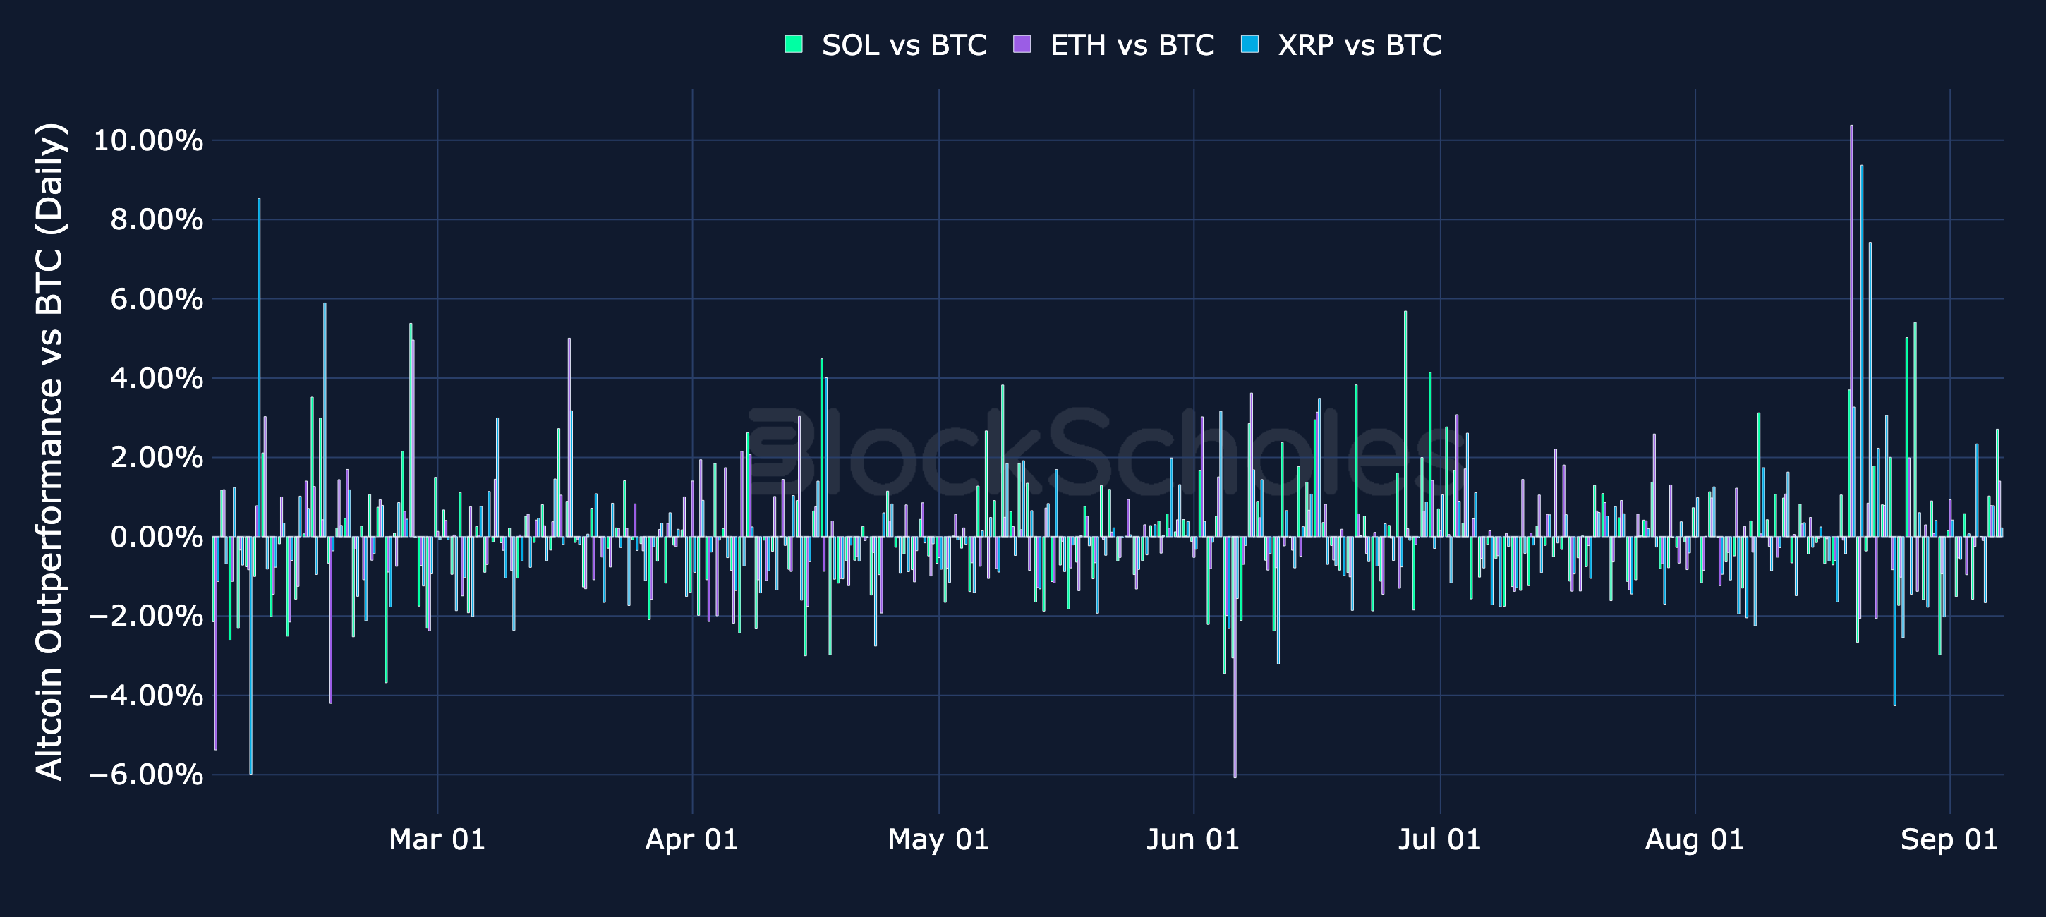
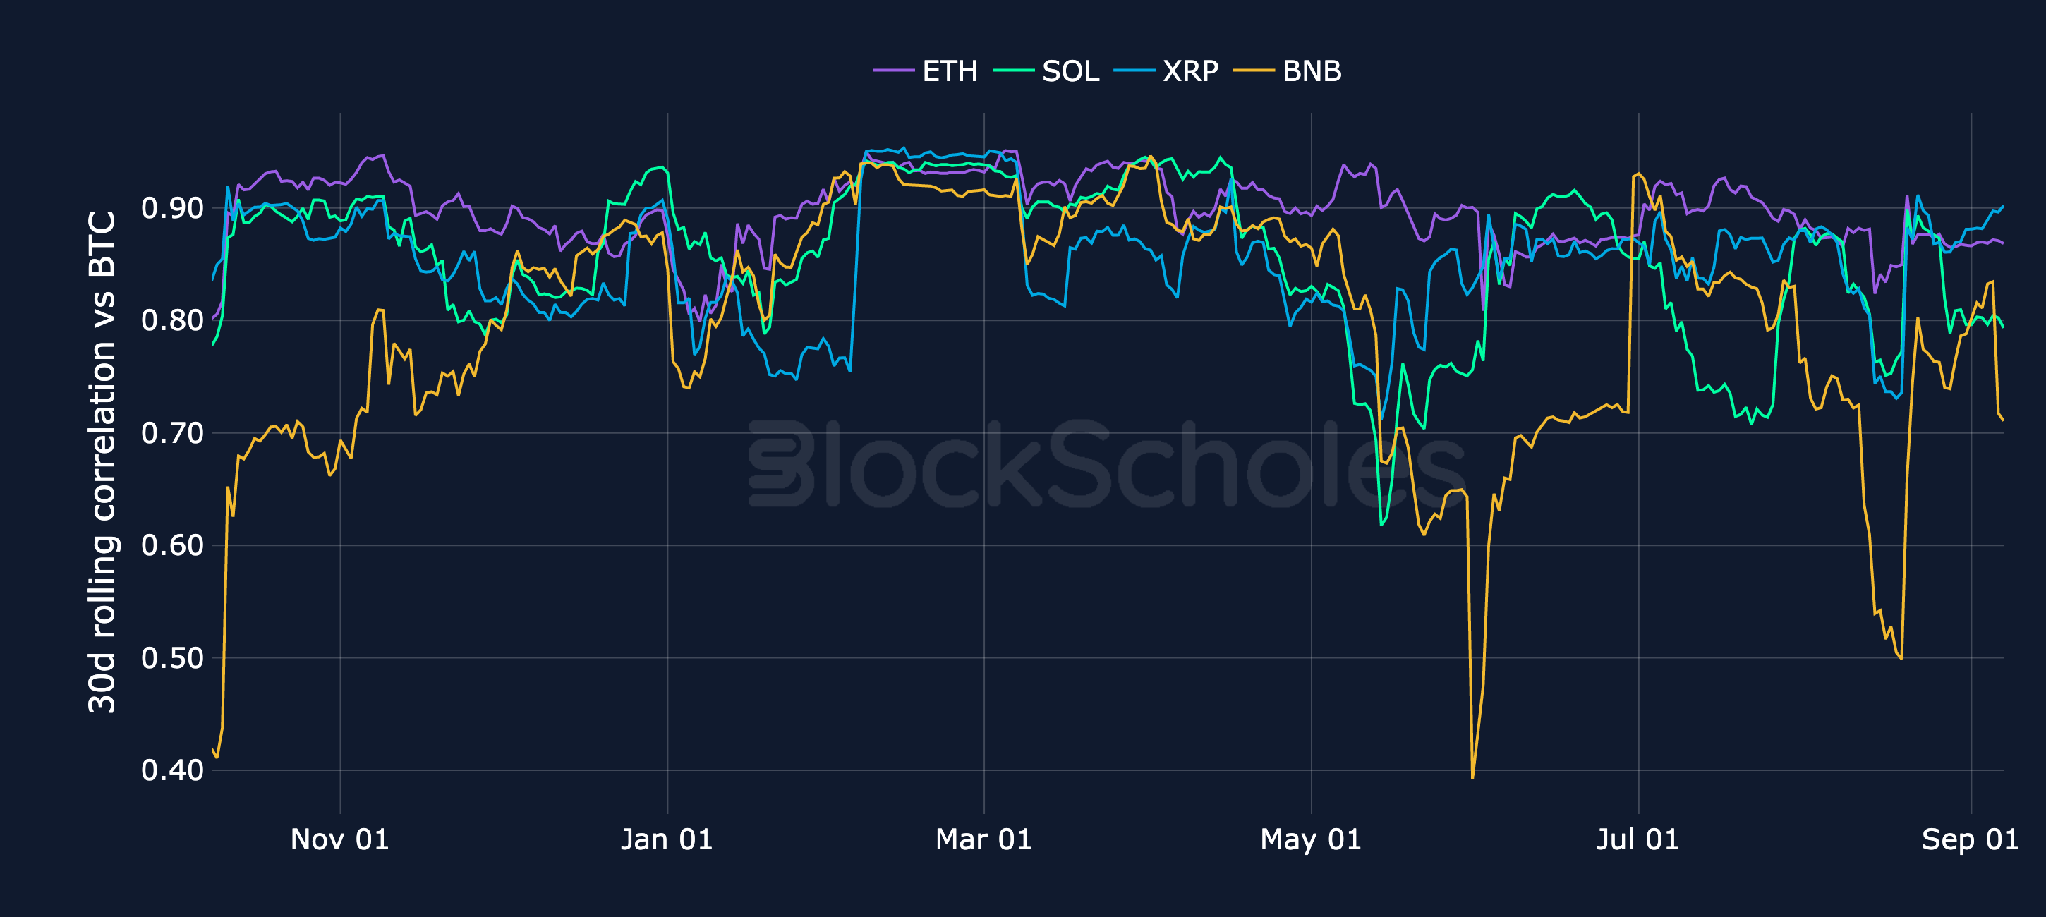
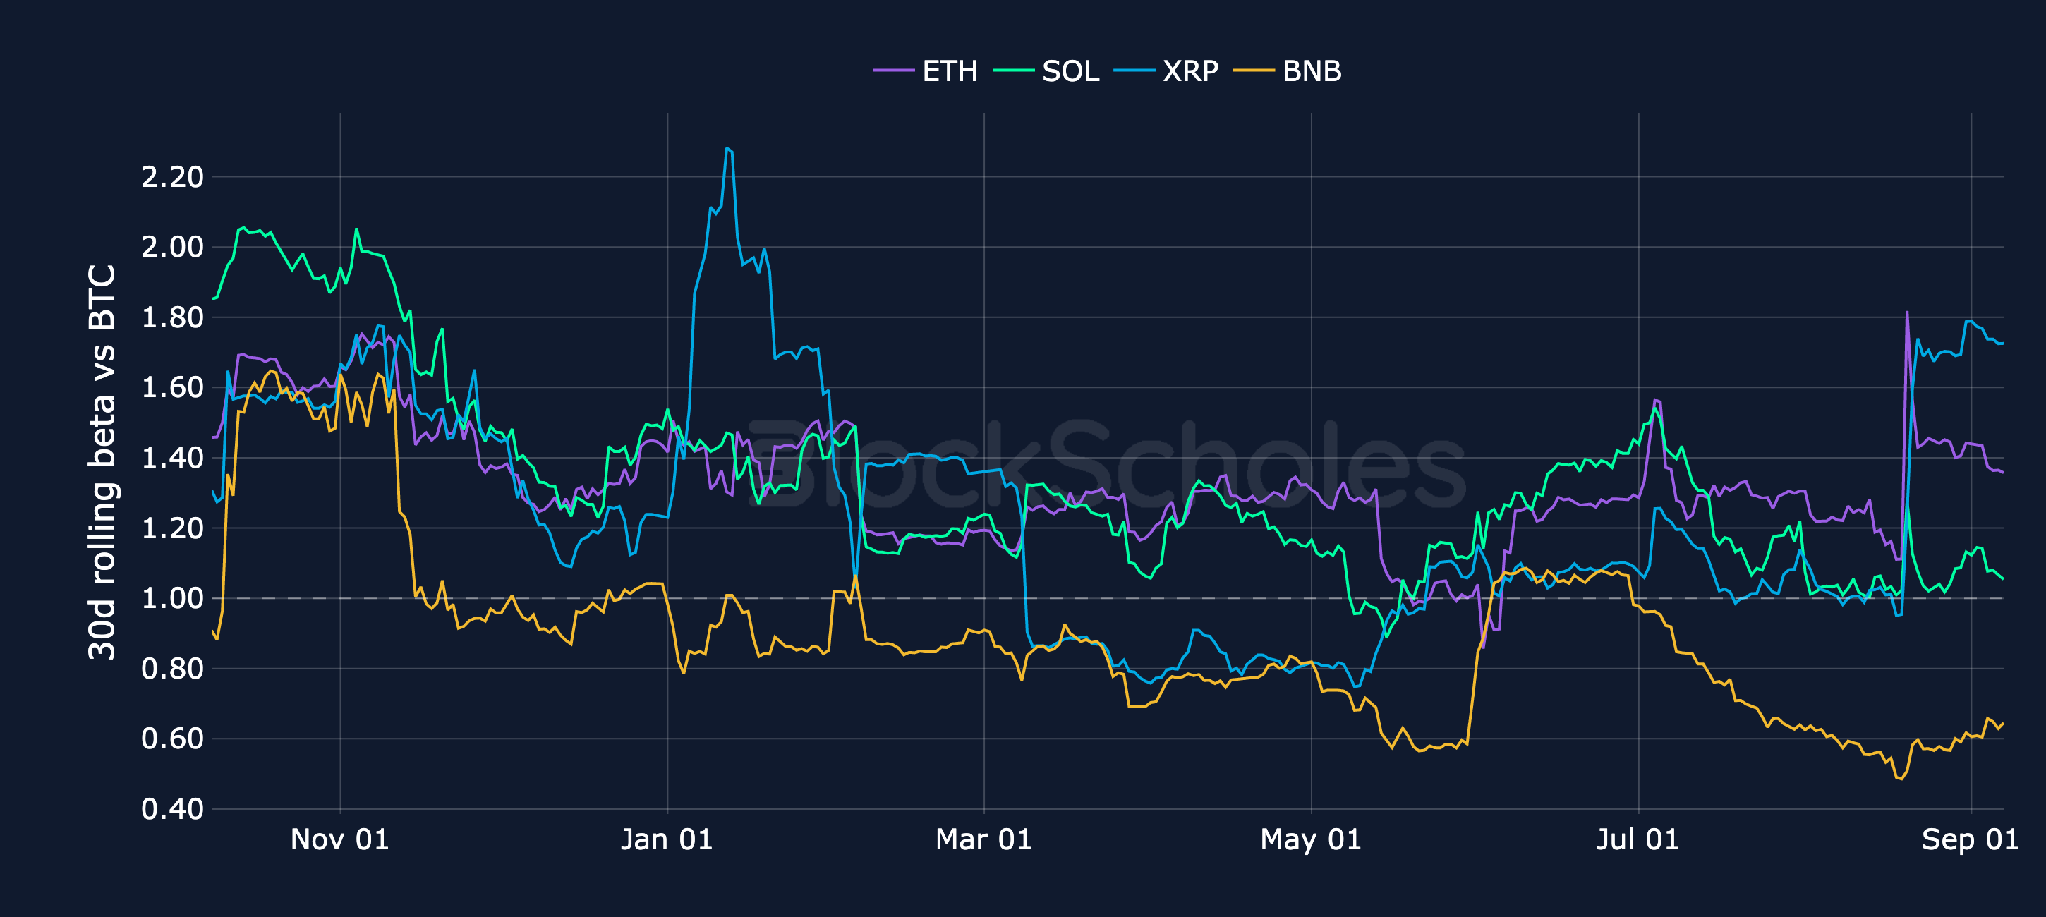
Altcoins performance vs BTC
Daily relative simple returns vs BTC
Rolling 30-day correlation vs BTC
Rolling 30-day beta vs BTC
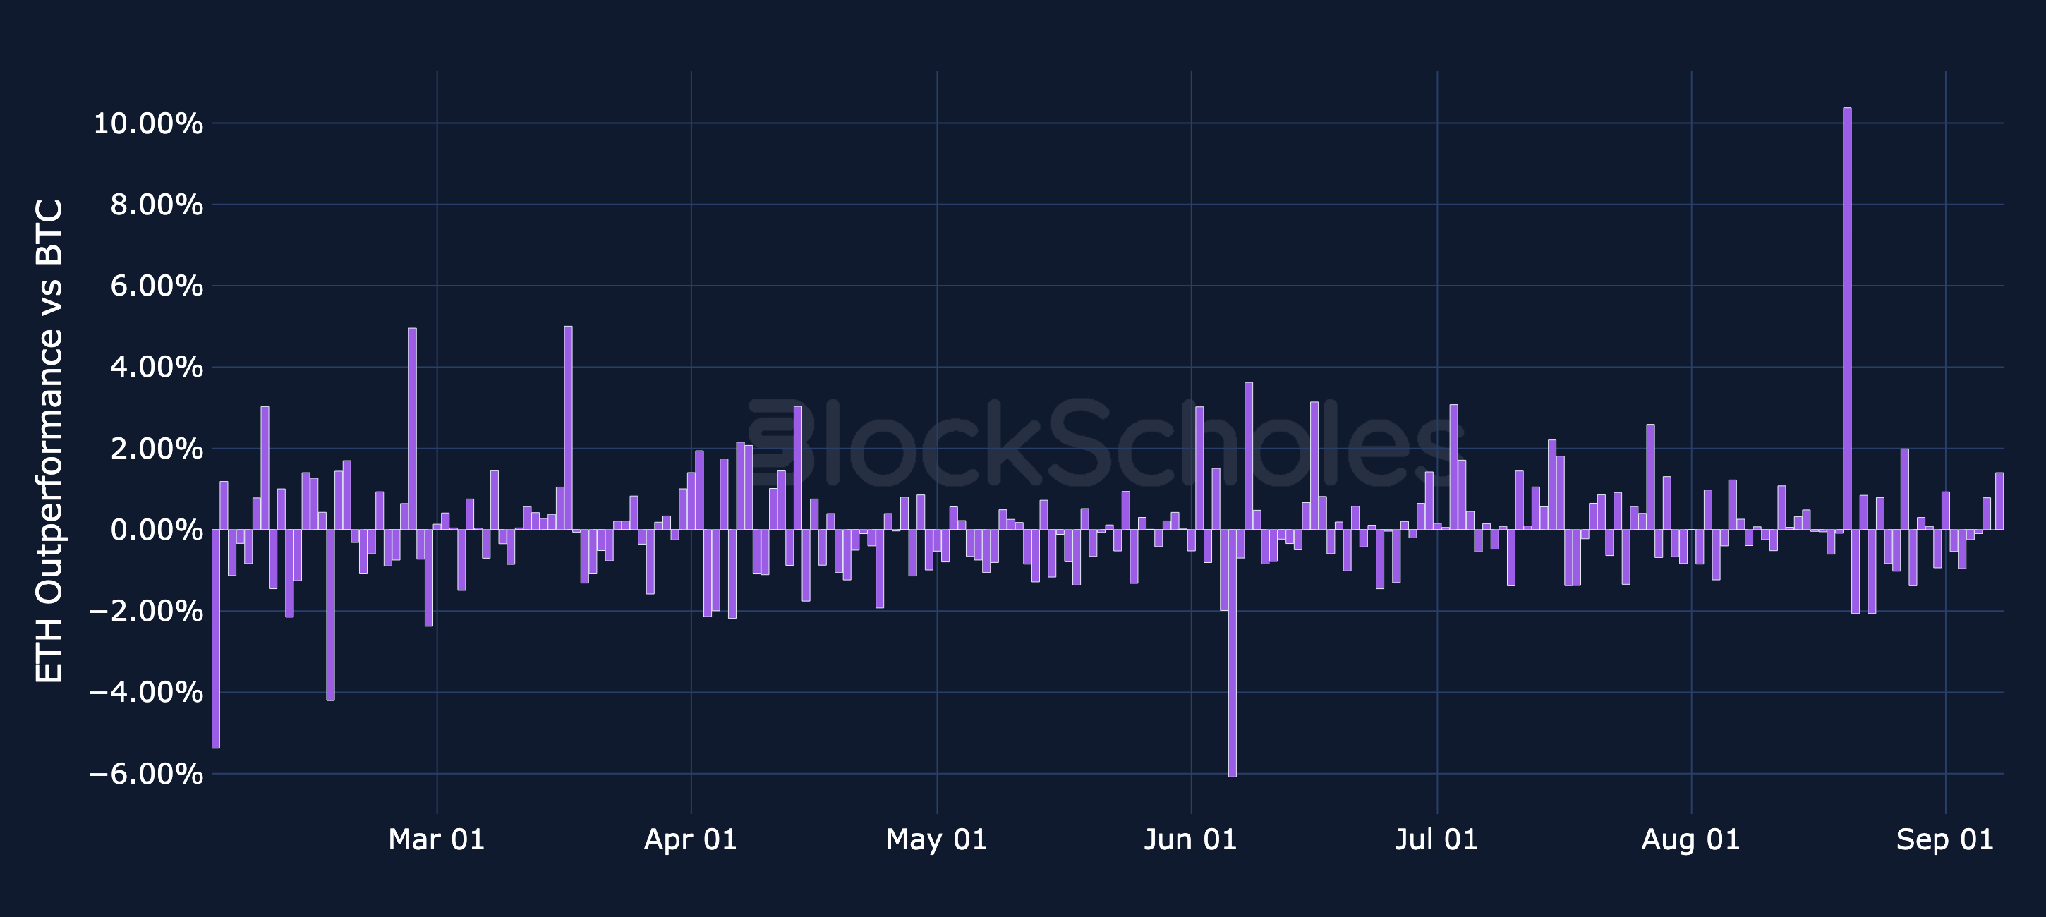
Altcoin Performance vs BTC
Daily relative simple returns vs BTC: ETH
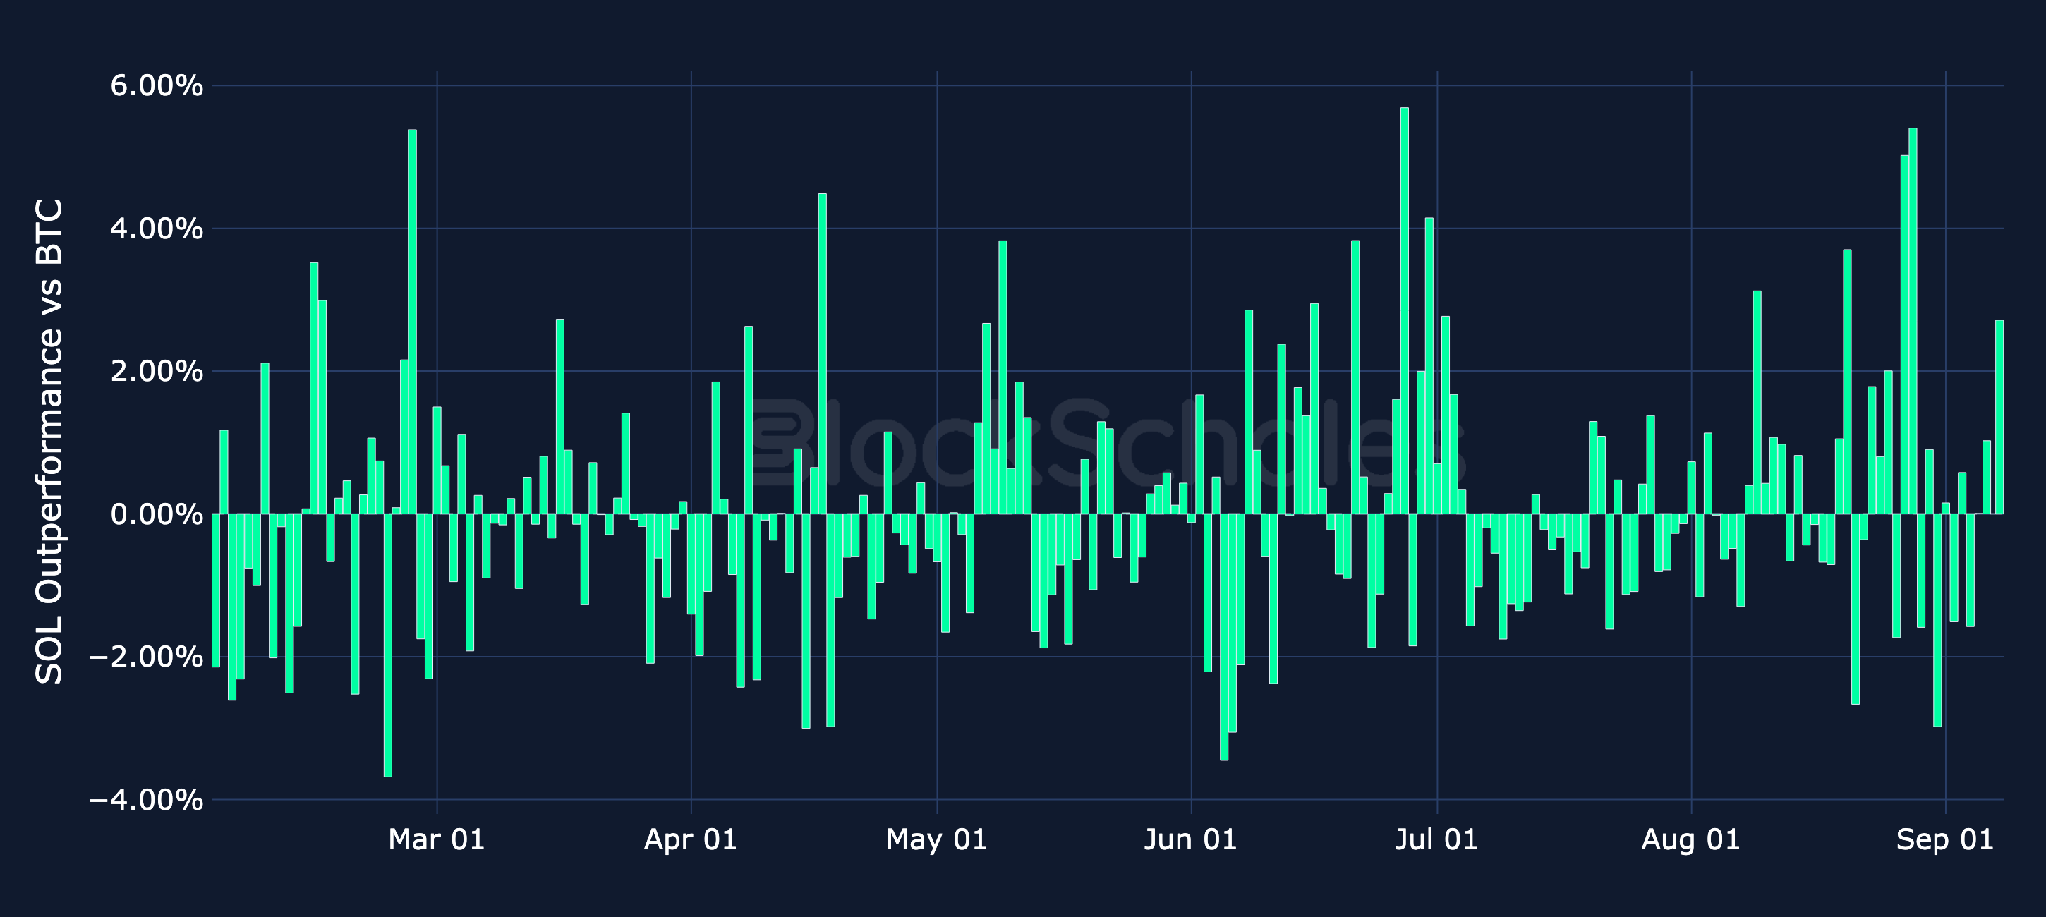
Daily relative simple returns vs BTC: SOL
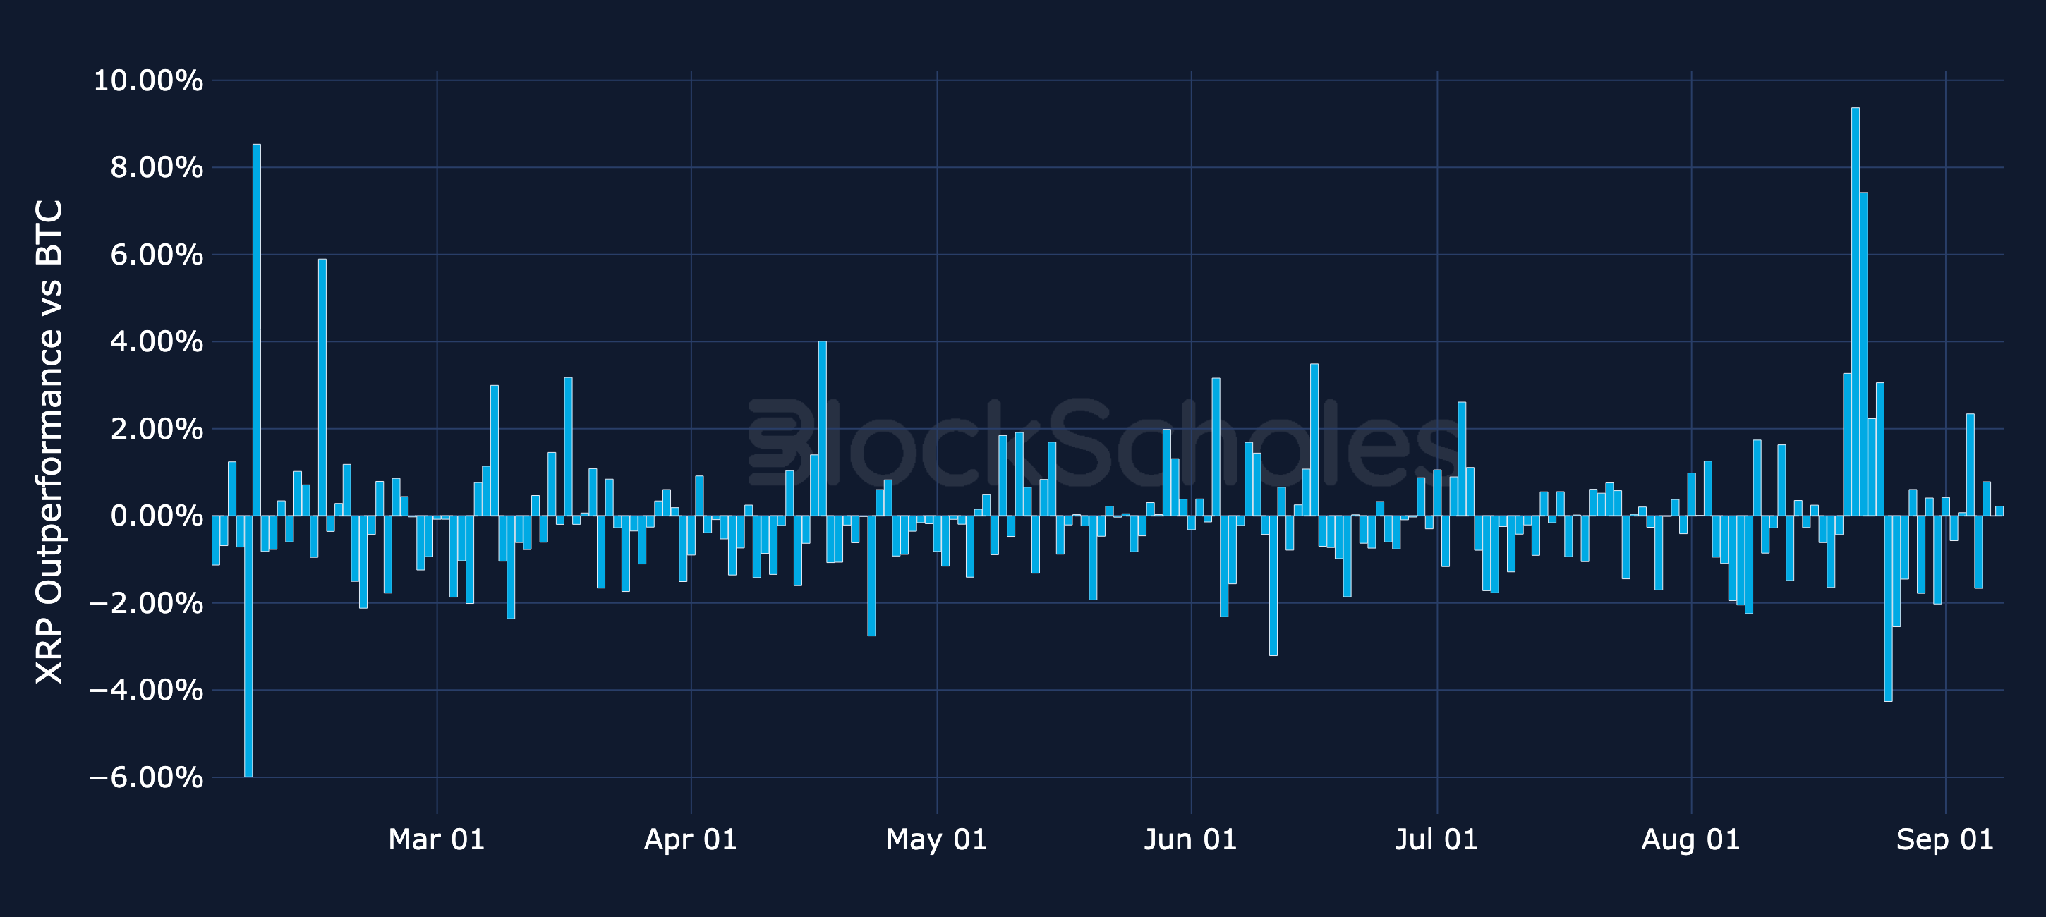
Daily relative simple returns vs BTC: XRP
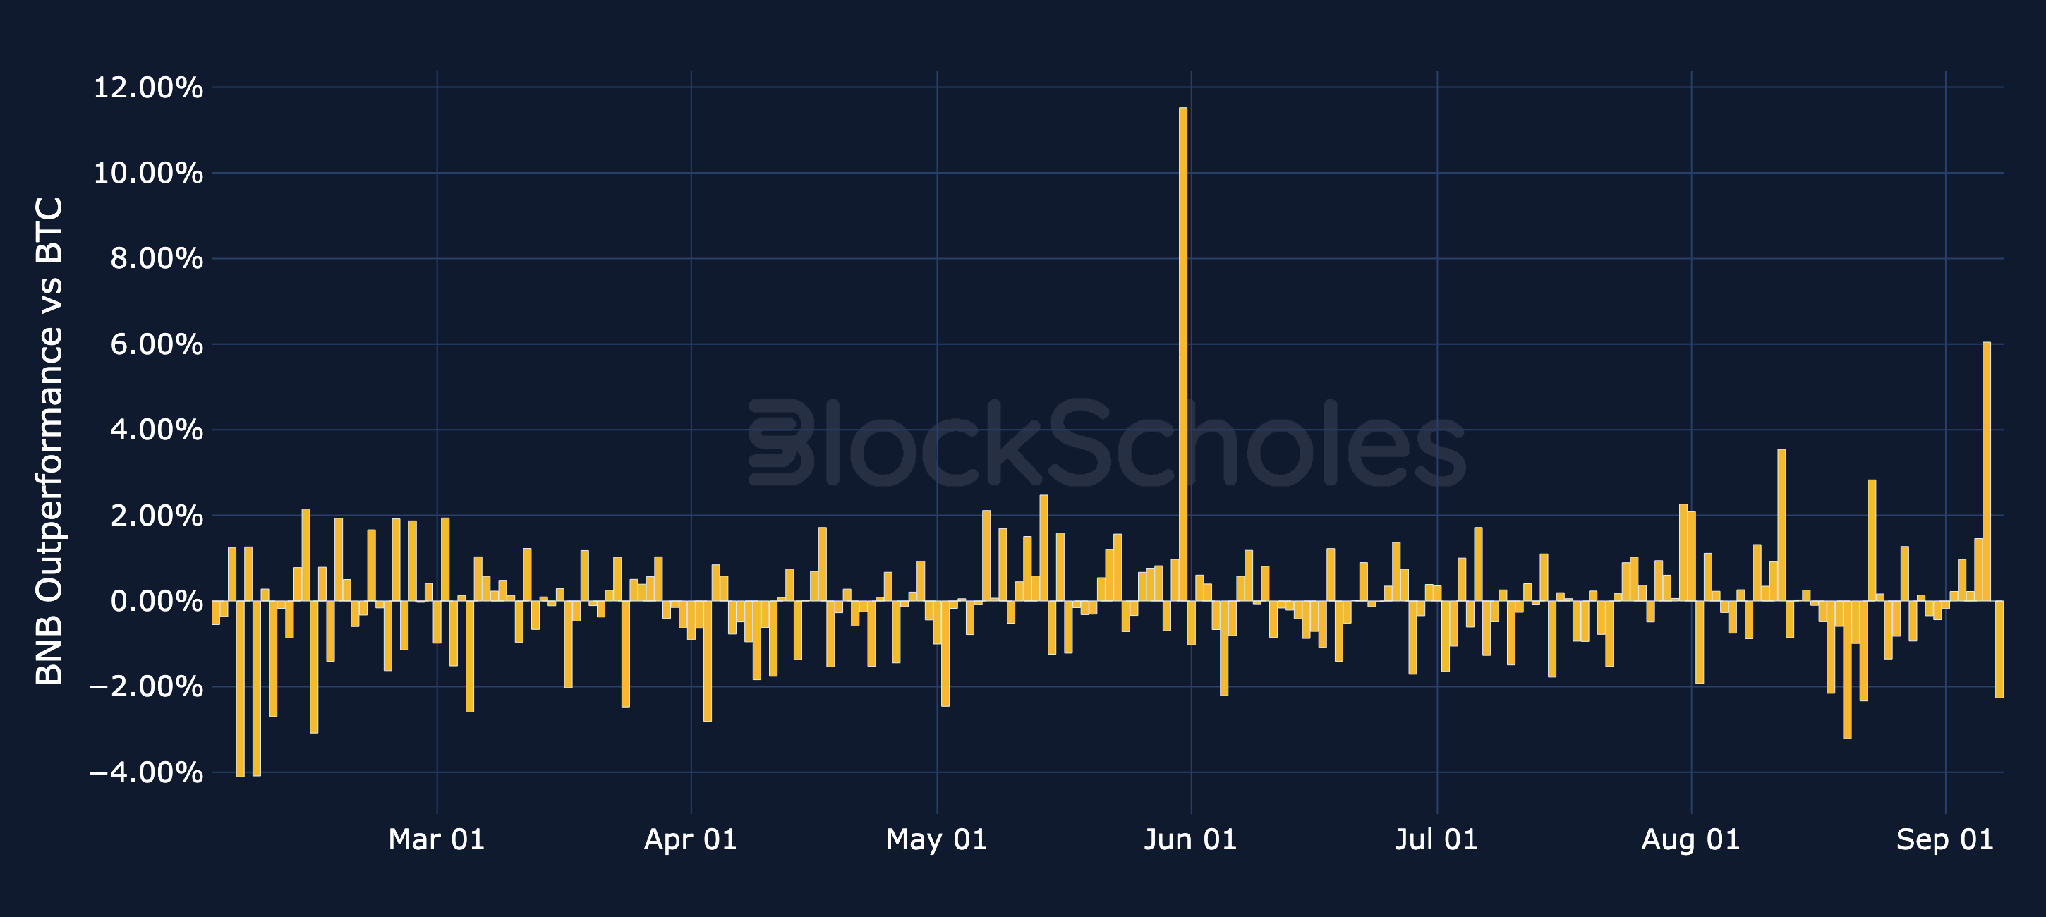
Daily relative simple returns vs BTC: BNB
ETF Flows: BTC, ETH & Altcoins
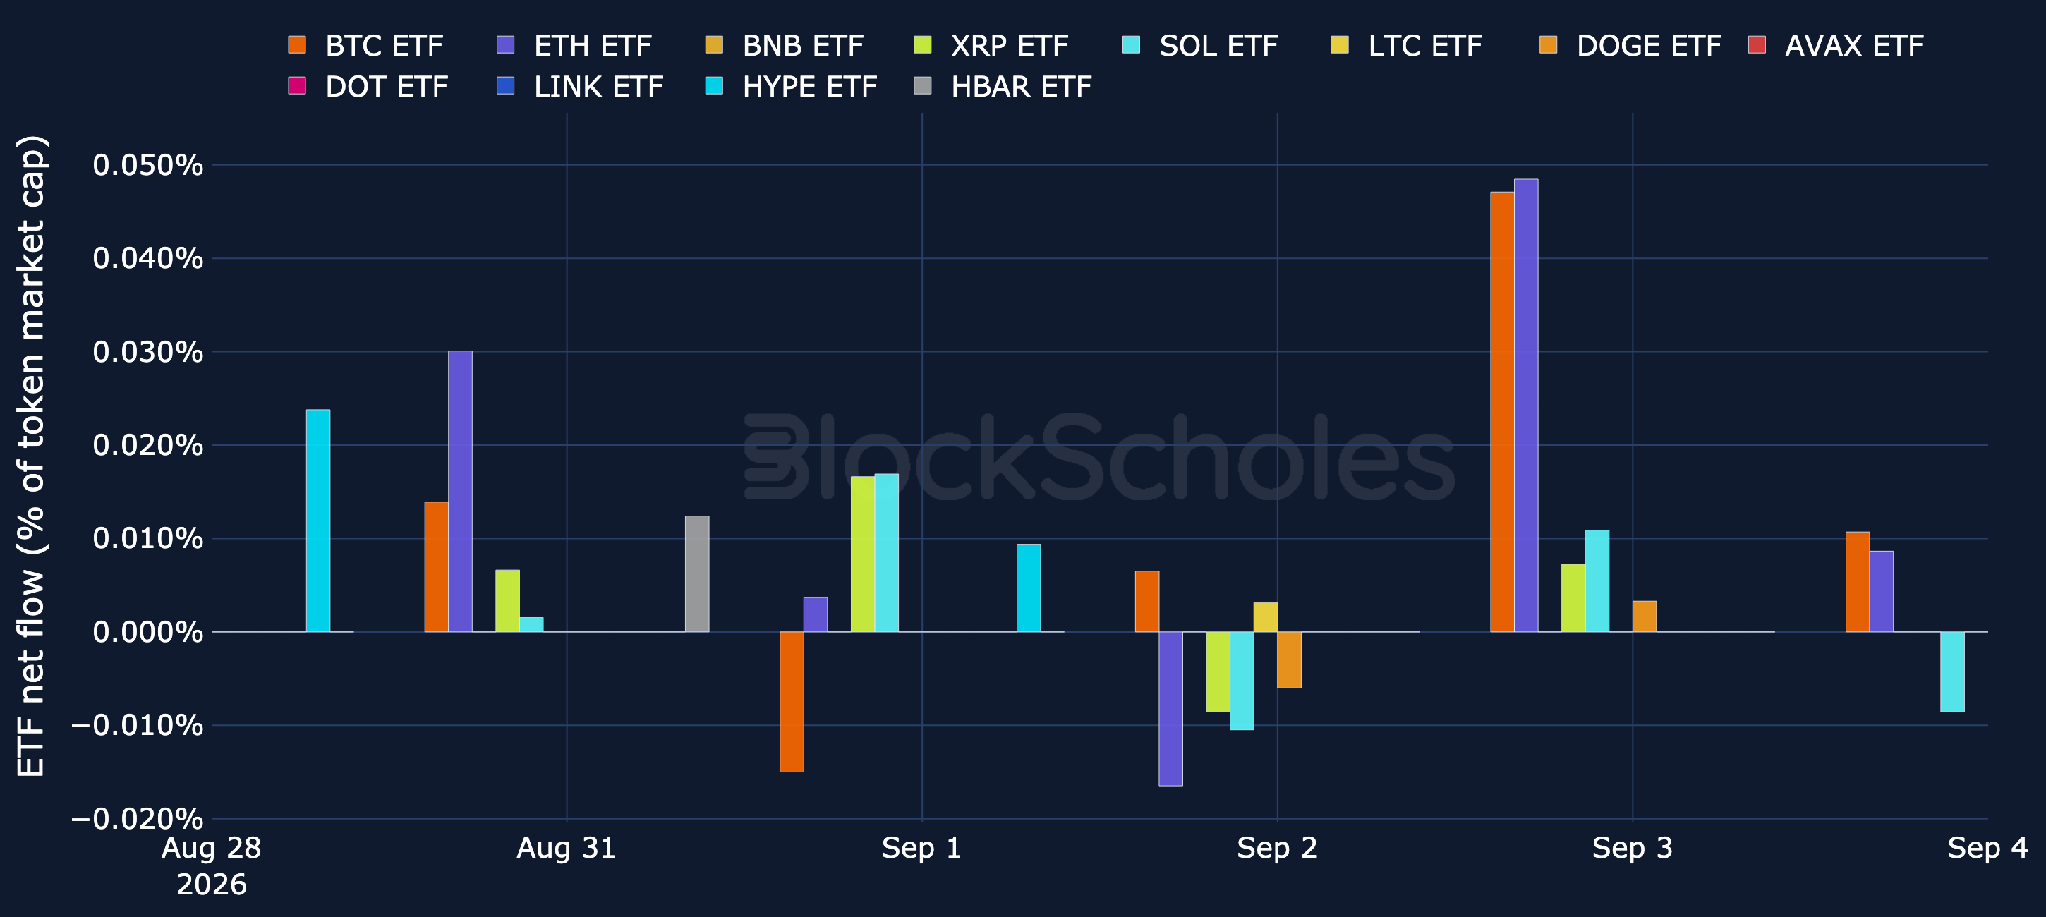
BTC ETFs' longer-run trend is still one of net outflows. In the 84 trading days since cumulative flows peaked on 6th May, spot BTC ETFs have posted net inflows on just 37 of them, shedding a cumulative $4.15B. The past week (31st August–4th September) cut against that trend, however, adding $987M of inflows. ETH products saw net inflows of $218M in the past week.
Over the past week, altcoin ETFs showed a more mixed picture. XRP led inflows at $19M, followed by HYPE at $12.3M, SOL at $6.18M, HBAR at $399K, and LTC at $121K. DOGE recorded a net $344K outflow. XRP, despite leading inflows, still saw 1 net-outflow session during the week.
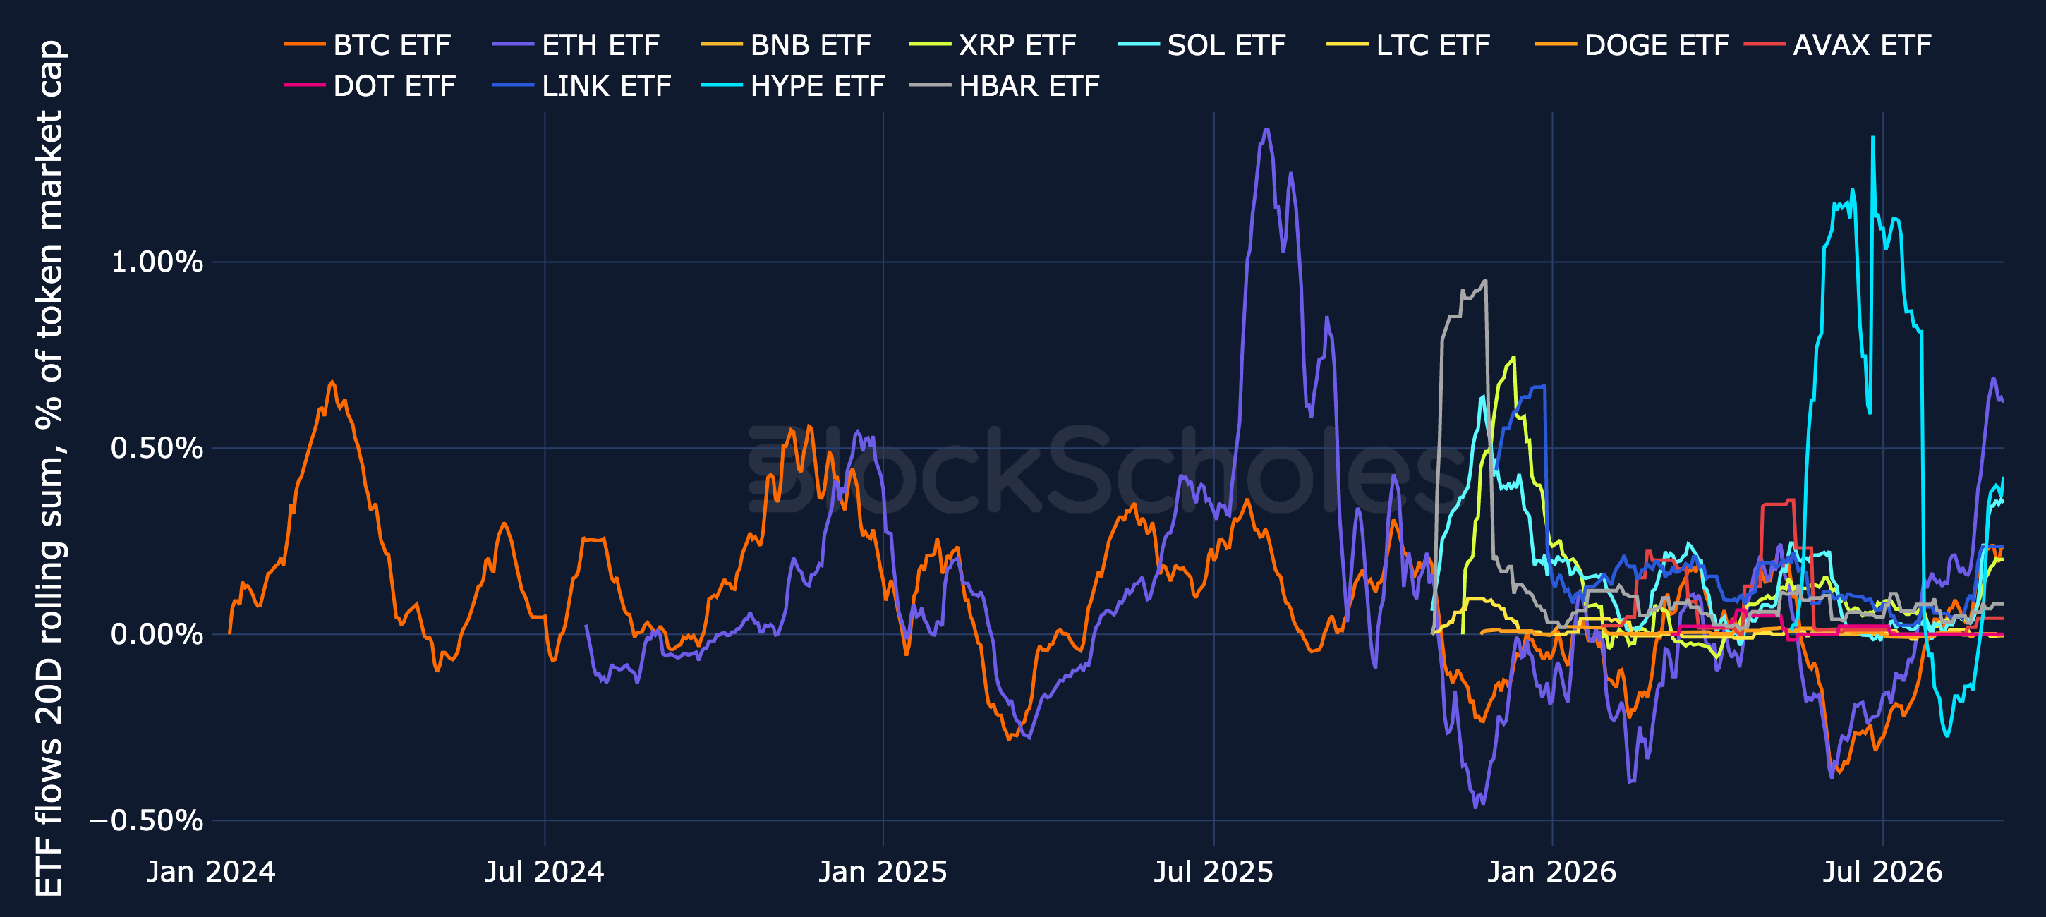
Adjusted for market cap, HYPE has the largest 20-day rolling net ETF inflow among altcoin ETFs, at around 0.42% of token market cap (as of 4th September). ETH's rolling net inflow is larger still, at around 0.62% of its market cap.
ETF net flows: BTC, ETH & Altcoins (20-day rolling, % of market cap)
ETF net flows: BTC, ETH & Altcoins (latest week, % of market cap)
Altcoin Season Gauge (slow-moving by construction, 90-day lookback): % of top-50 altcoins outperforming BTC over the trailing 90 days (current constituents)
Drawdown from all-time high: BTC + top-20 altcoins by market cap
Altcoins / BTC Spot Crosses
Altcoin spot prices denominated in BTC: ETH
Altcoin spot prices denominated in BTC: SOL
Altcoin spot prices denominated in BTC: XRP
Don't miss what's next
Upgrade your Block Scholes account to unlock this article and other exclusive insights
Altcoin Season Gauge (slow-moving by construction, 90-day lookback): % of top-50 altcoins outperforming BTC over the trailing 90 days (current constituents)
Drawdown from all-time high: BTC + top-20 altcoins by market cap
Altcoins / BTC Spot Crosses
Altcoin spot prices denominated in BTC: ETH
Altcoin spot prices denominated in BTC: SOL
Altcoin spot prices denominated in BTC: XRP
Don't miss what's next
Upgrade your Block Scholes account to unlock this article and other exclusive insights
Premium
$30/mo
Access previous and future reports, market insights & deep dives.
Oil prices jumped overnight after a Houthi drone attack on Saudi Arabia's Shaybah oilfield, sending Brent crude 2.6% higher to $111.64, while France's 10-year yield closed above 5% for the first time in more than 24 years. BTC broke above its two-week $80K-$84K range to peak at $84.8K on Wednesday, but has since given back the entire move as US equity futures and Asian chip stocks sold off. The OCC became the first agency to finalise rules implementing the GENIUS Act, removing proposed restrictions on third-party stablecoin rewards.
The US equity rebound broadened beyond tech as the Russell 2000 gained 1.65% and Treasury yields eased, while BTC rose 2.1% to $83.1K and ETH gained 2.9% to $2,451 overnight. BlackRock filed for a Bitcoin Managed Protection ETF, J.P. Morgan forecast 10% annual BTC returns over a decade, and FINMA approved Switzerland's first spot Bitcoin ETF.