Back to Research
Last Updated:  
August 3, 2026
6 Minutes

Altcoins Analytics 3rd August 2026

This week's edition of our Crypto Altcoins Analytics.

BTC & Altcoin Dominance

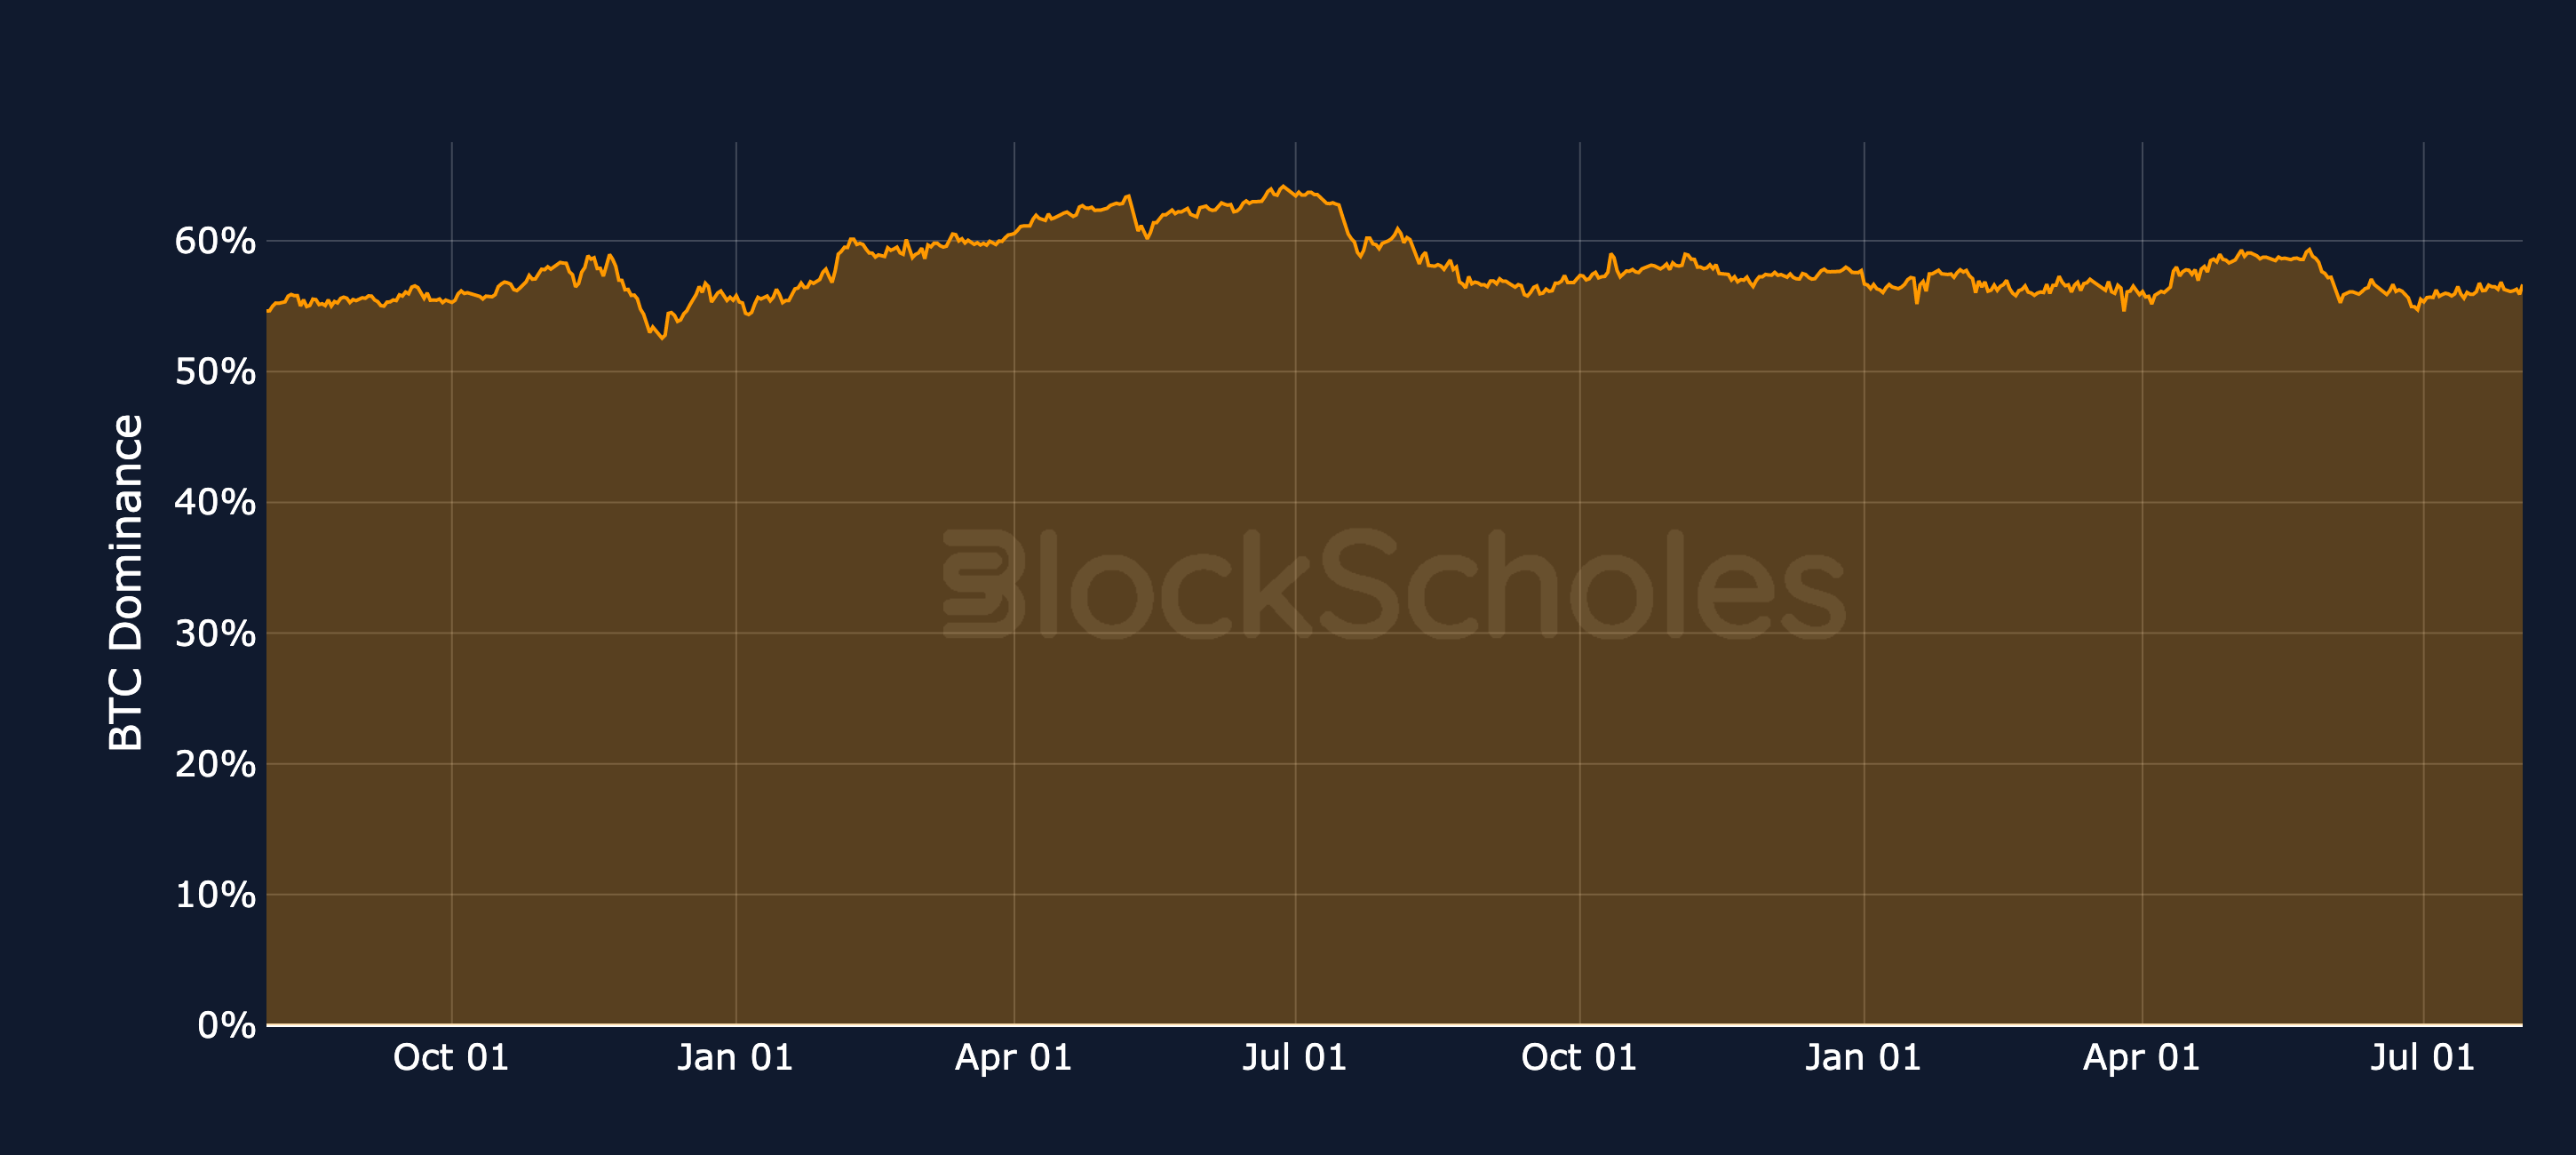
BTC Dominance

Altcoin Dominance

Altcoins / BTC Spot Crosses

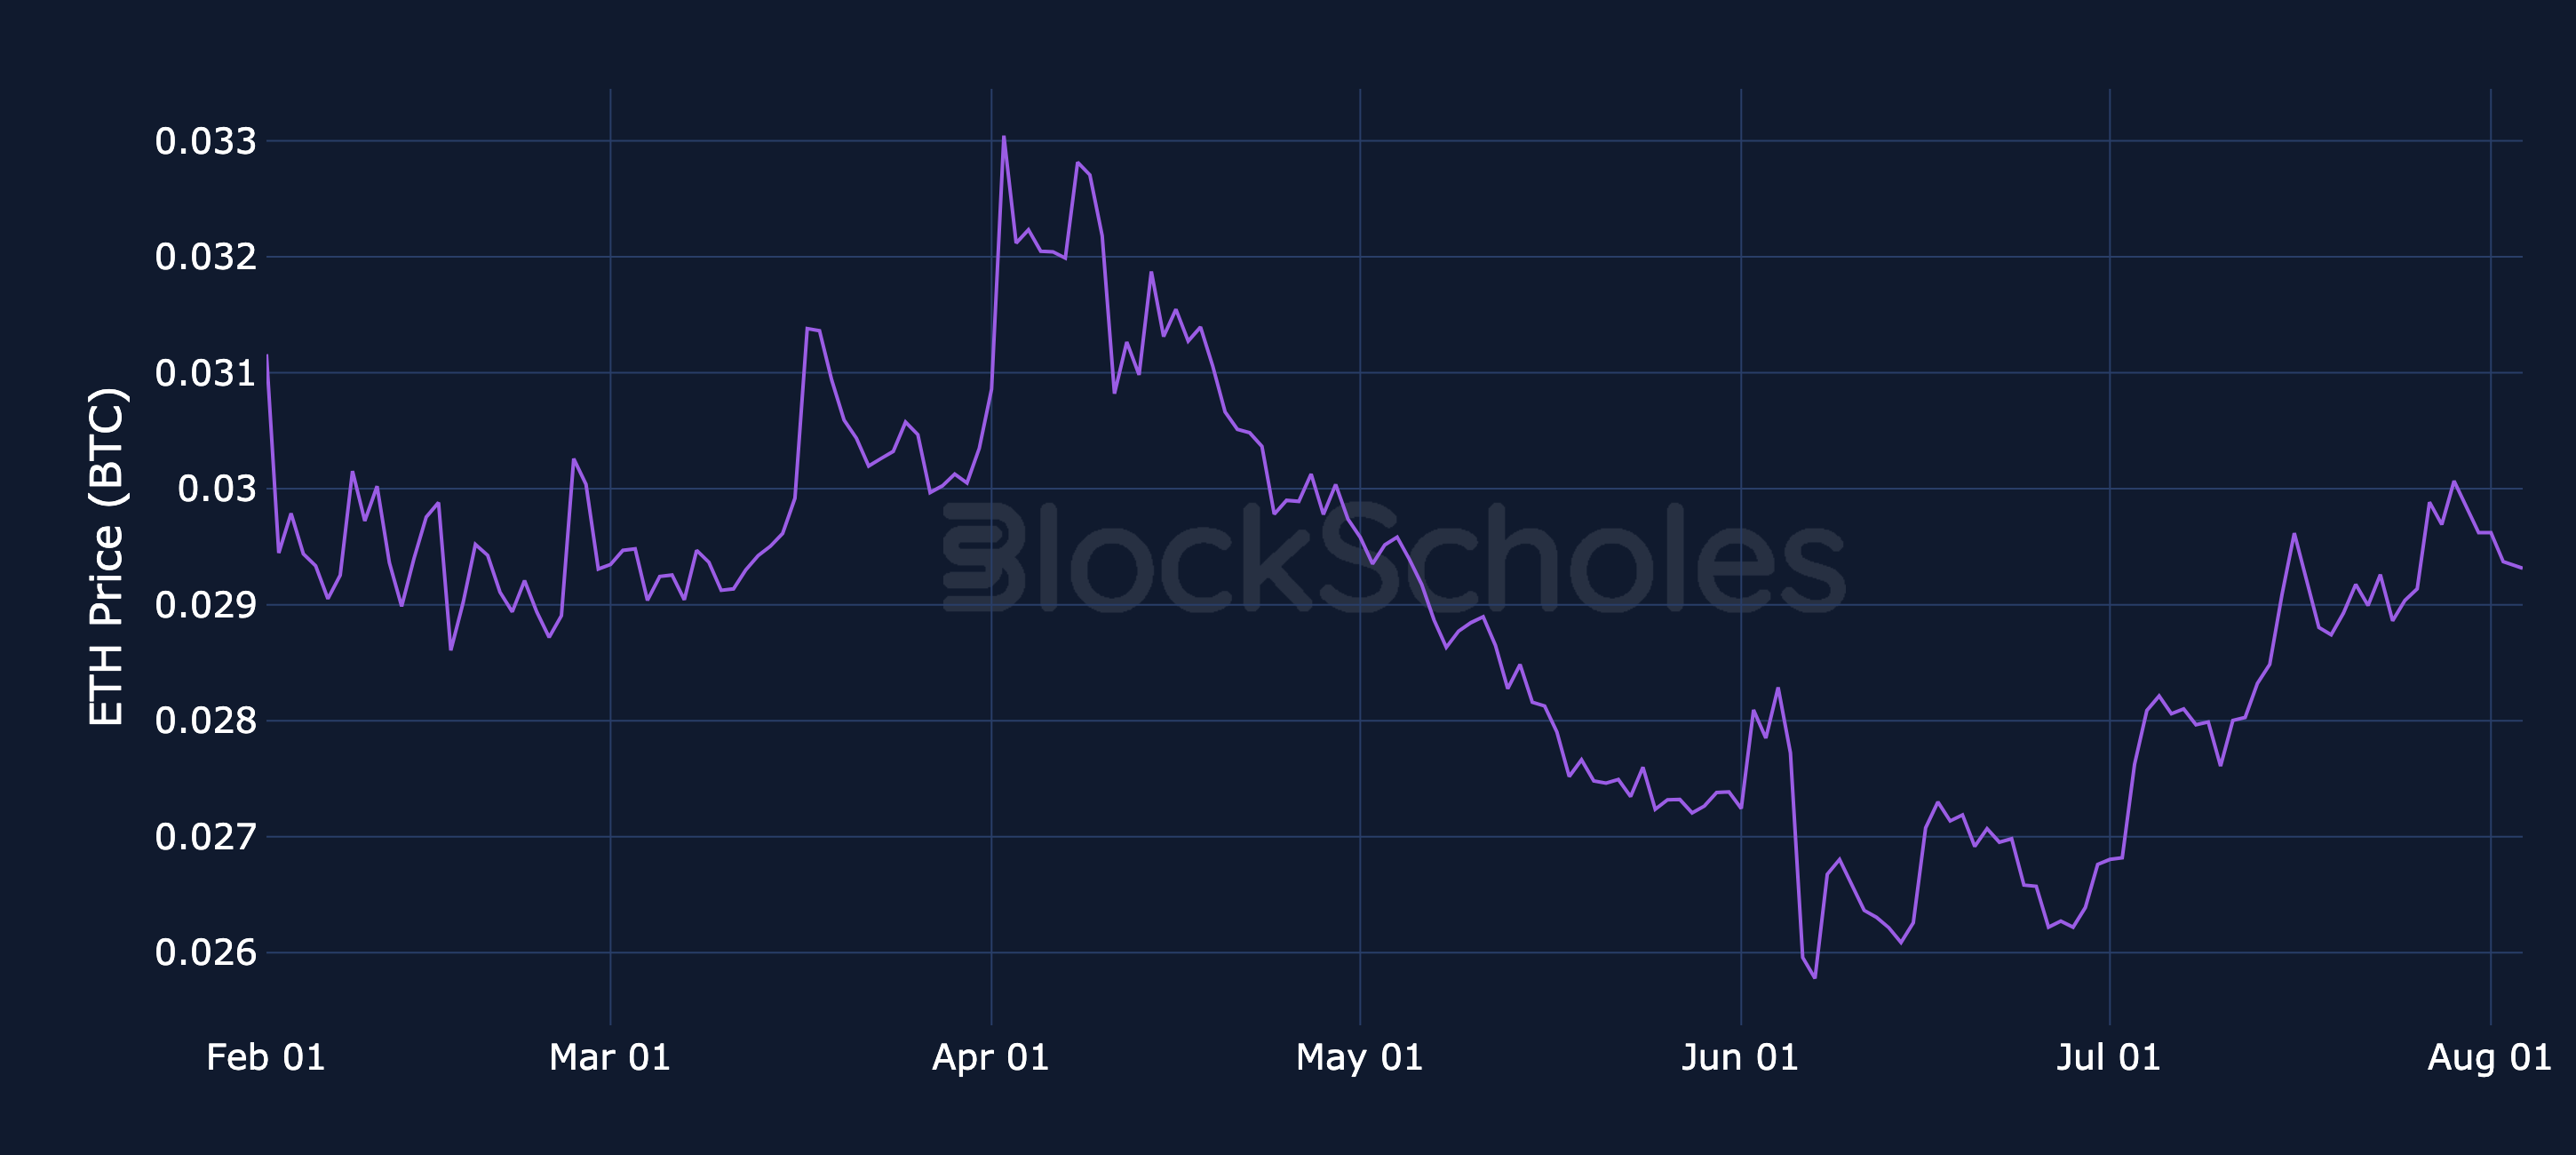
Altcoin spot prices denominated in BTC: ETH

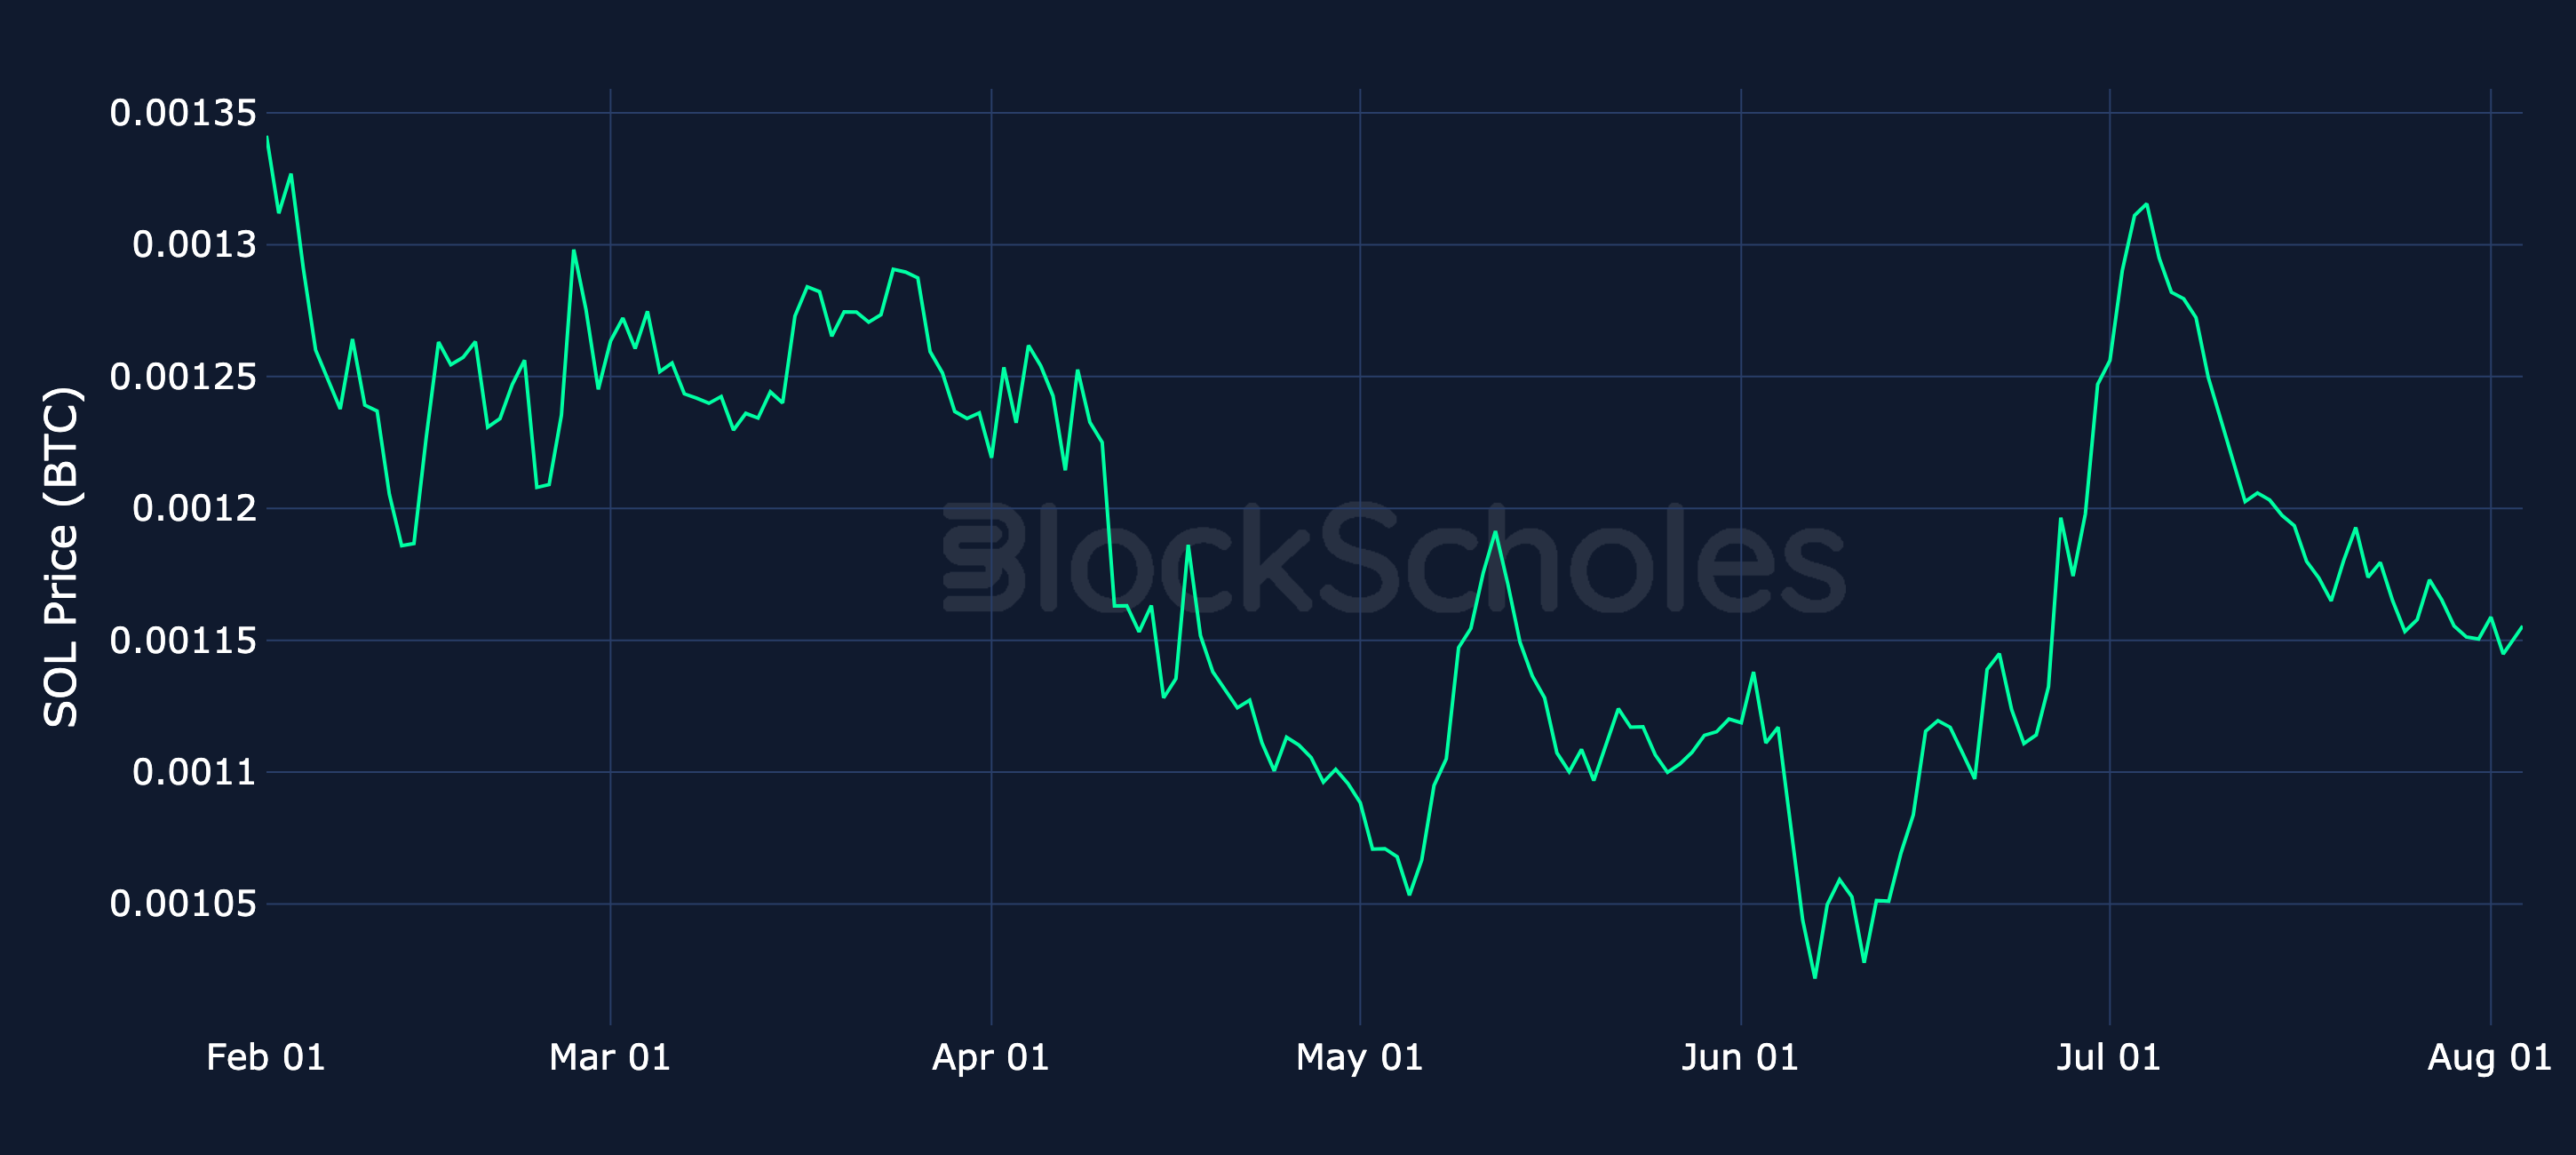
Altcoin spot prices denominated in BTC: SOL

Altcoin spot prices denominated in BTC: XRP

Altcoin spot prices denominated in BTC: BNB

Altcoins performance vs BTC

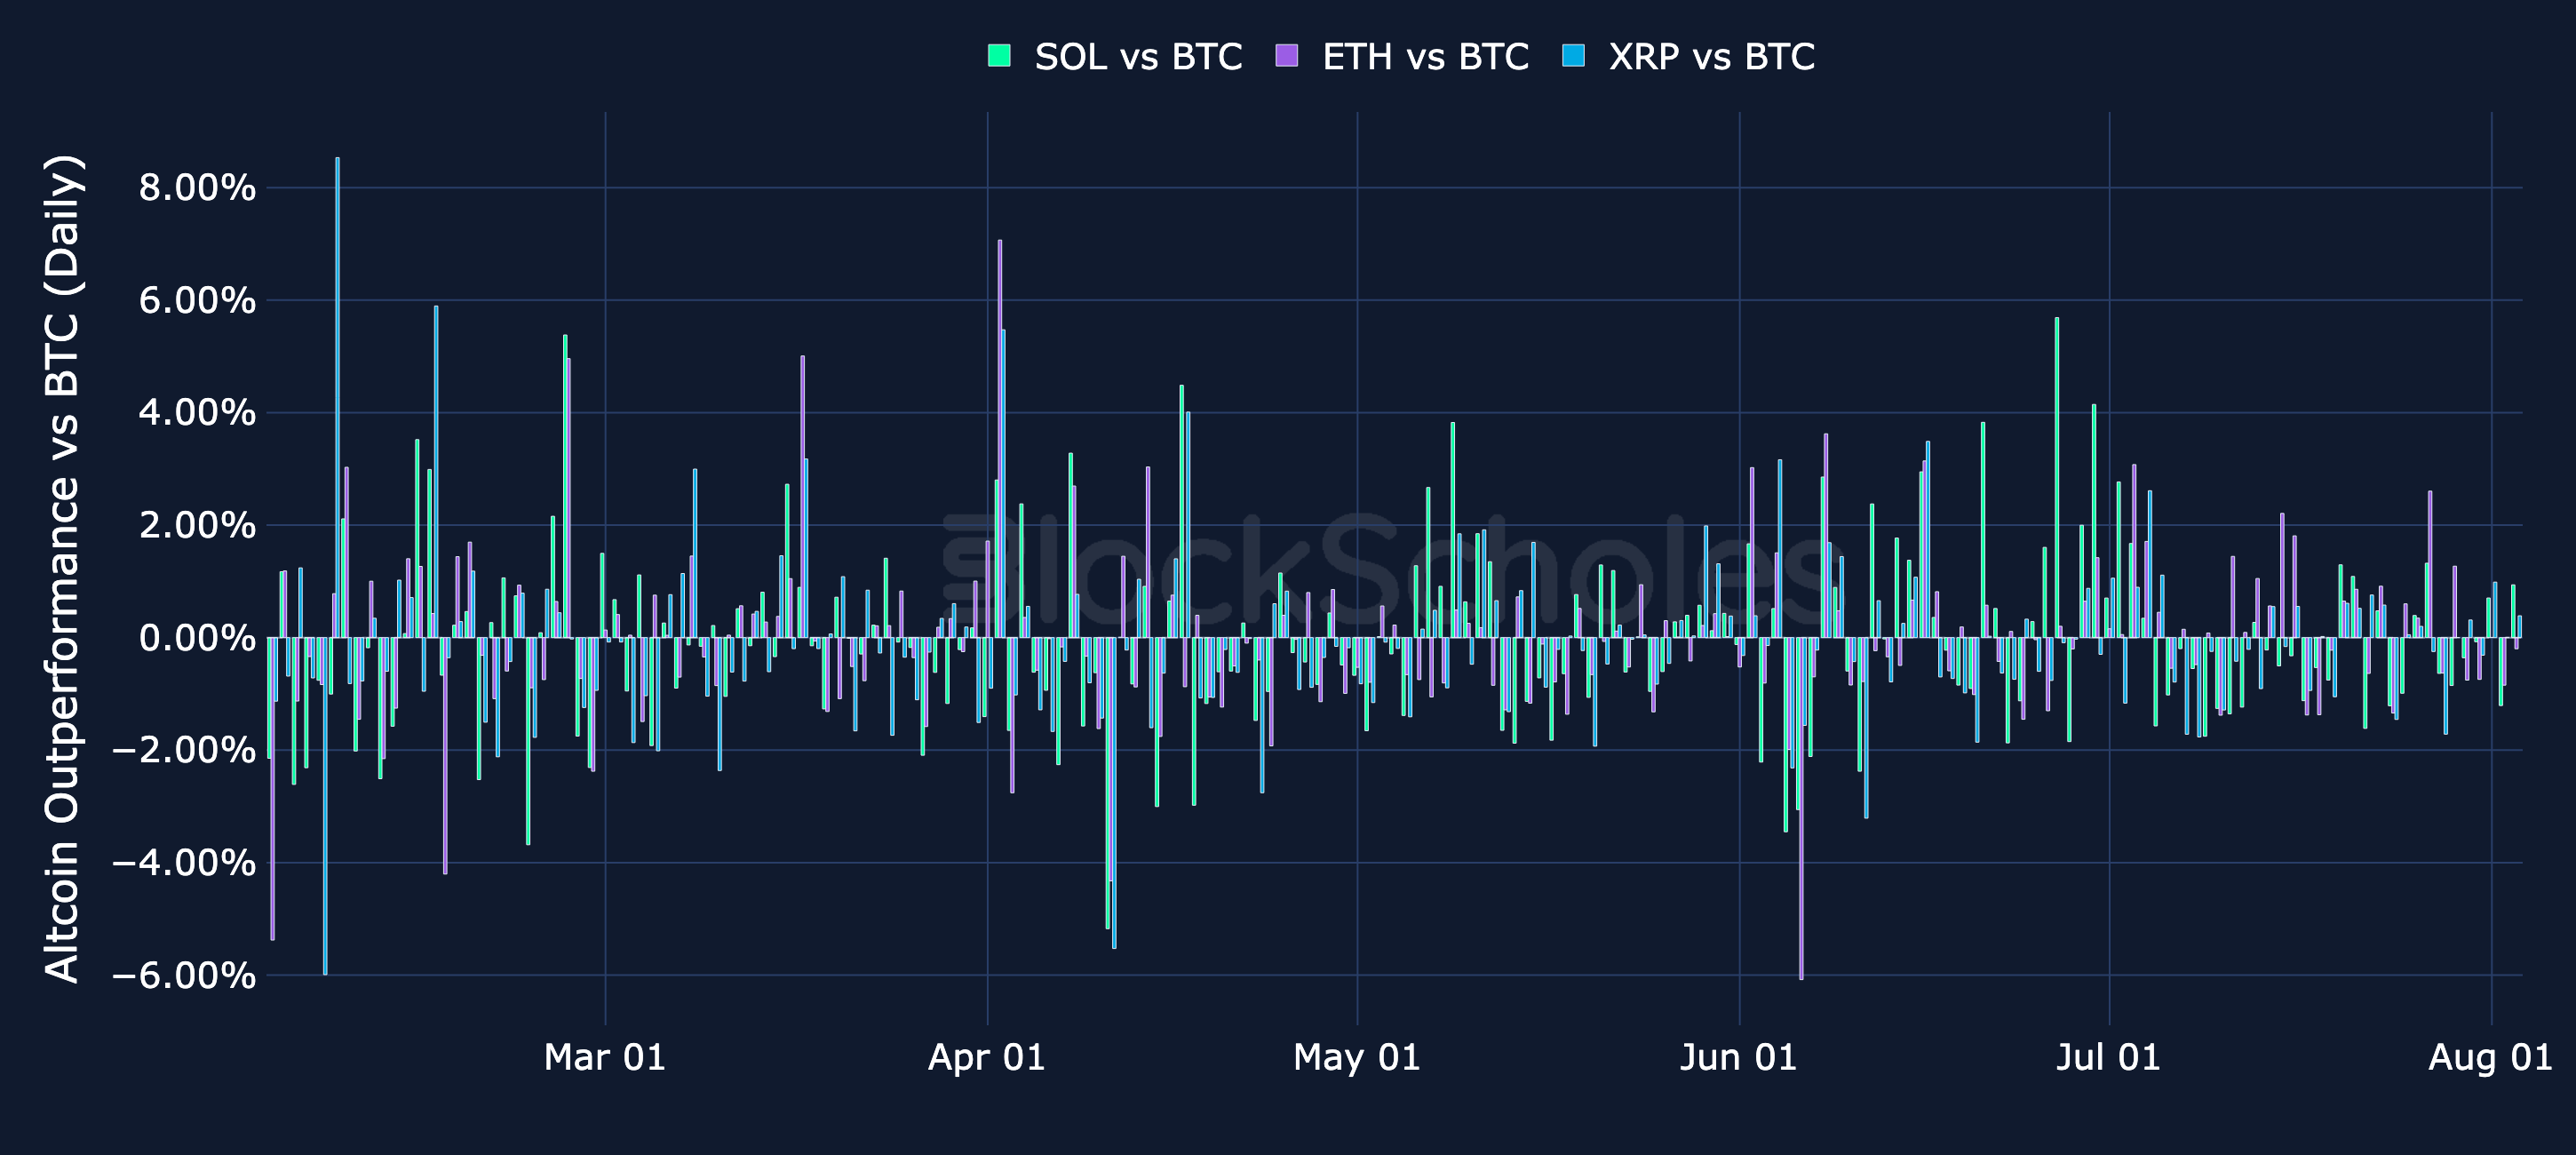
Daily relative simple returns vs BTC

Altcoin Performance vs BTC

Daily relative simple returns vs BTC: ETH

Daily relative simple returns vs BTC: SOL

Daily relative simple returns vs BTC: XRP

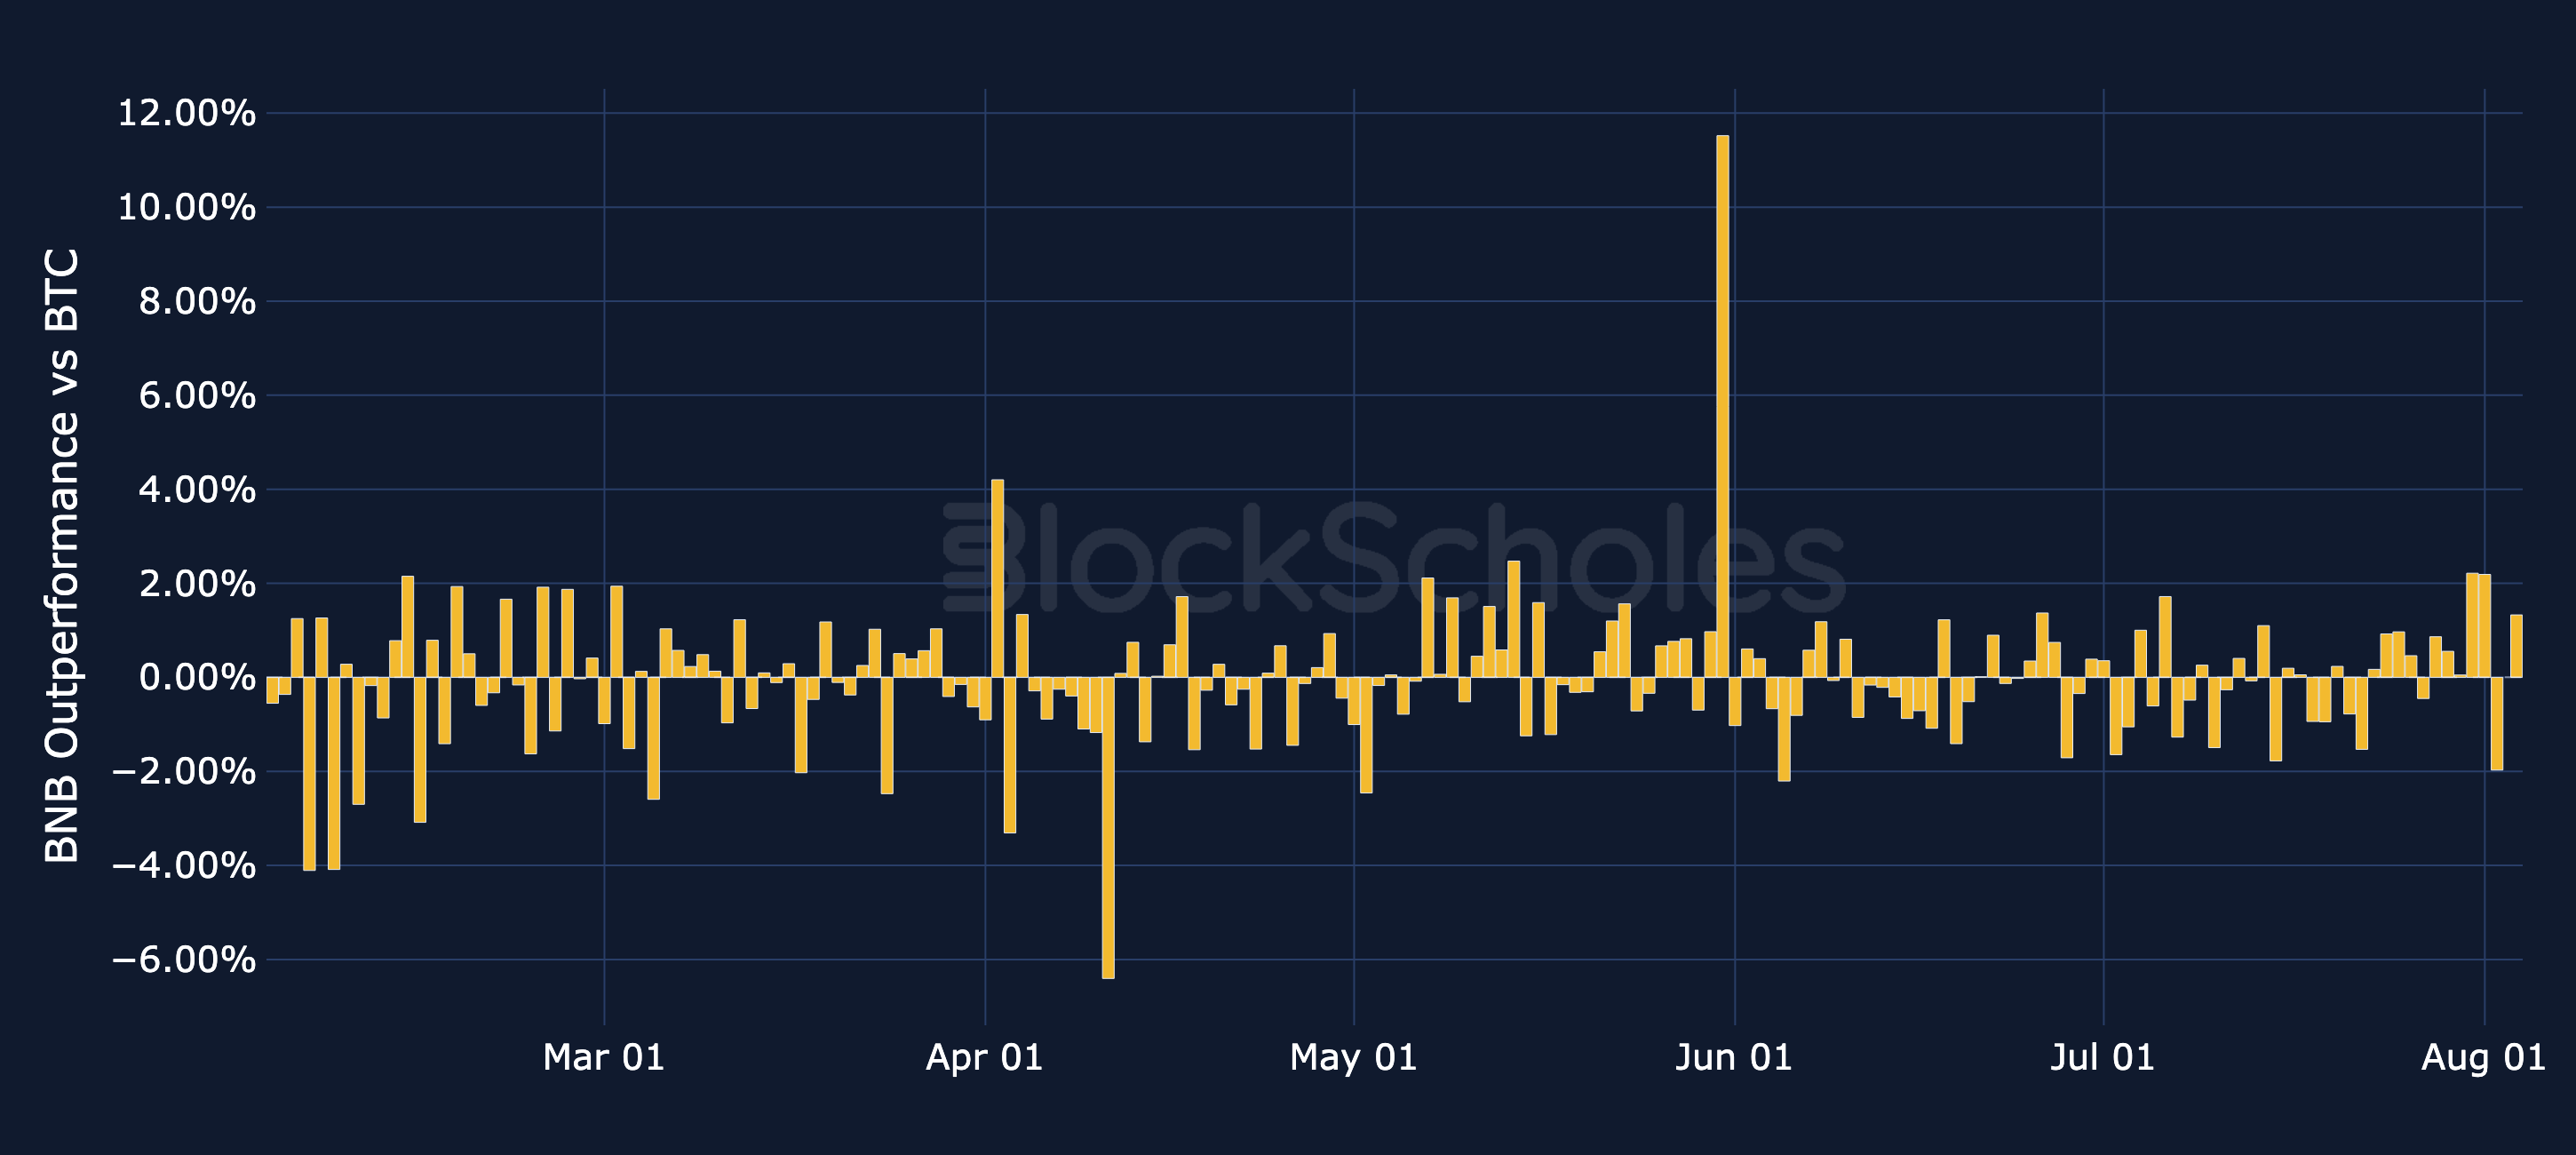
Daily relative simple returns vs BTC: BNB

ETF Flows: BTC, ETH & Altcoins

ETF Flows – BTC ETFs remain in a net-outflow regime. Their running total of net flows topped out in early May and has bled steadily since: over the 59 trading days from that high, spot BTC ETFs have added on just 18 of them, for a cumulative $8.44B of net redemptions. (This is the cumulative flow balance, not the 20-day rolling flow shown in the chart, which stays negative through the drawdown.) The past week (27th July–31st July) added $61.5M of outflows. ETH ETFs followed a similar path, shedding $976M over the same stretch, though flows turned positive in the past week with $27.4M of inflows.

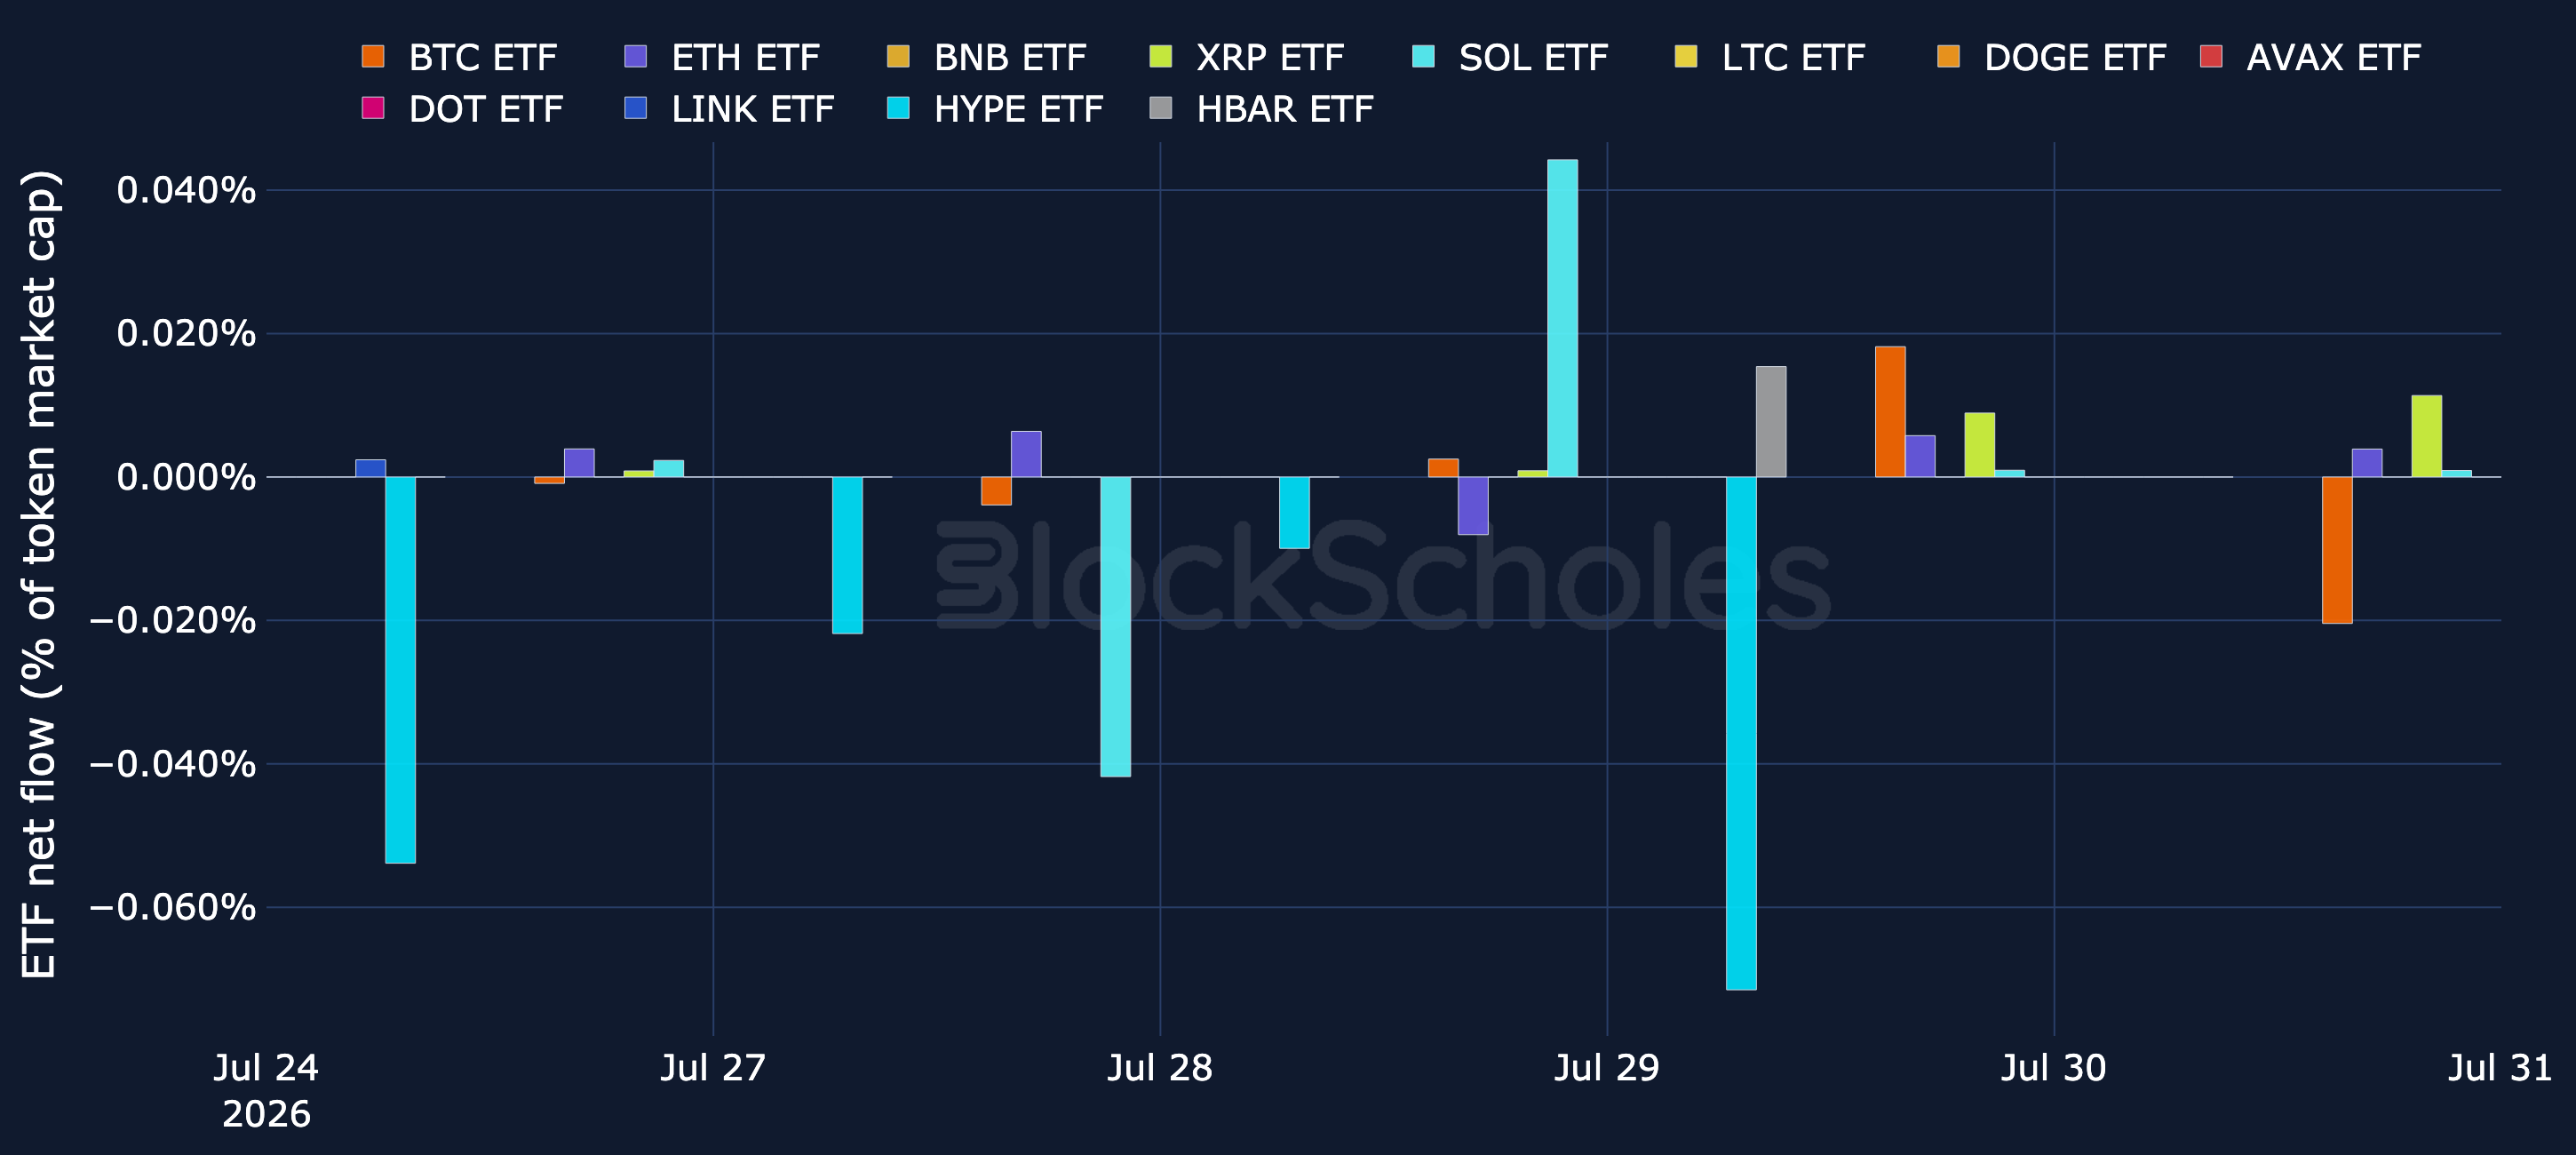
Over the past week, altcoin ETFs showed a more mixed picture. XRP led inflows at $14.9M, followed by SOL at $2.82M and HBAR at $461K. HYPE recorded a net $14.7M outflow. HYPE's outflow reflects a fading one-off: a single $108M net inflow on 25th June, which had lifted it to the top of the market-cap-adjusted table in prior weeks, has now rolled out of the 20-day window, leaving recent sessions in modest net redemptions. XRP's flows were entirely inflows rather than outflows over the week, with net inflows on 4 of 5 trading days and no net-outflow sessions.

Adjusted for market cap, HBAR has the largest 20-day rolling ETF flow, at around 0.06% of token market cap (as of 31st July).

ETF net flows: BTC, ETH & Altcoins (20-day rolling, % of market cap)

ETF net flows: BTC, ETH & Altcoins (latest week, % of market cap)

Regression-Based Valuation vs BTC

ETH Spot vs BTC Spot regression

SOL Spot vs BTC Spot regression

XRP Spot vs BTC Spot regression

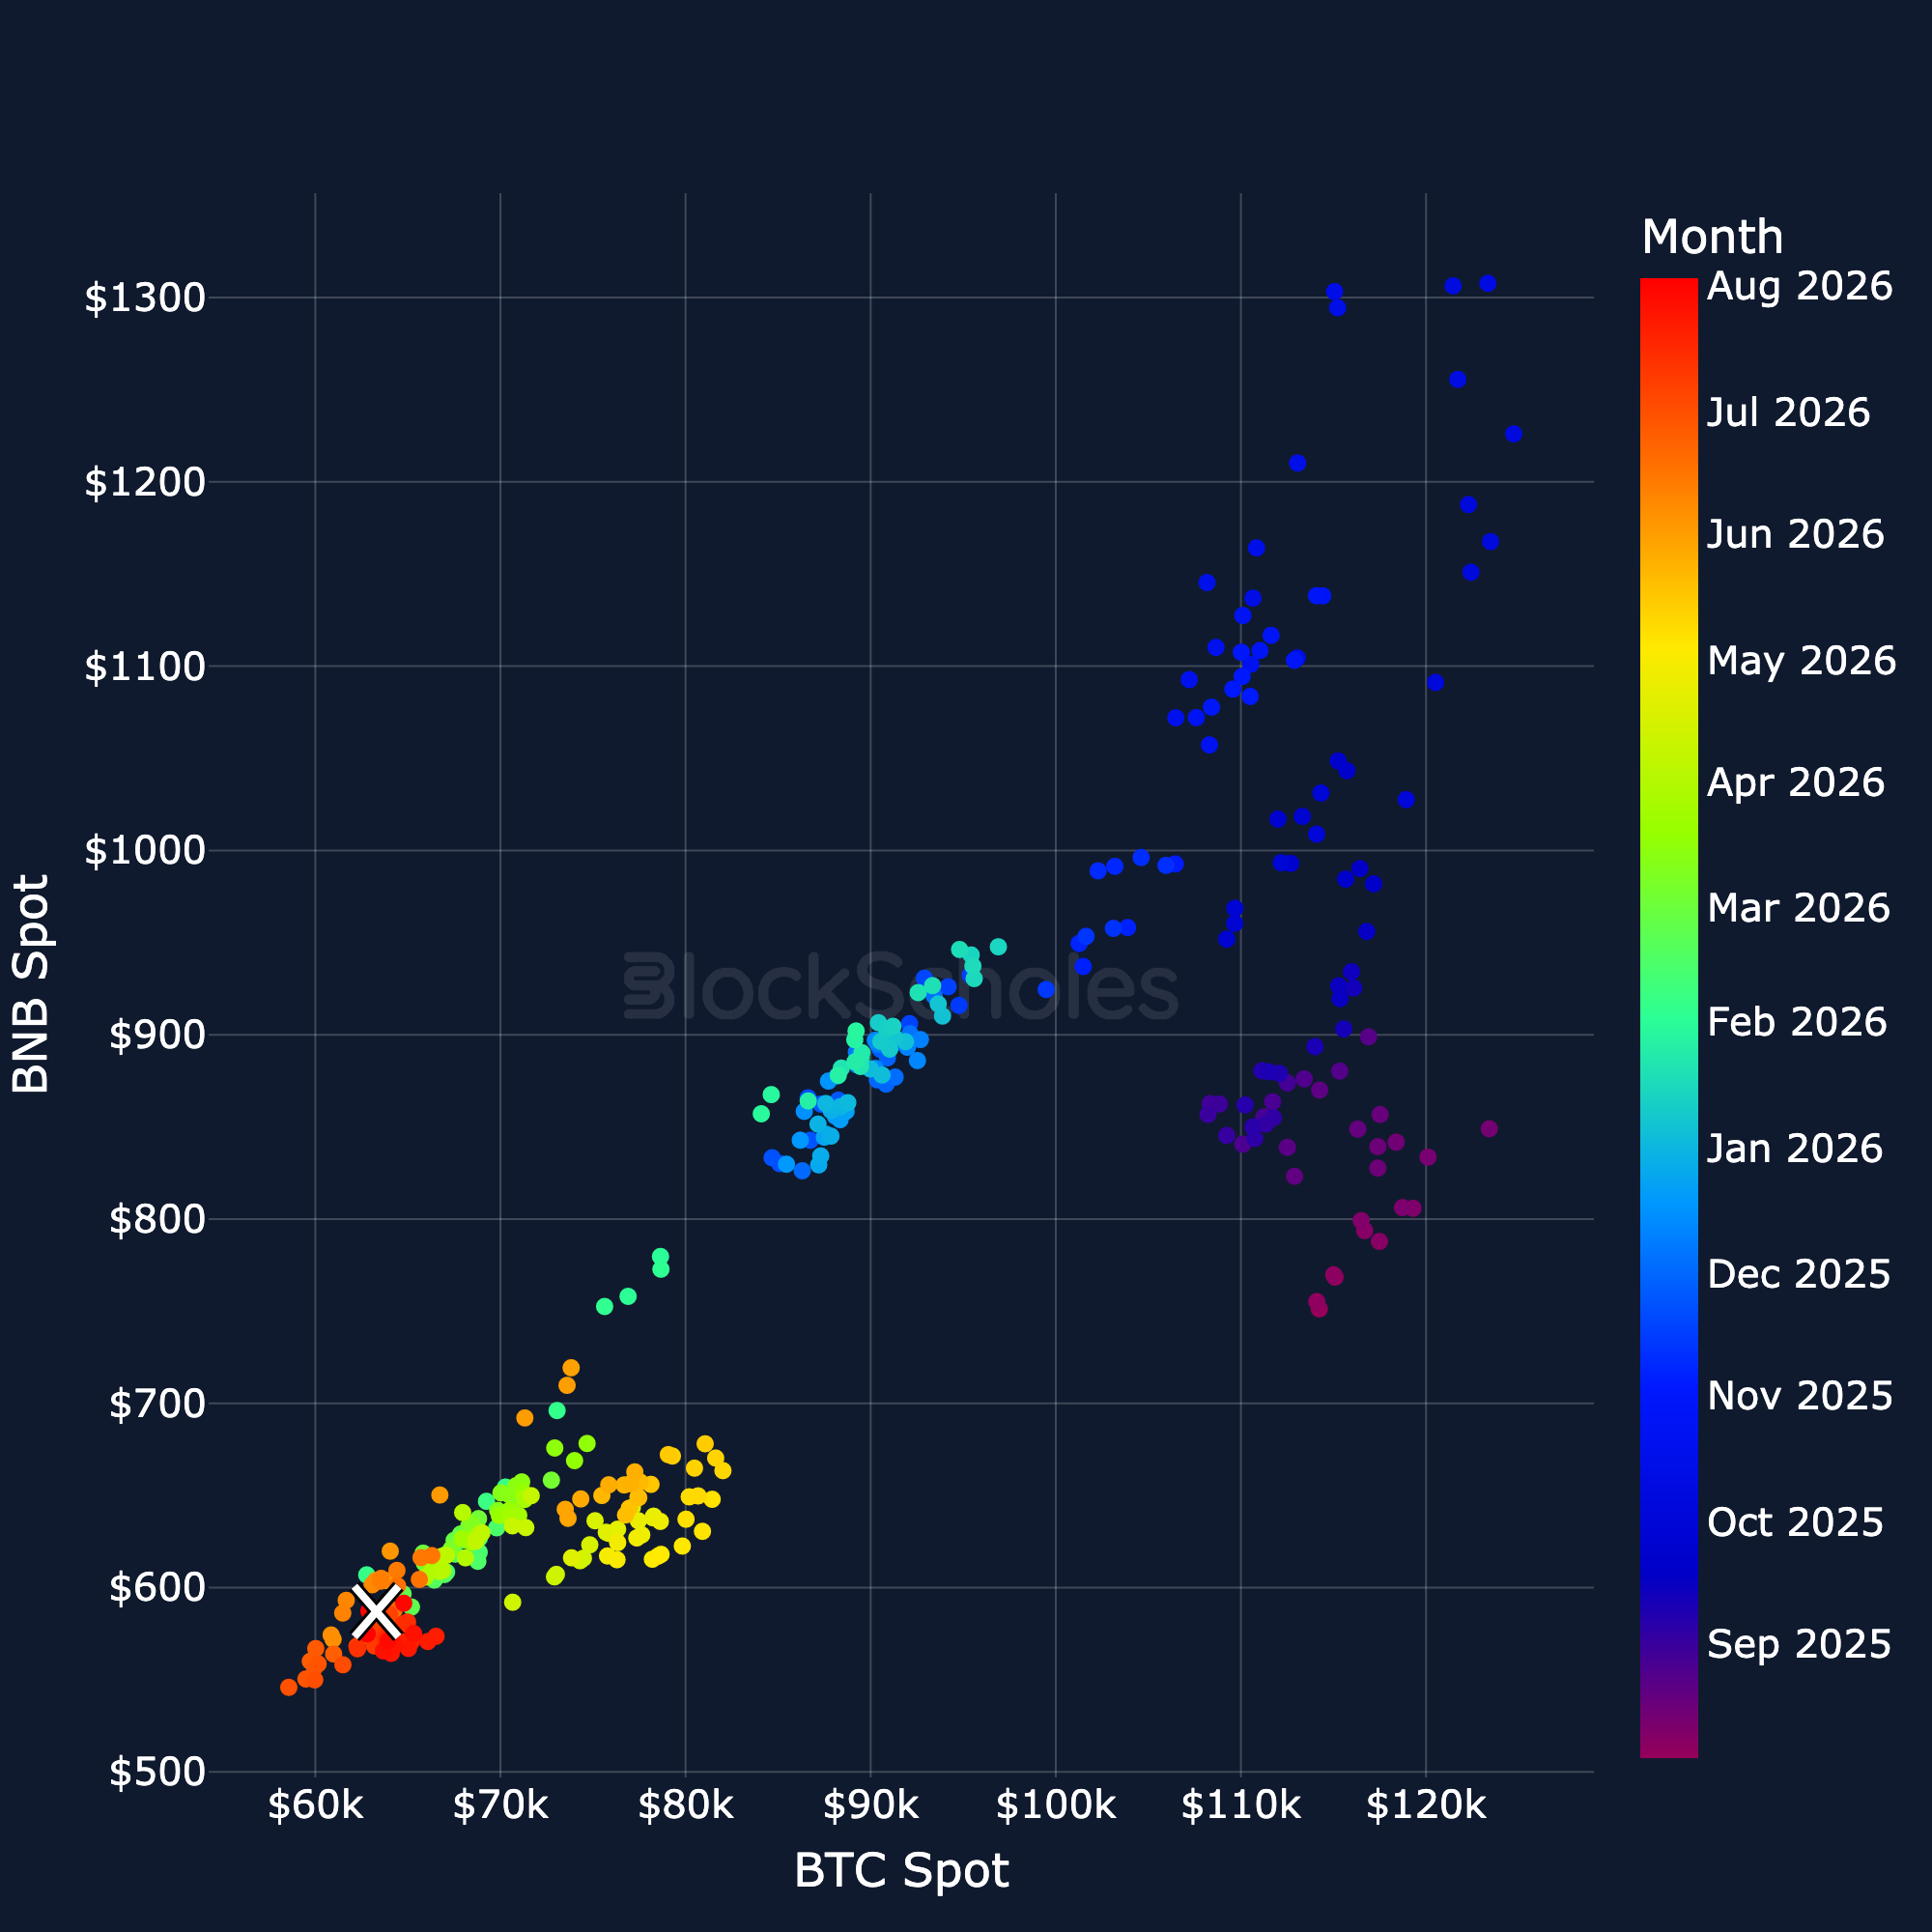
BNB Spot vs BTC Spot regression

Share this post
Copy URL
https://www.blockscholes.com/premium-research/altcoins-analytics-3rd-august-2026

BTC & Altcoin Dominance

BTC Dominance

Altcoin Dominance

Altcoins / BTC Spot Crosses

Altcoin spot prices denominated in BTC: ETH

Altcoin spot prices denominated in BTC: SOL

Altcoin spot prices denominated in BTC: XRP

BTC & Altcoin Dominance

BTC Dominance

Altcoin Dominance

Altcoins / BTC Spot Crosses

Altcoin spot prices denominated in BTC: ETH

Altcoin spot prices denominated in BTC: SOL

Altcoin spot prices denominated in BTC: XRP