Back to Research
Last Updated:  
August 24, 2026
6 Minutes

Altcoins Analytics 24th August 2026

This week's edition of our Crypto Altcoins Analytics.

BTC & Altcoin Dominance

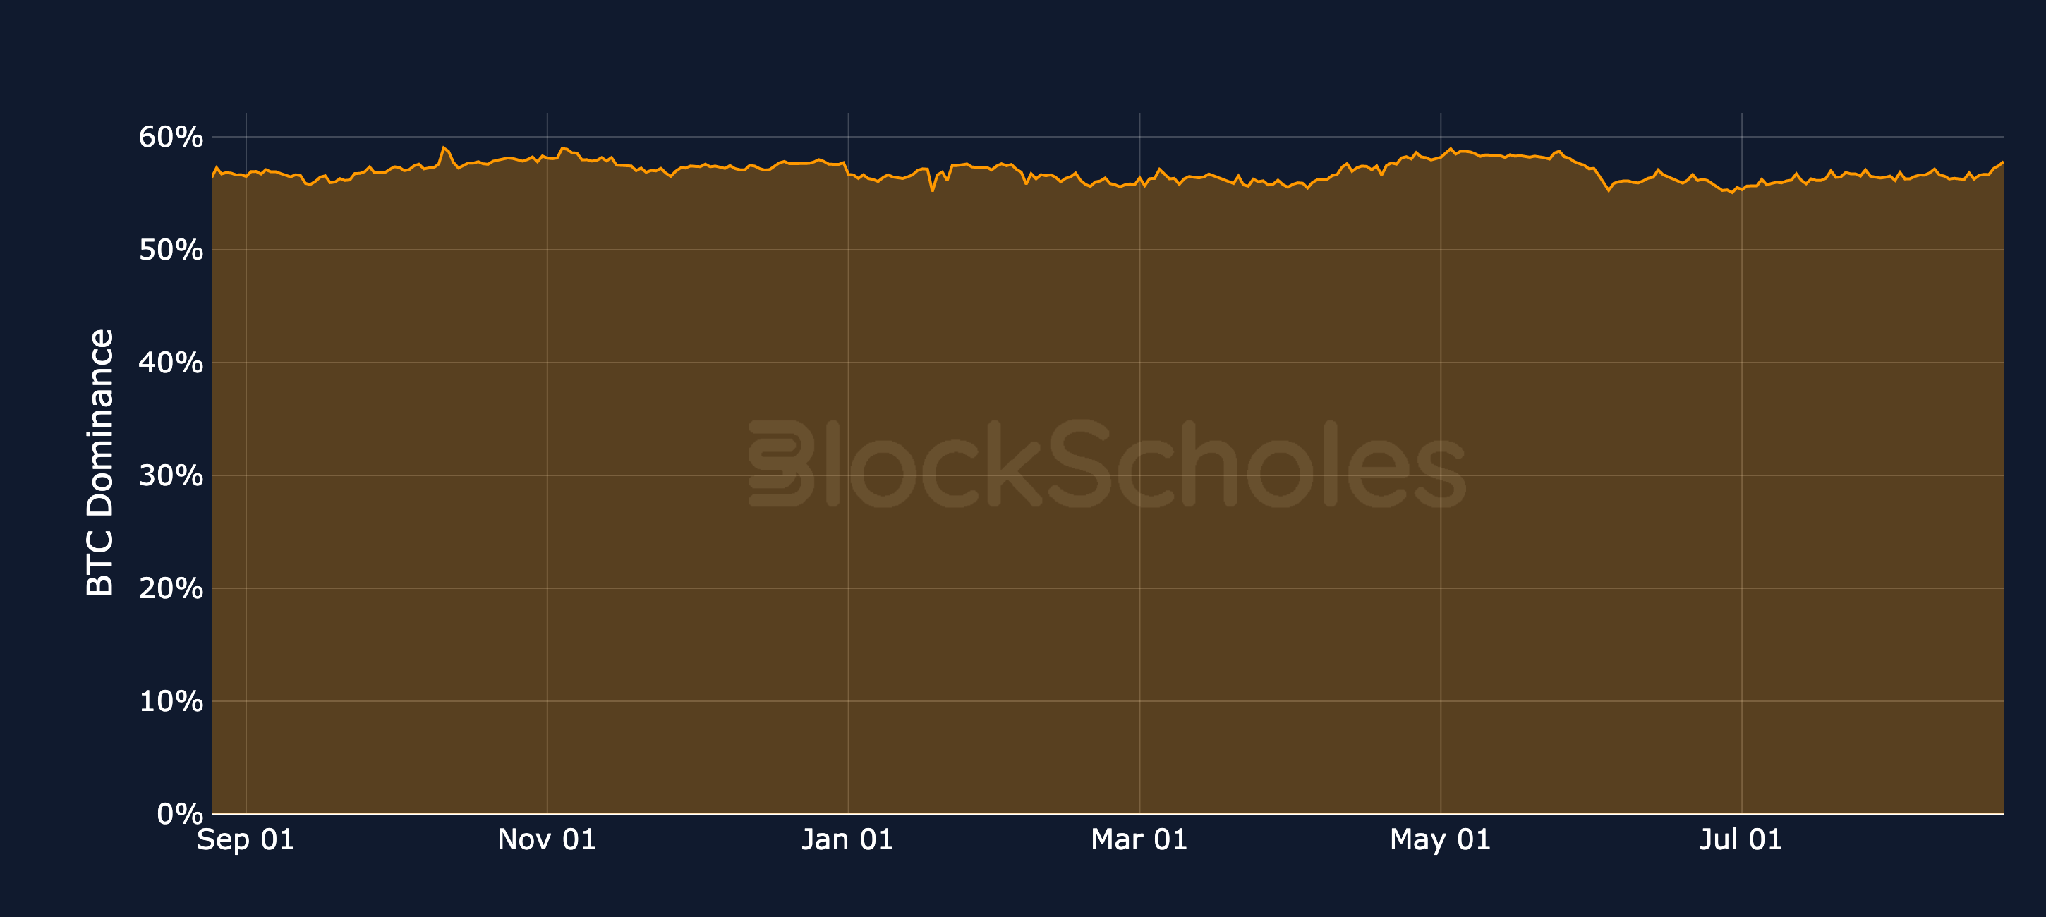
BTC Dominance

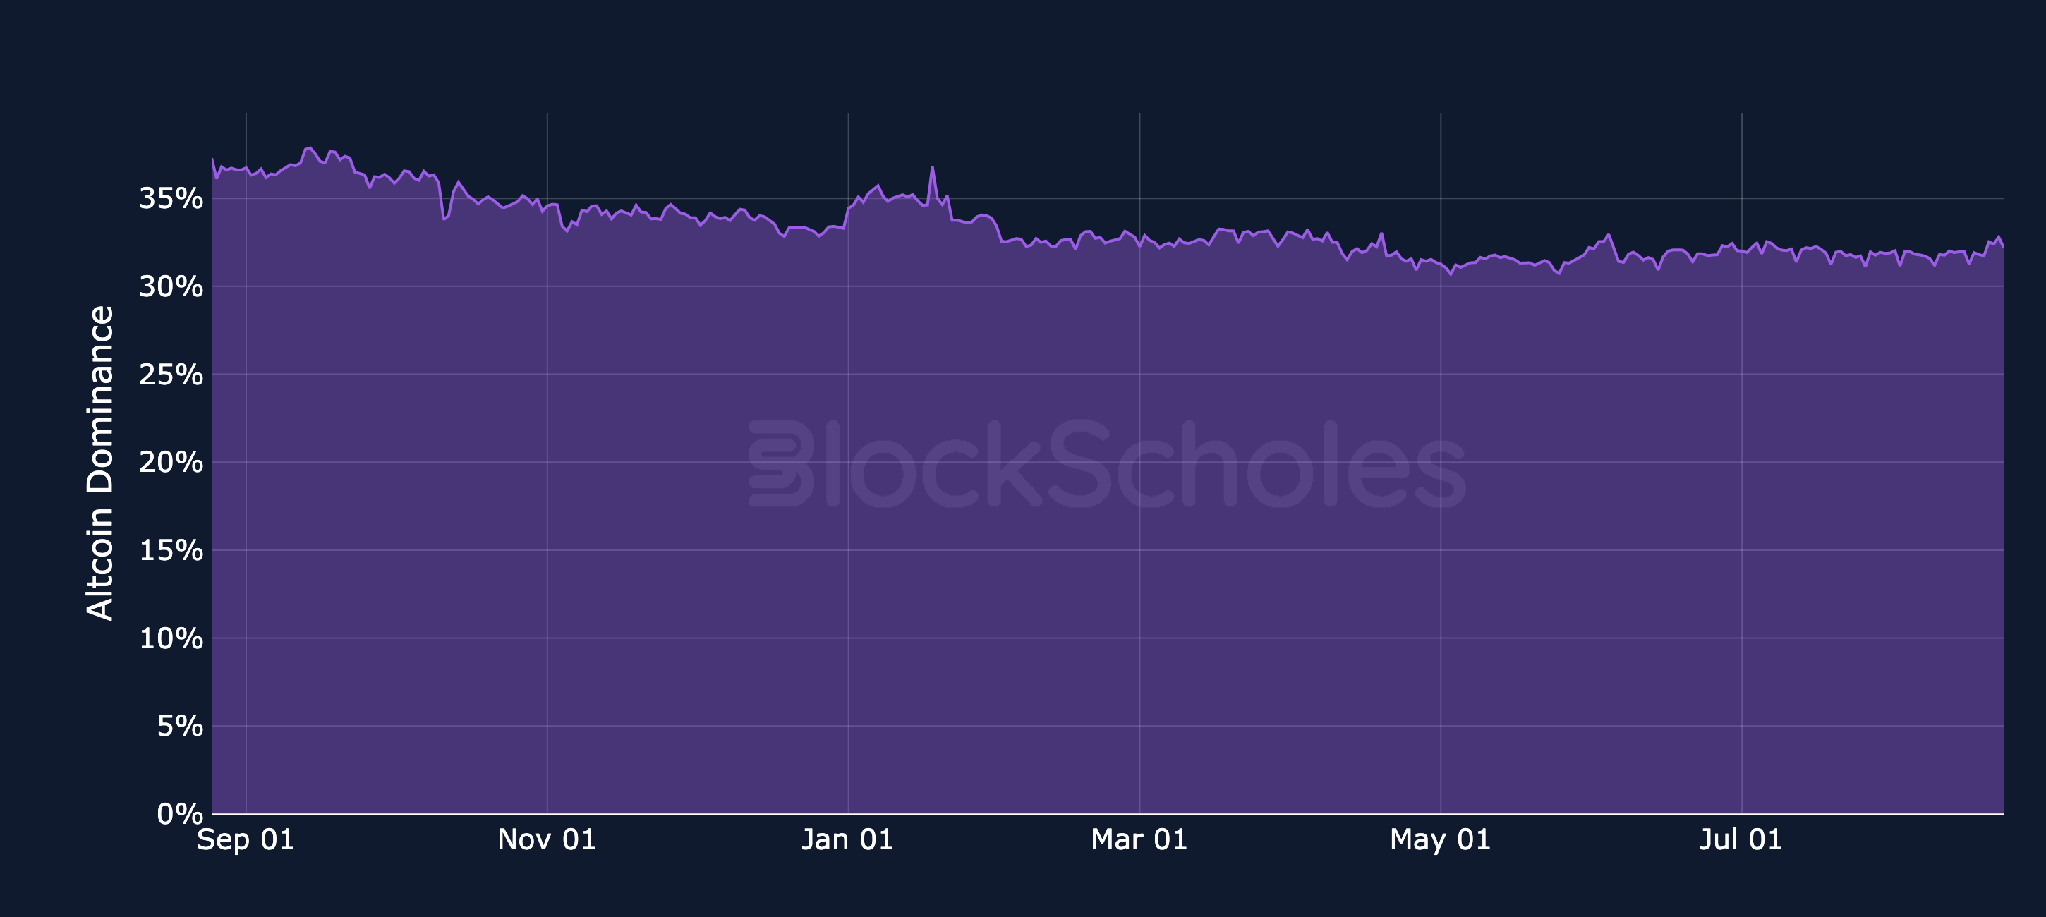
Altcoin Dominance

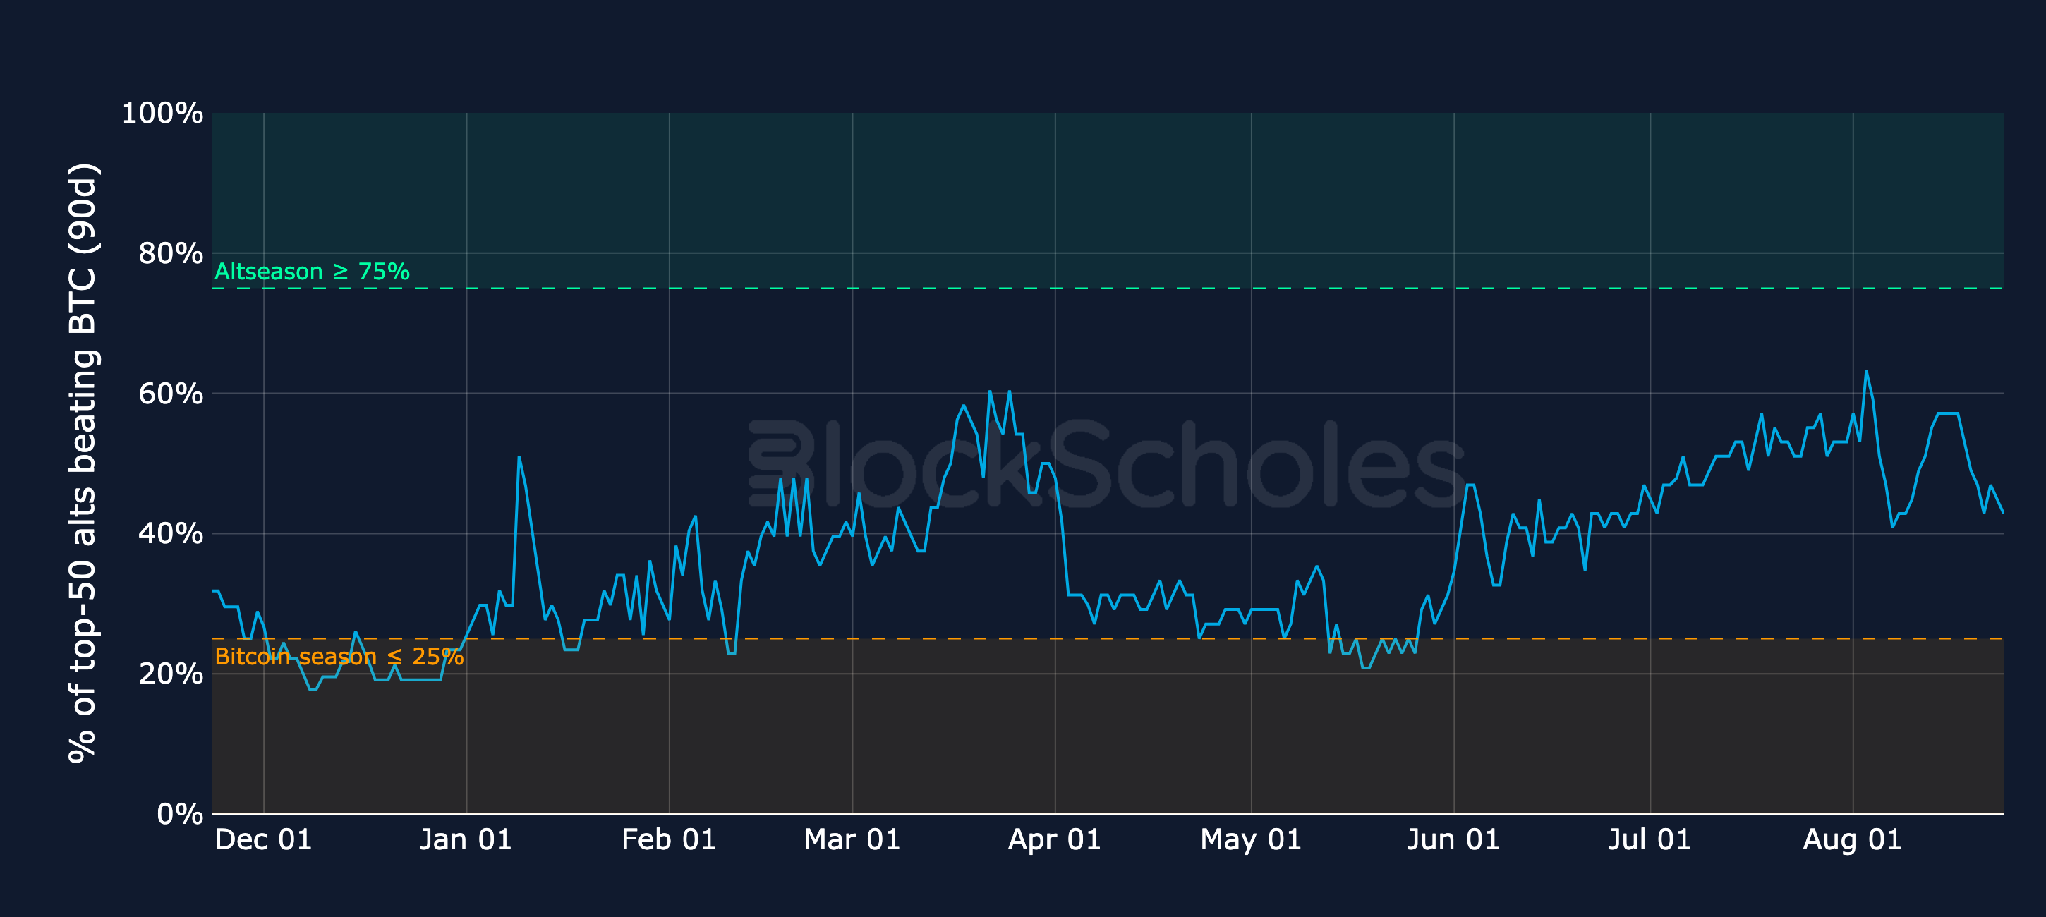
Altcoin Season Gauge (slow-moving by construction, 90-day lookback): % of top-50 altcoins outperforming BTC over the trailing 90 days (current constituents)

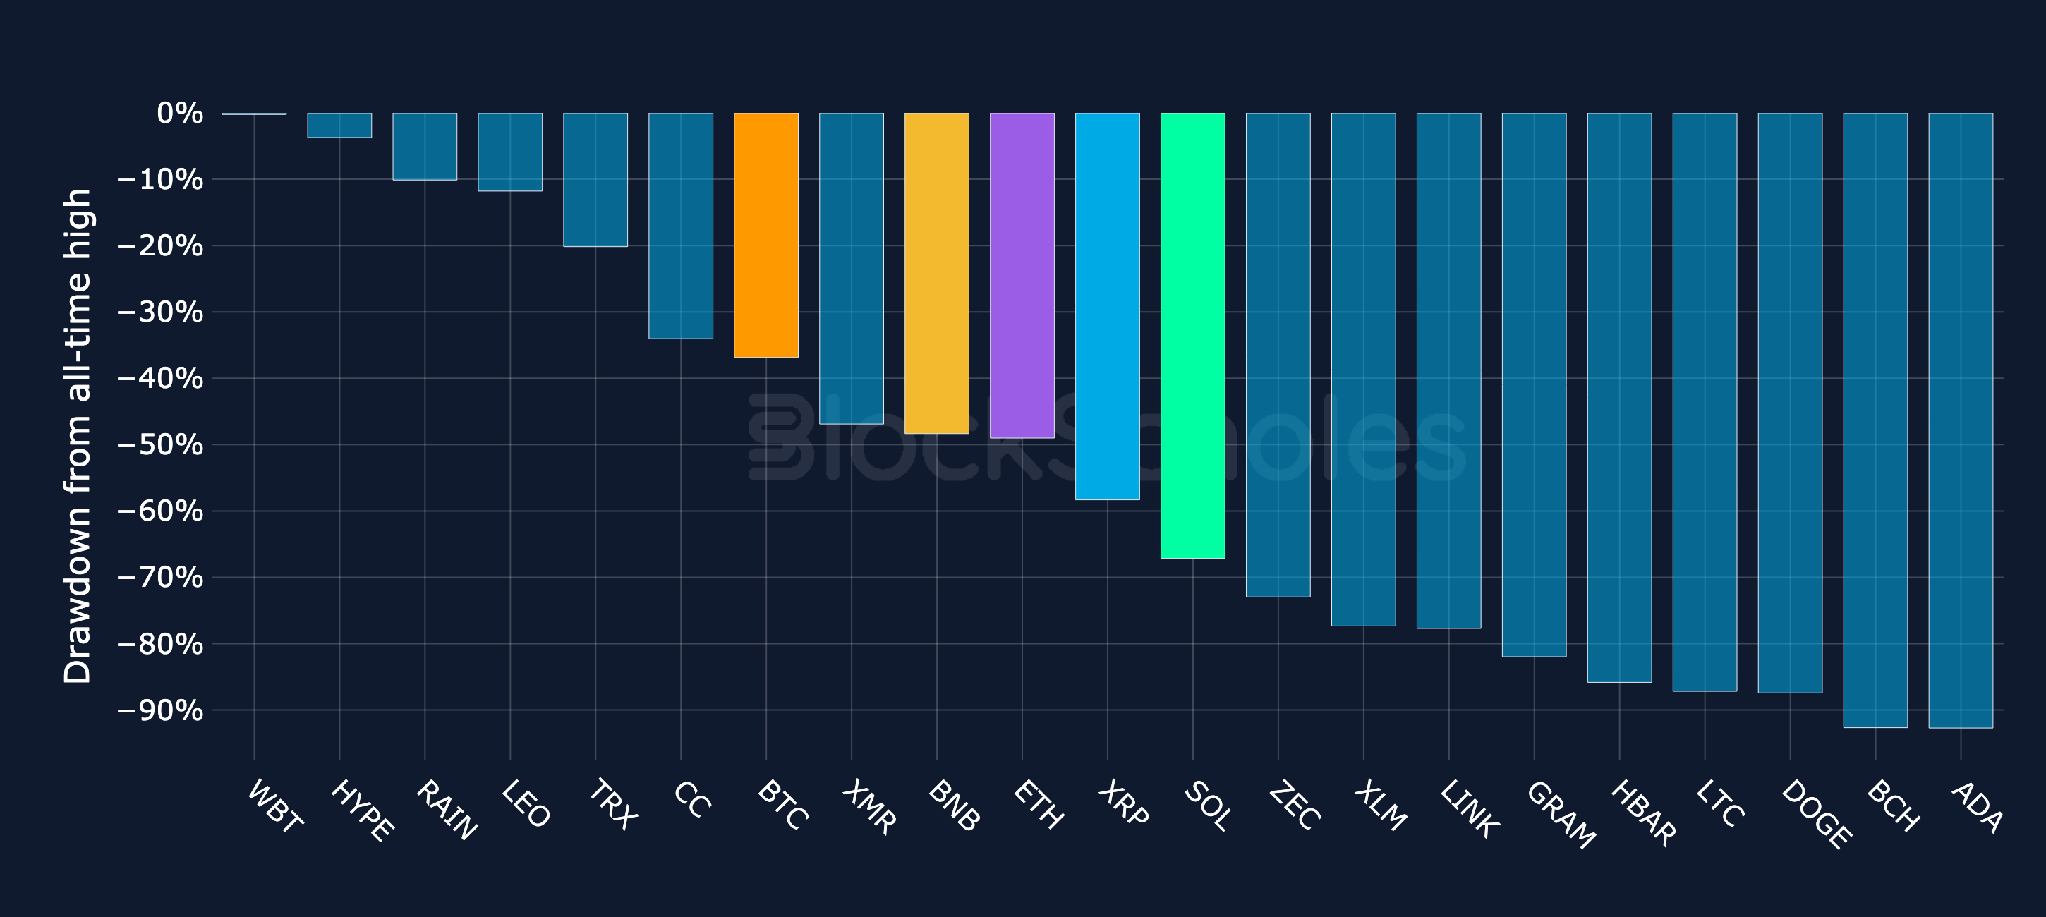
Drawdown from all-time high: BTC + top-20 altcoins by market cap

Altcoins / BTC Spot Crosses

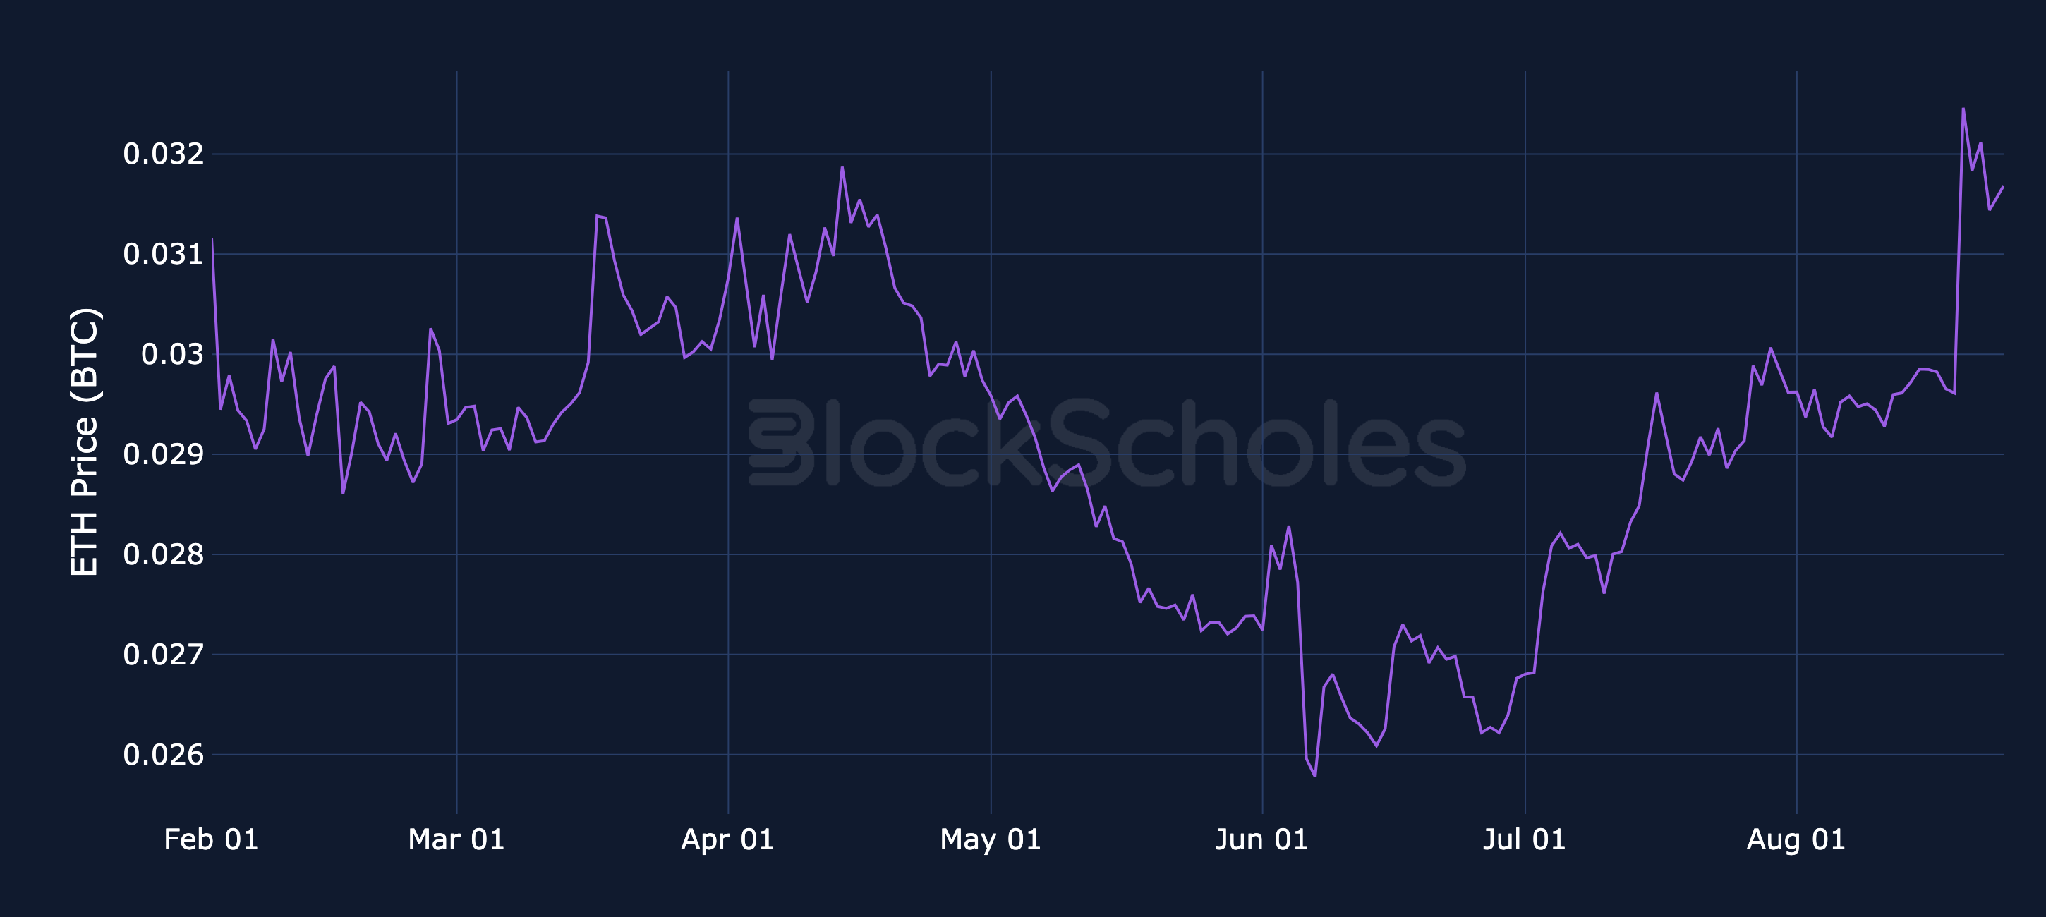
Altcoin spot prices denominated in BTC: ETH

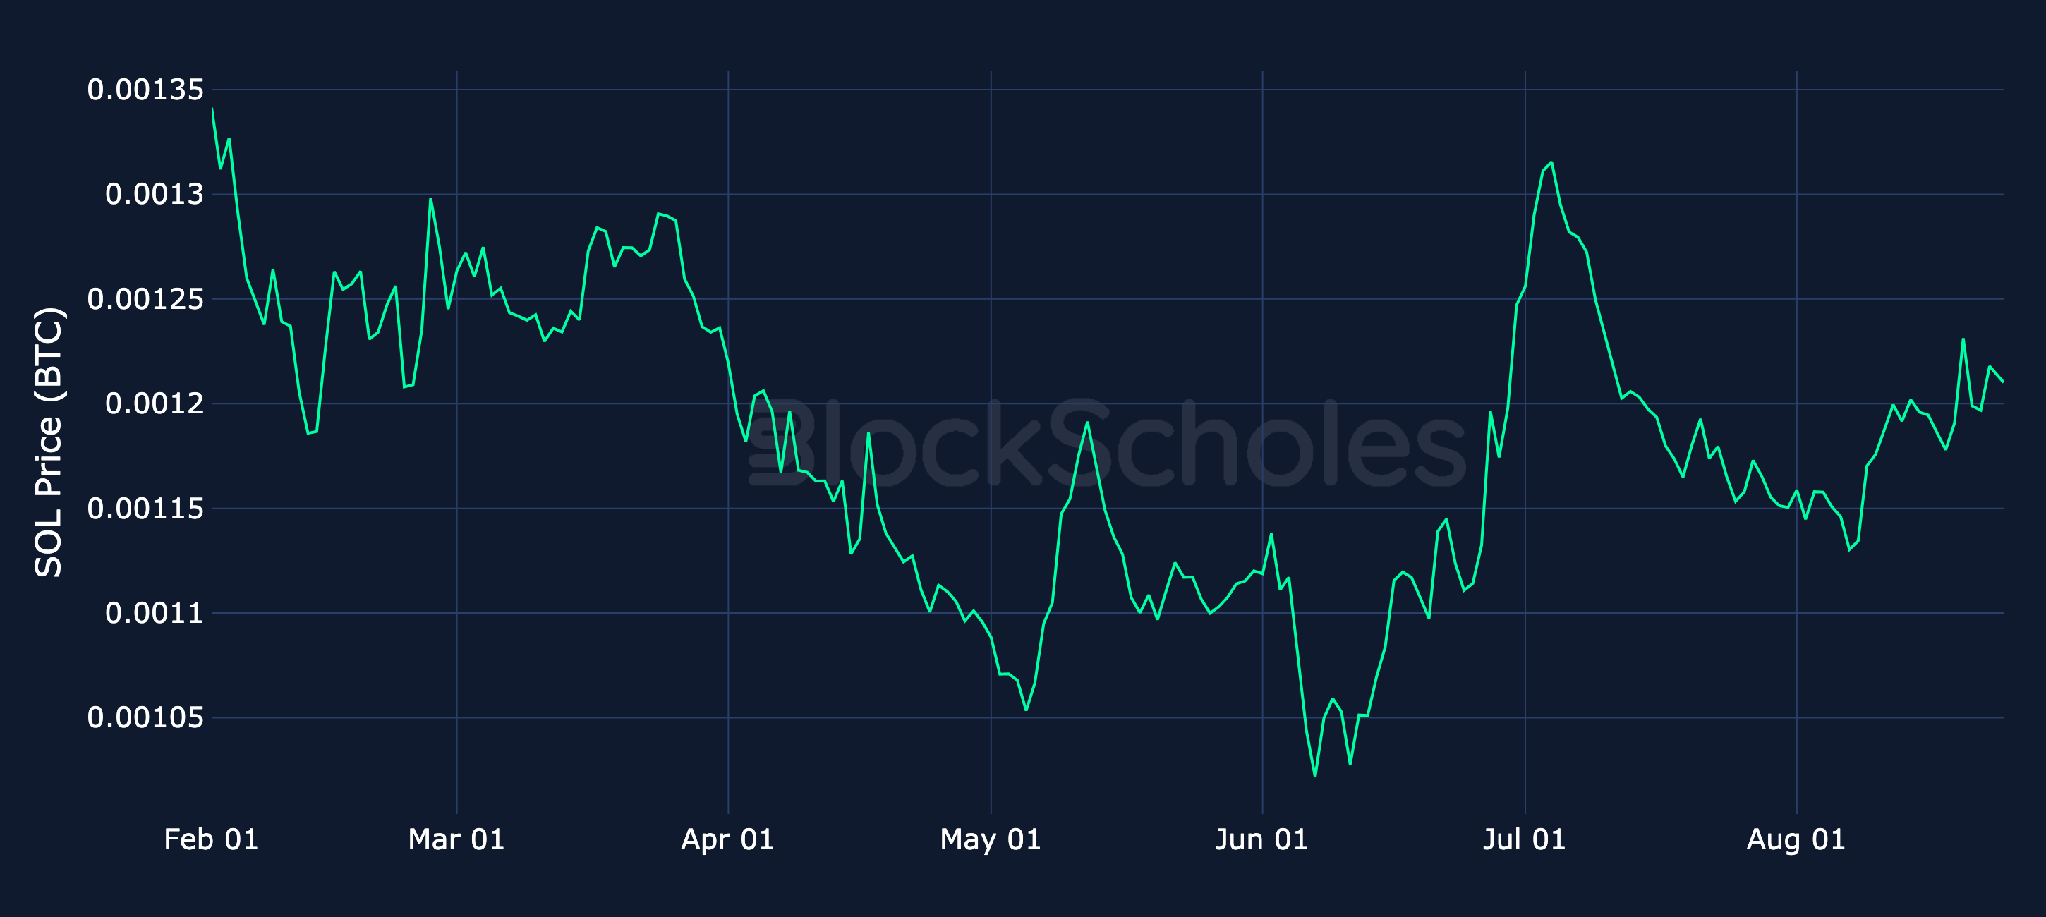
Altcoin spot prices denominated in BTC: SOL

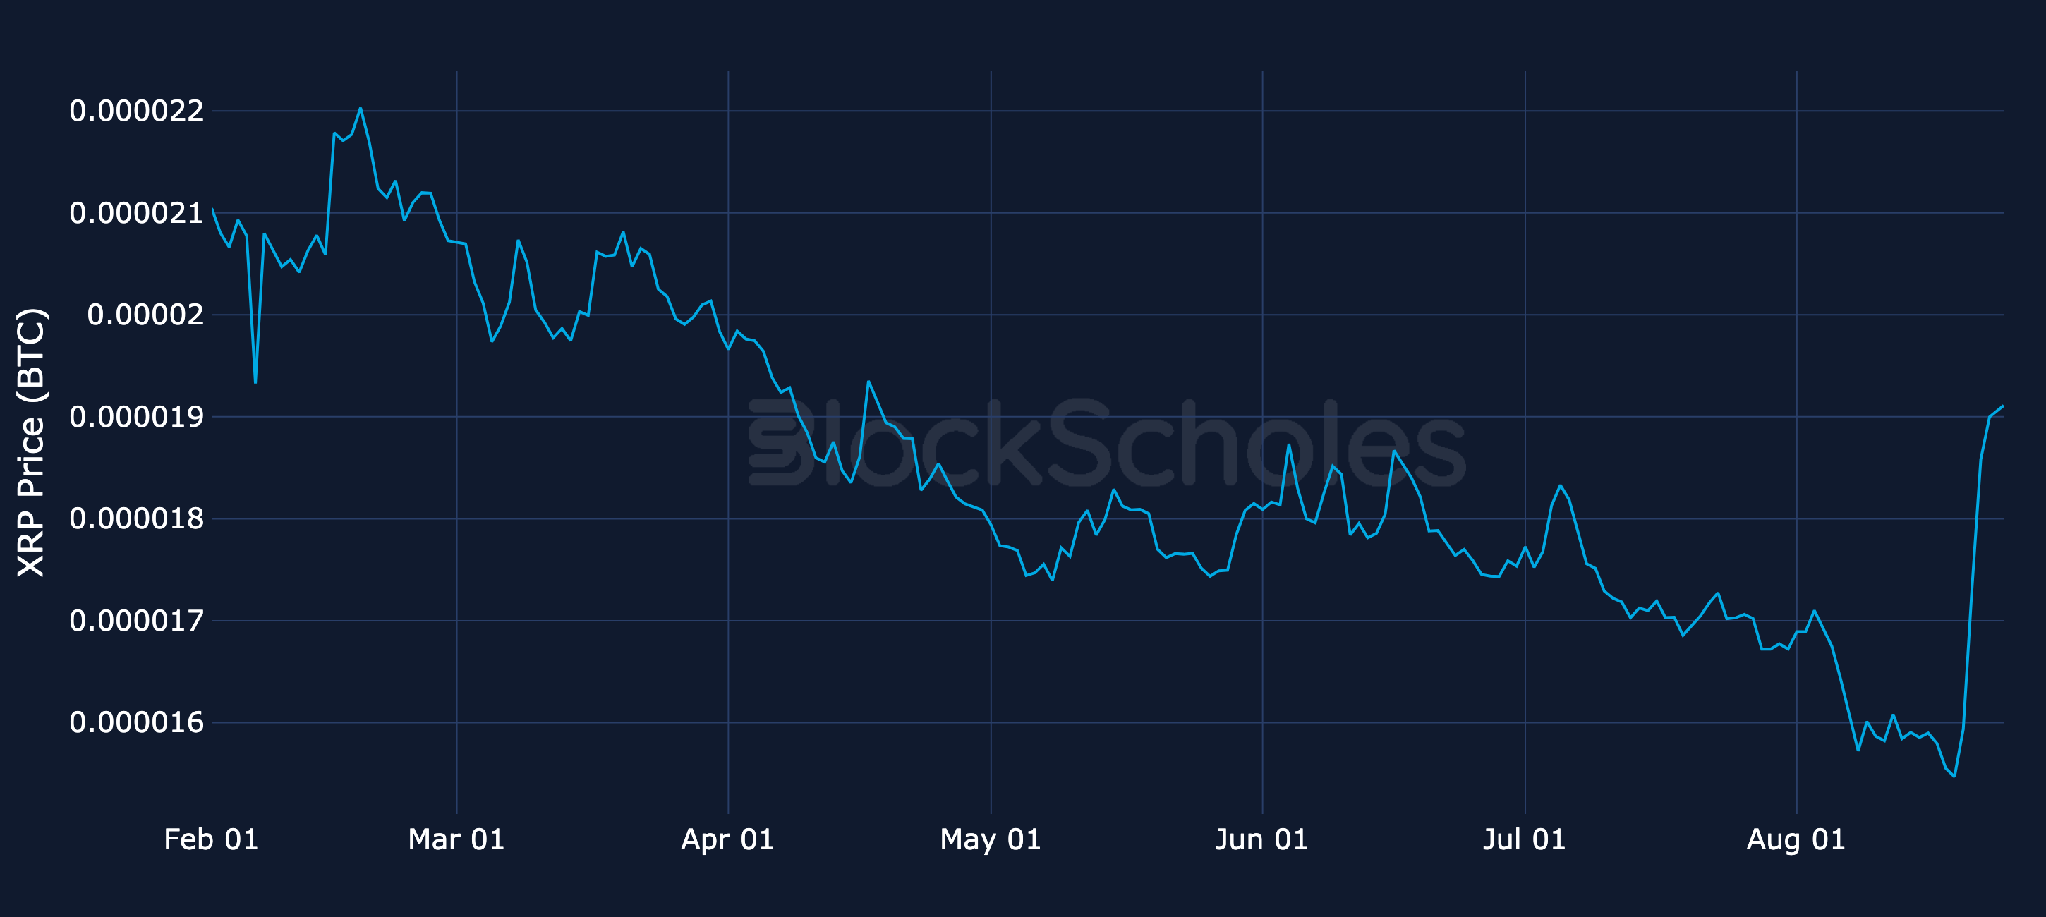
Altcoin spot prices denominated in BTC: XRP

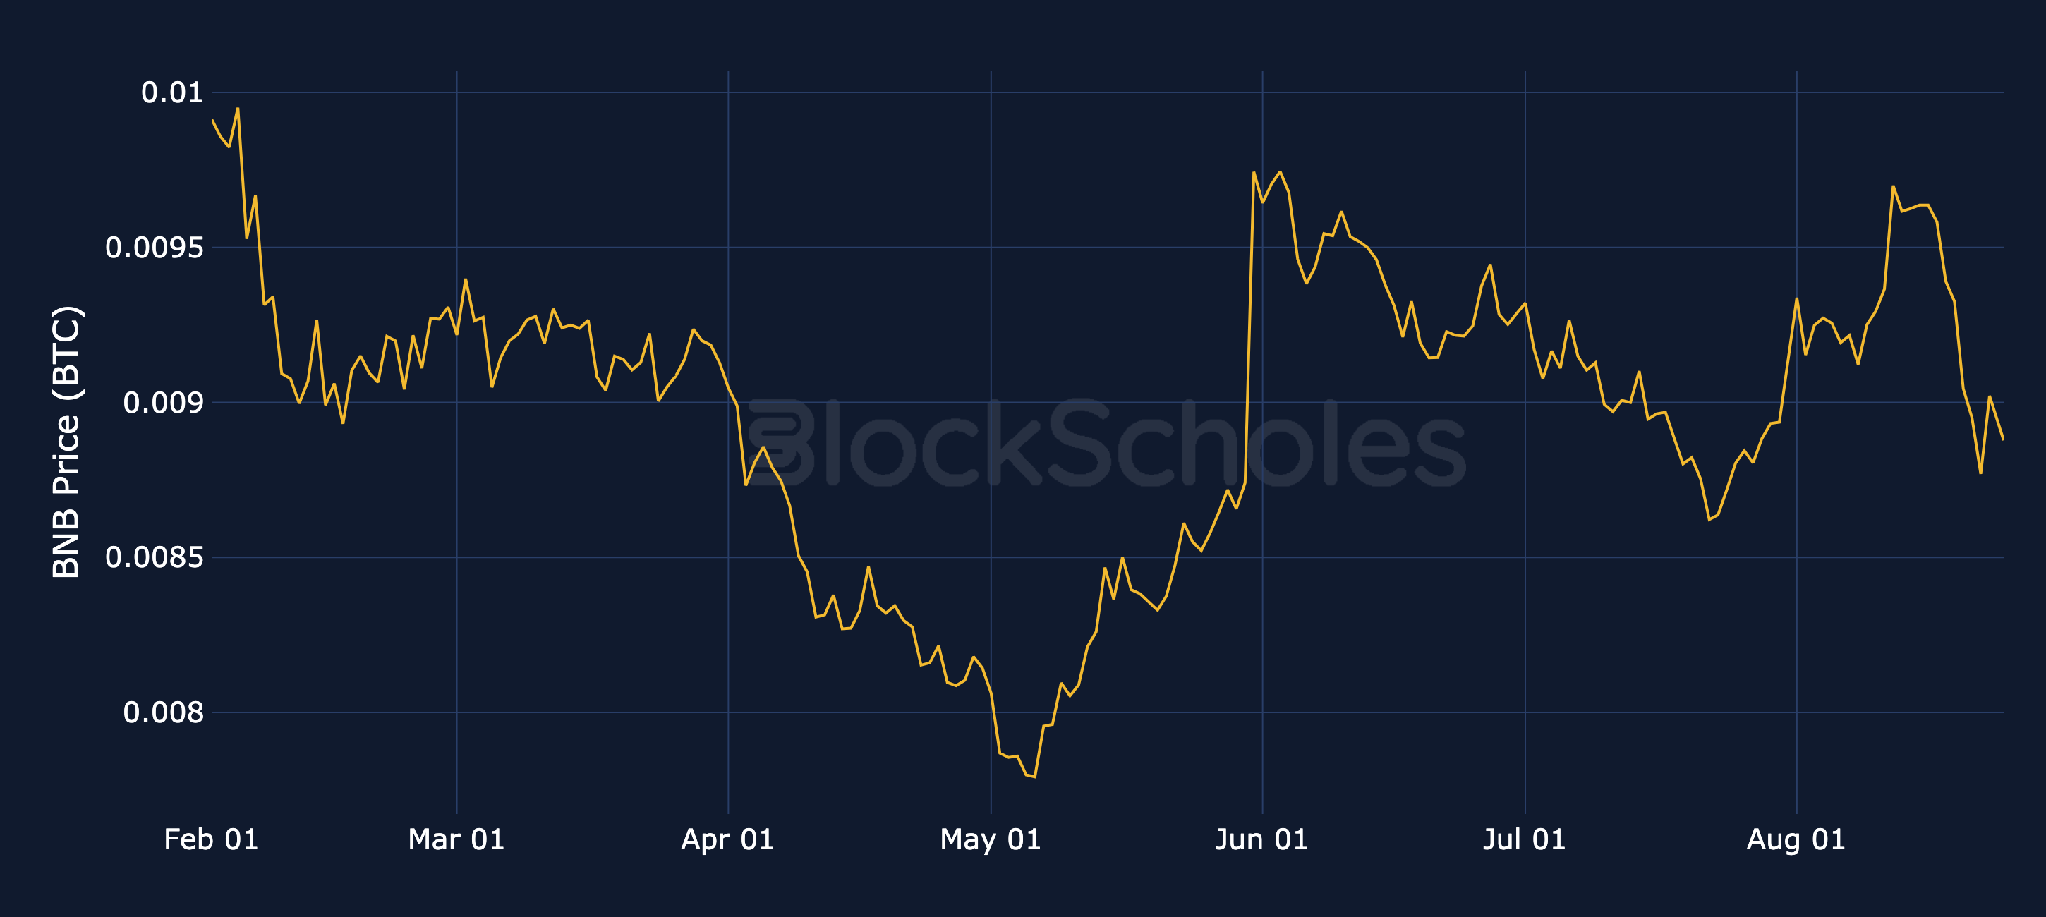
Altcoin spot prices denominated in BTC: BNB

Altcoins performance vs BTC

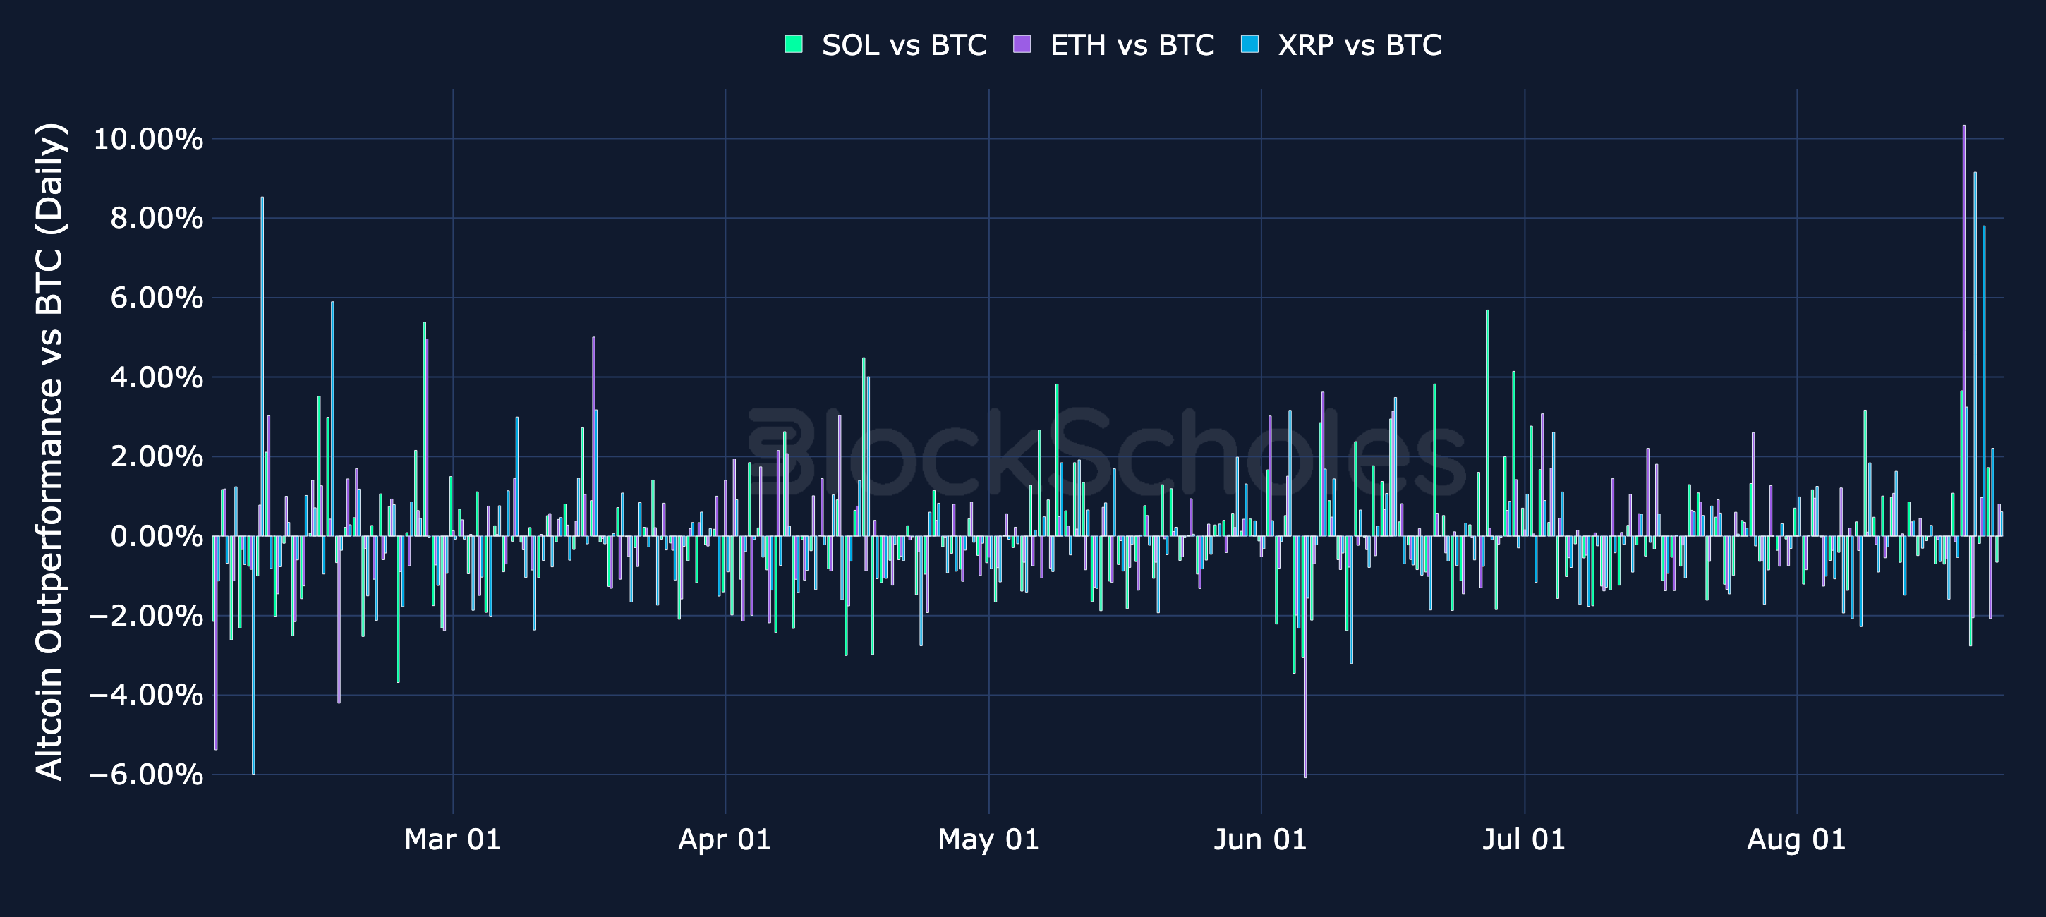
Daily relative simple returns vs BTC

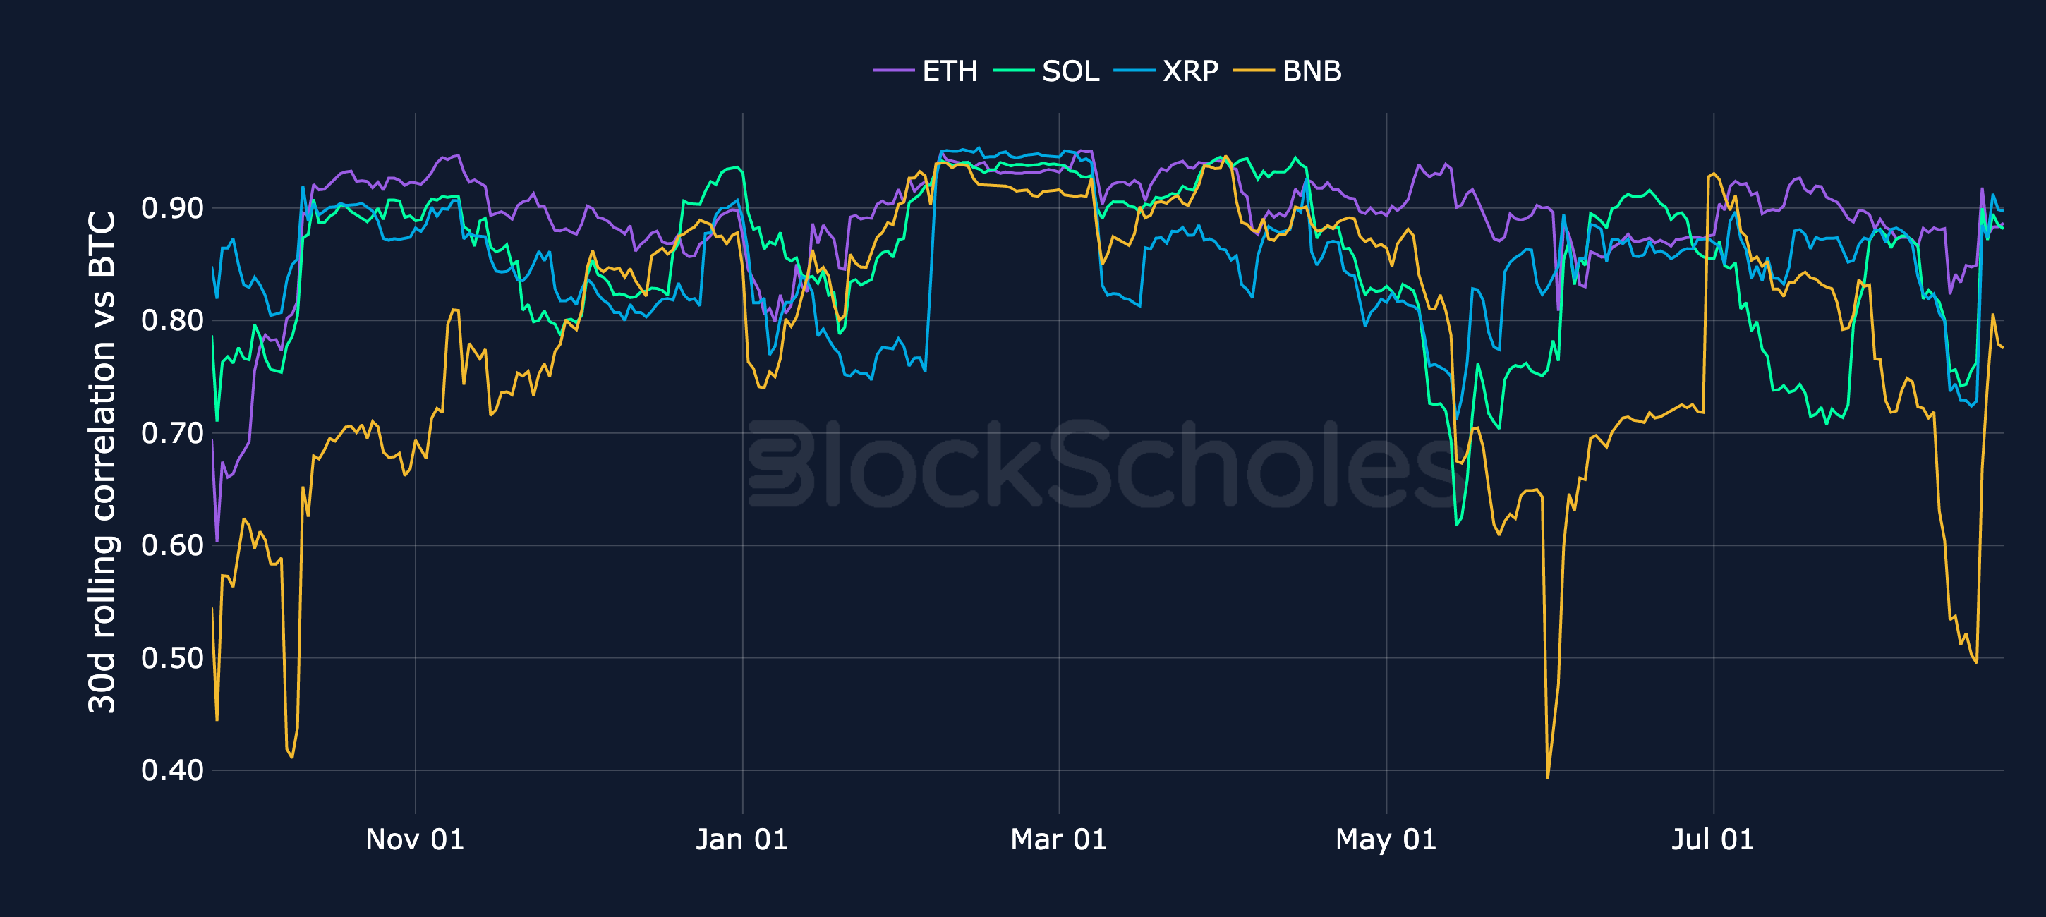
Rolling 30-day correlation vs BTC

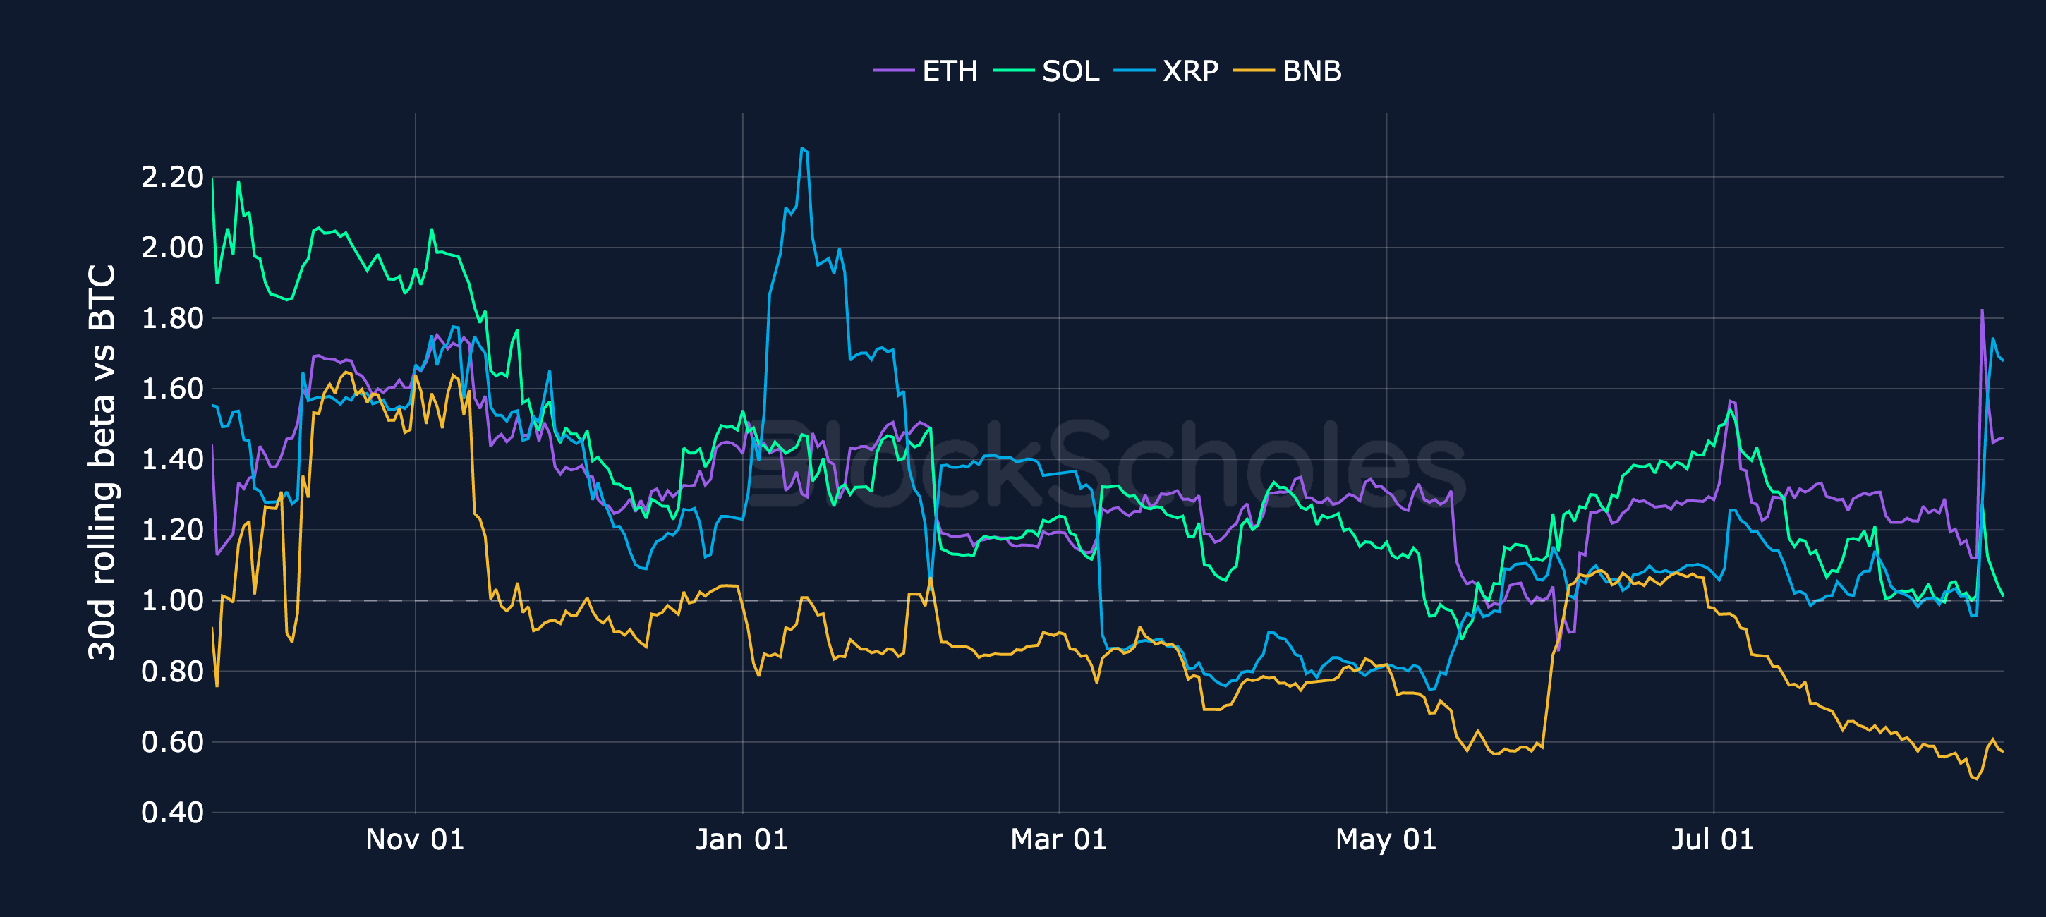
Rolling 30-day beta vs BTC

Altcoin Performance vs BTC

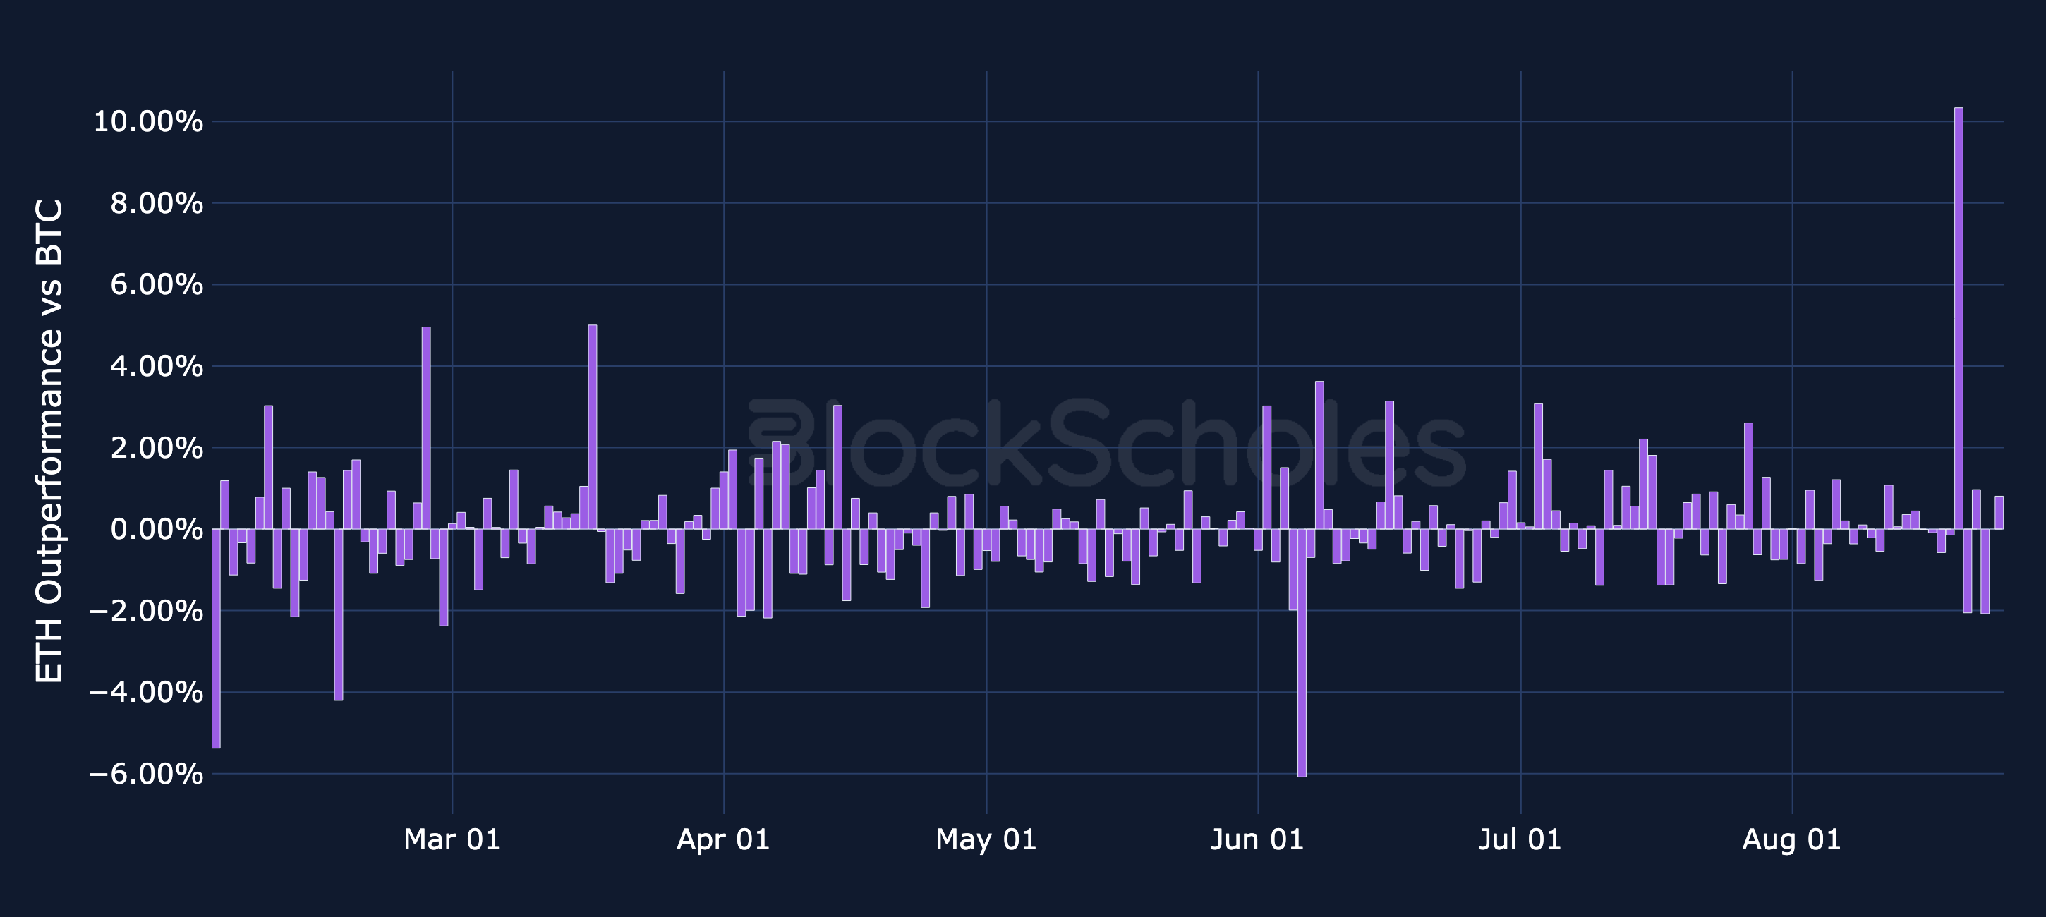
Daily relative simple returns vs BTC: ETH

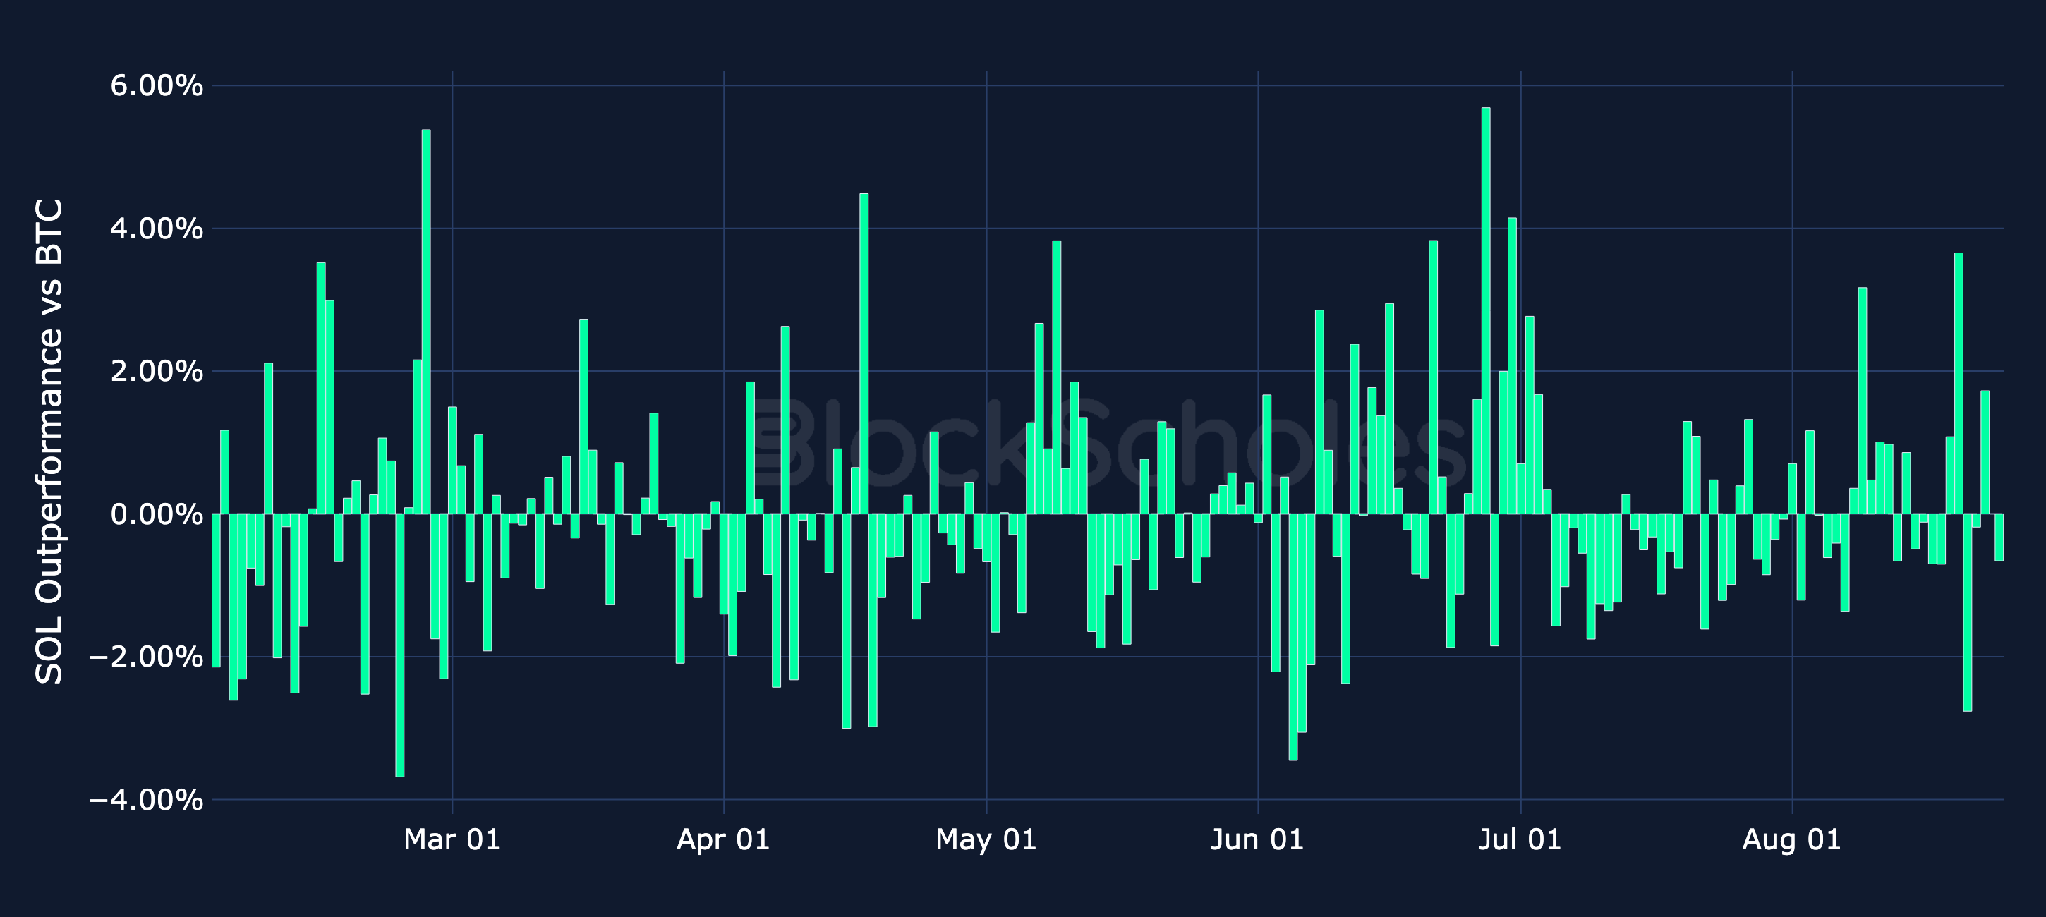
Daily relative simple returns vs BTC: SOL

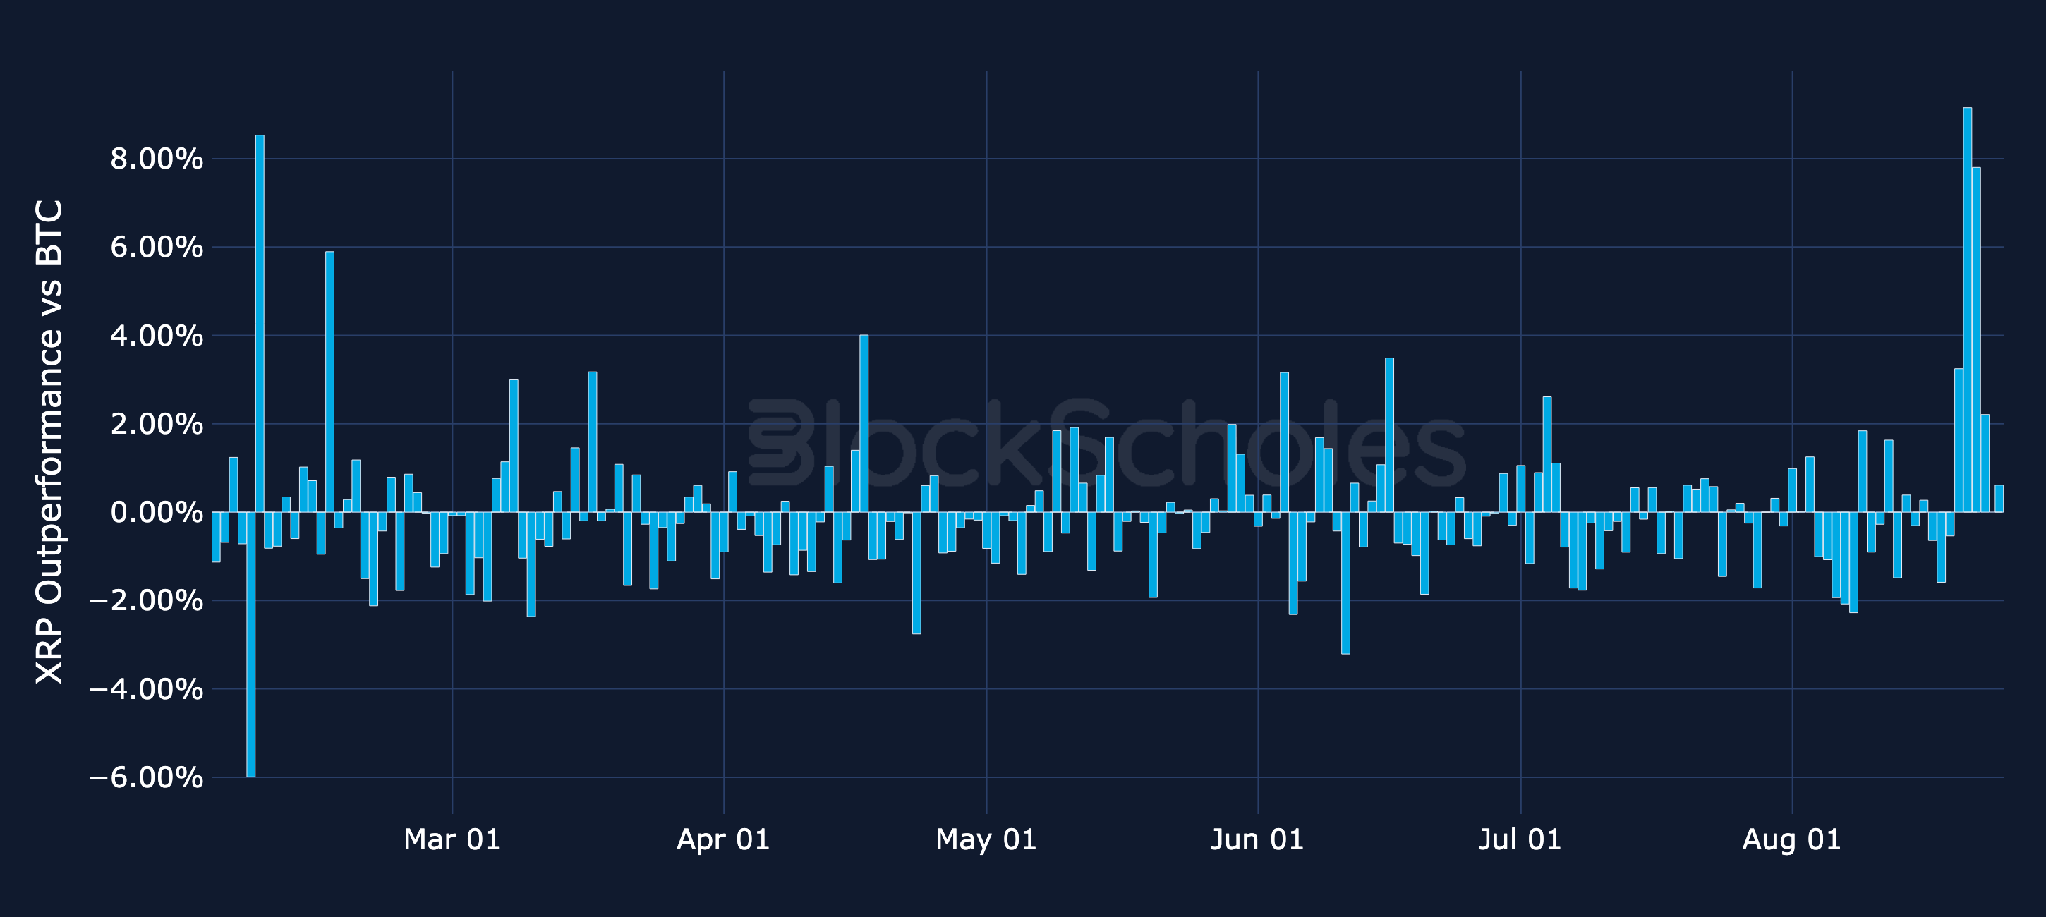
Daily relative simple returns vs BTC: XRP

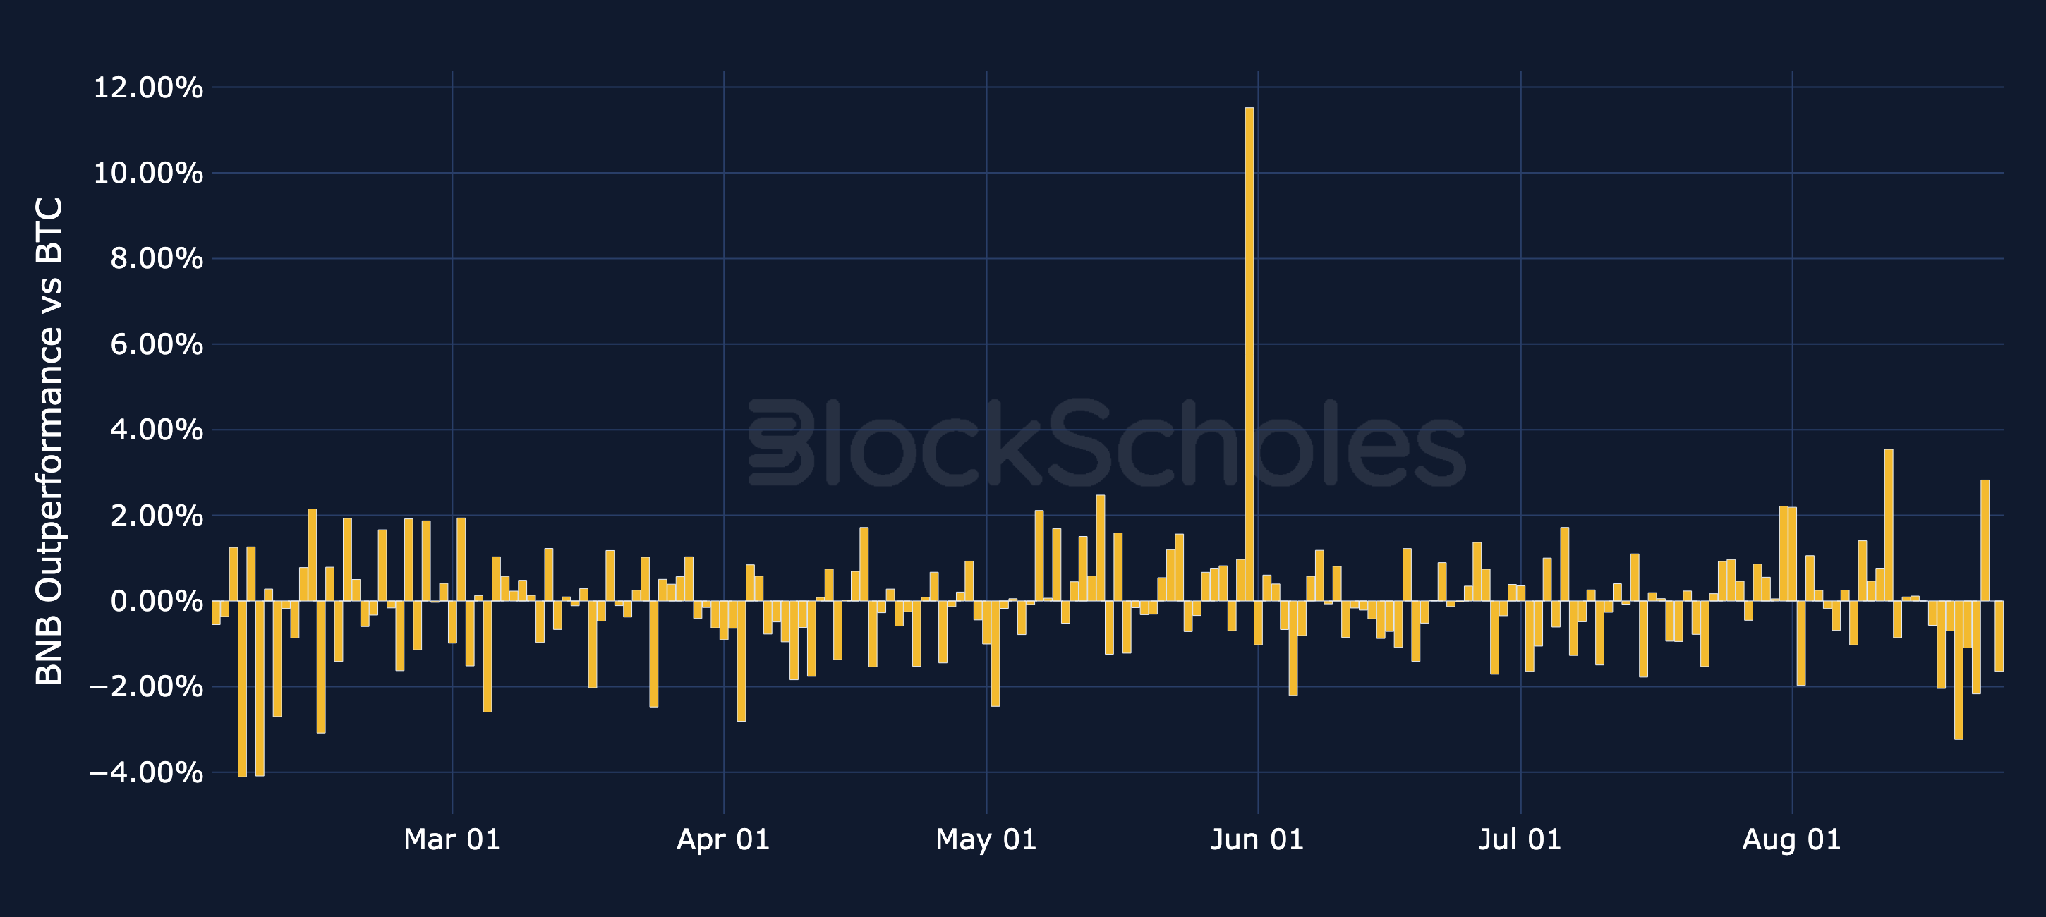
Daily relative simple returns vs BTC: BNB

ETF Flows: BTC, ETH & Altcoins

ETF Flows – Spot BTC ETFs took in $1.92B over the past week (17th August–21st August) and ETH ETFs added $697M, their strongest combined week since October 2025. The run does not yet reverse the longer outflow regime: in the 74 trading days since cumulative flows peaked on 6th May, BTC ETFs have posted net inflows on just 29 and remain a cumulative $6.06B lower over the stretch, while last week's inflows cut ETH ETFs' deficit over the same period to just $36.5M.

Over the past week, altcoin ETFs showed a more mixed picture. XRP led inflows at $39.8M, followed by SOL at $28.3M, LINK at $13.4M, HYPE at $3.89M, AVAX at $1.3M, HBAR at $848K, and DOGE at $654K. BNB recorded a net $262K outflow. XRP's flows were entirely inflows rather than outflows over the week, with net inflows on 4 of 5 trading days and no net-outflow sessions.

Adjusted for market cap, ETH now shows the largest 20-day rolling net inflow, at around 0.33% of token market cap, lifted by last week's flows. Among altcoin ETFs, LINK leads at around 0.19% (as of 21st August).
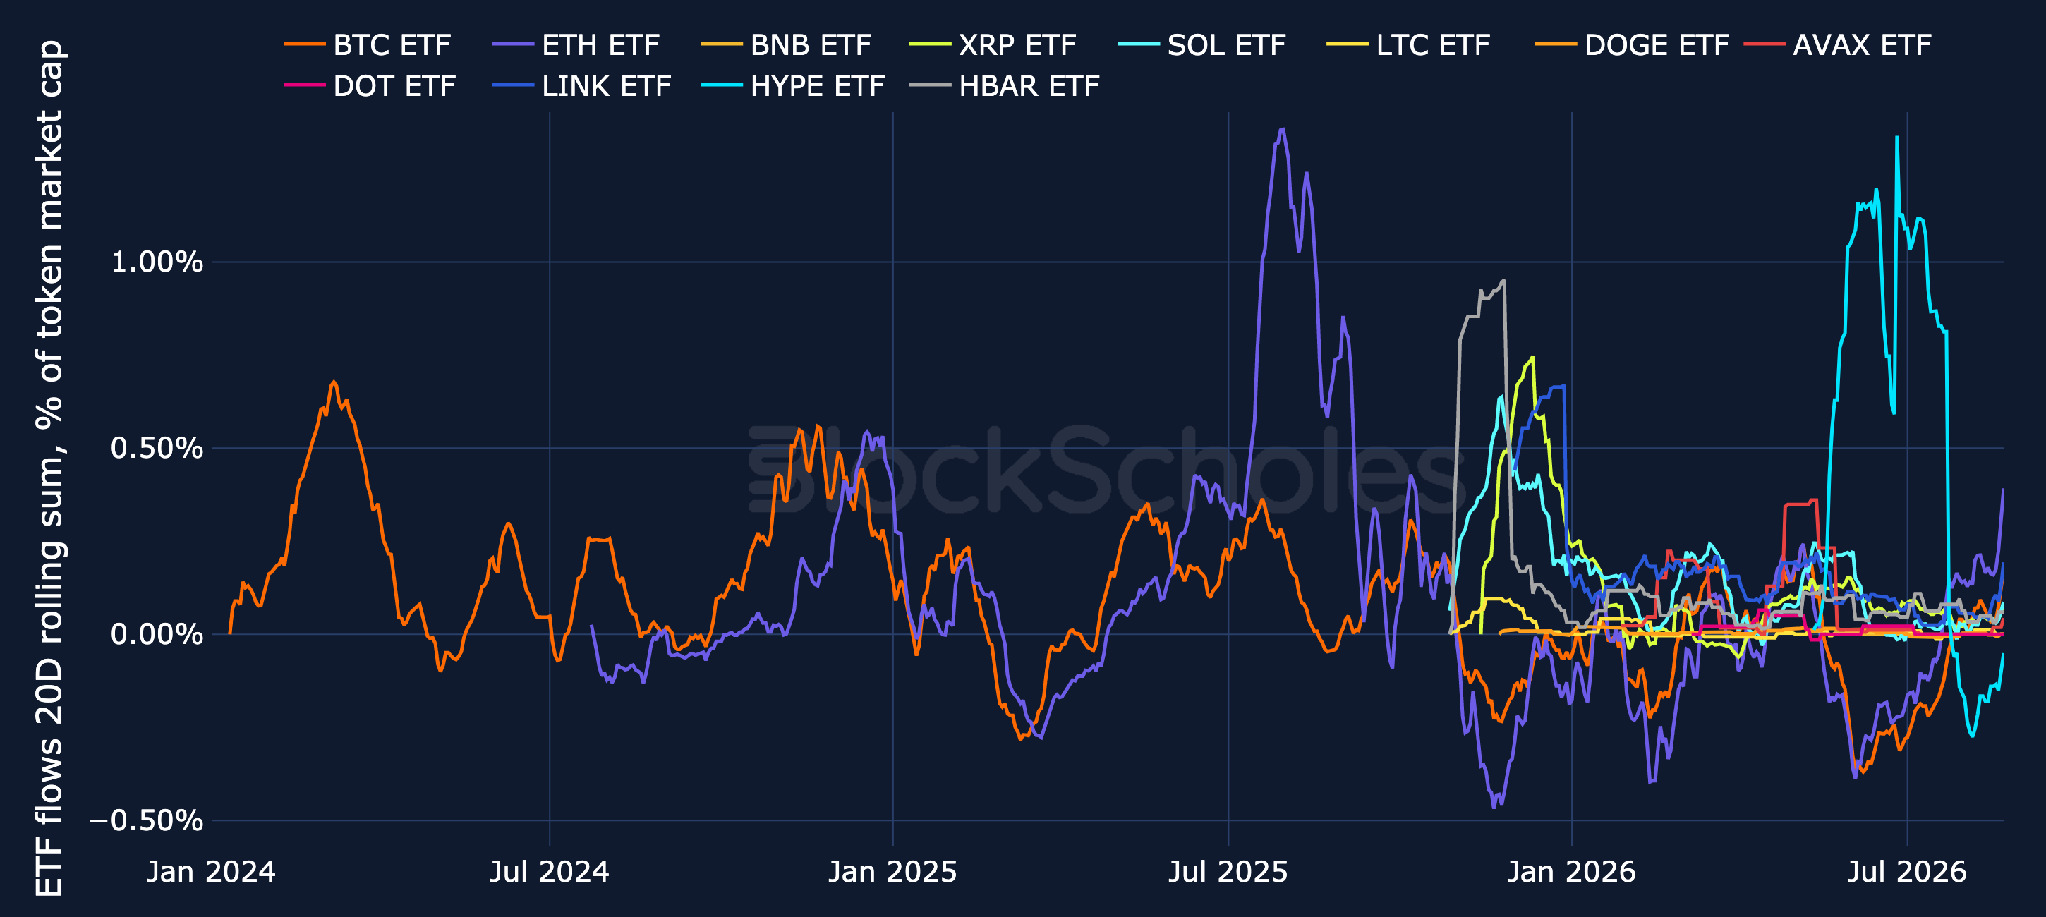
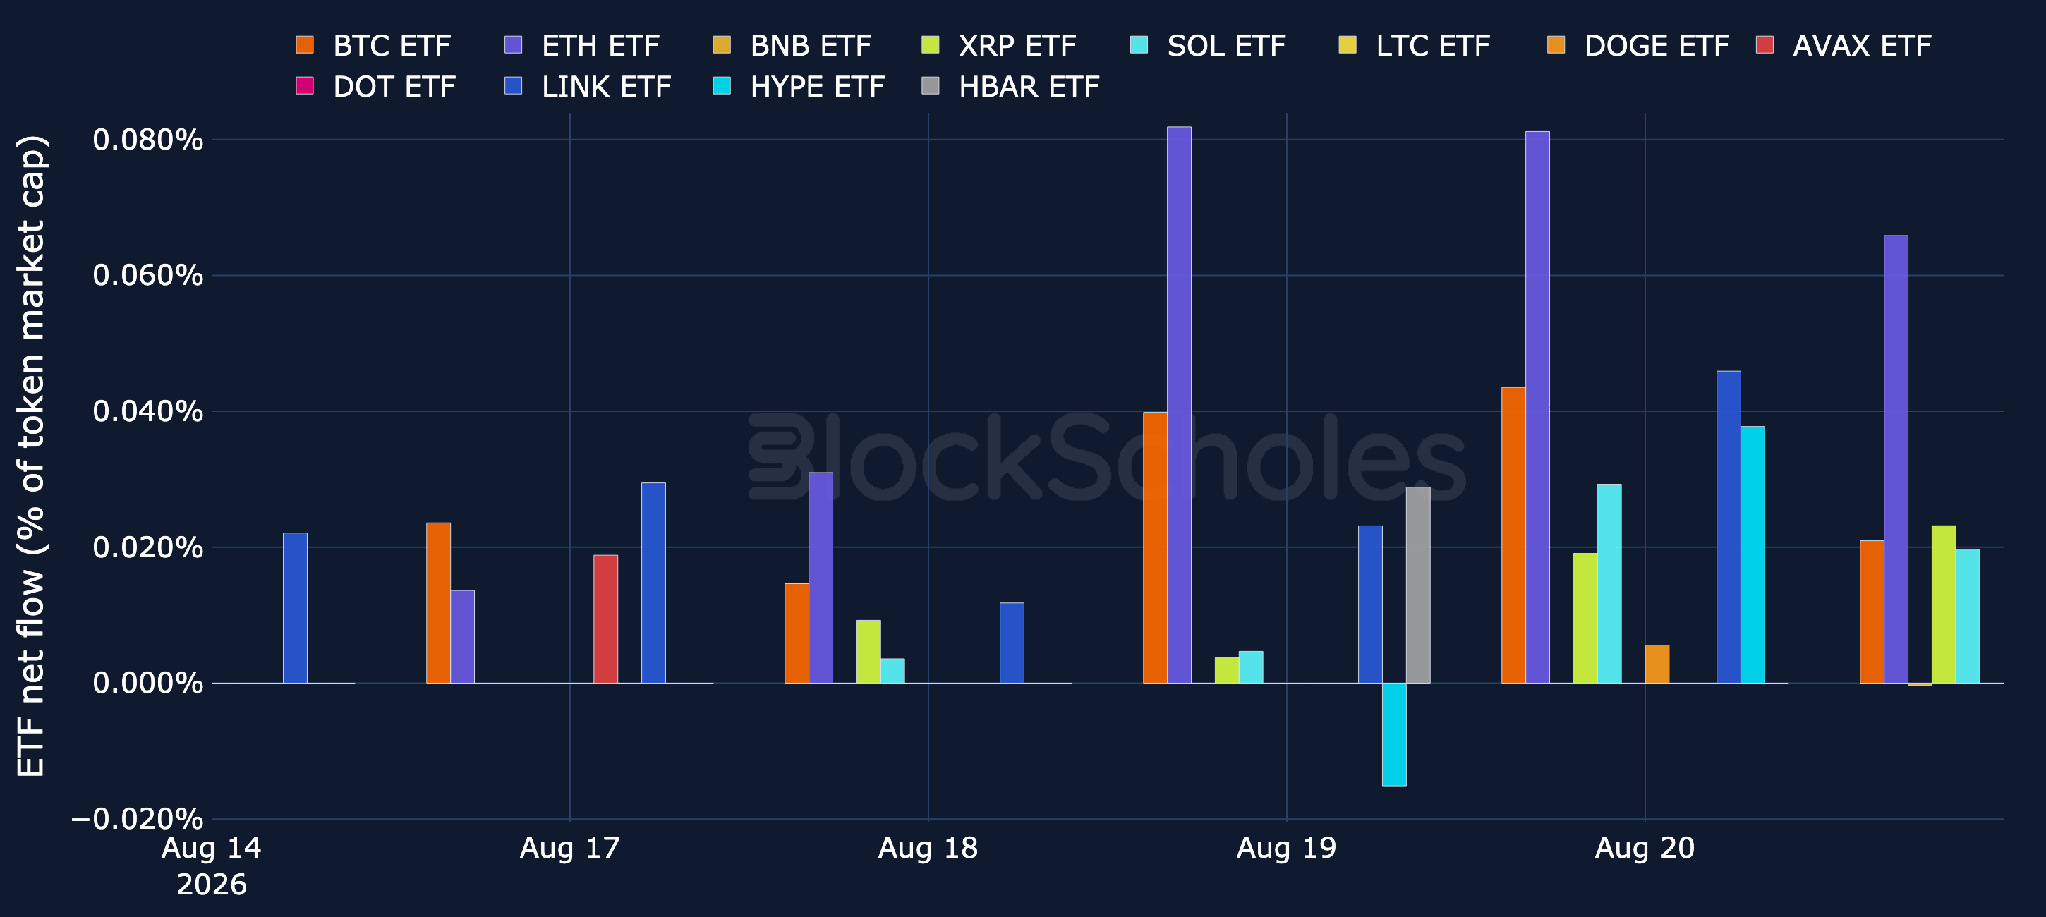
ETF net flows: BTC, ETH & Altcoins (20-day rolling, % of market cap)

ETF net flows: BTC, ETH & Altcoins (latest week, % of market cap)

Regression-Based Valuation vs BTC

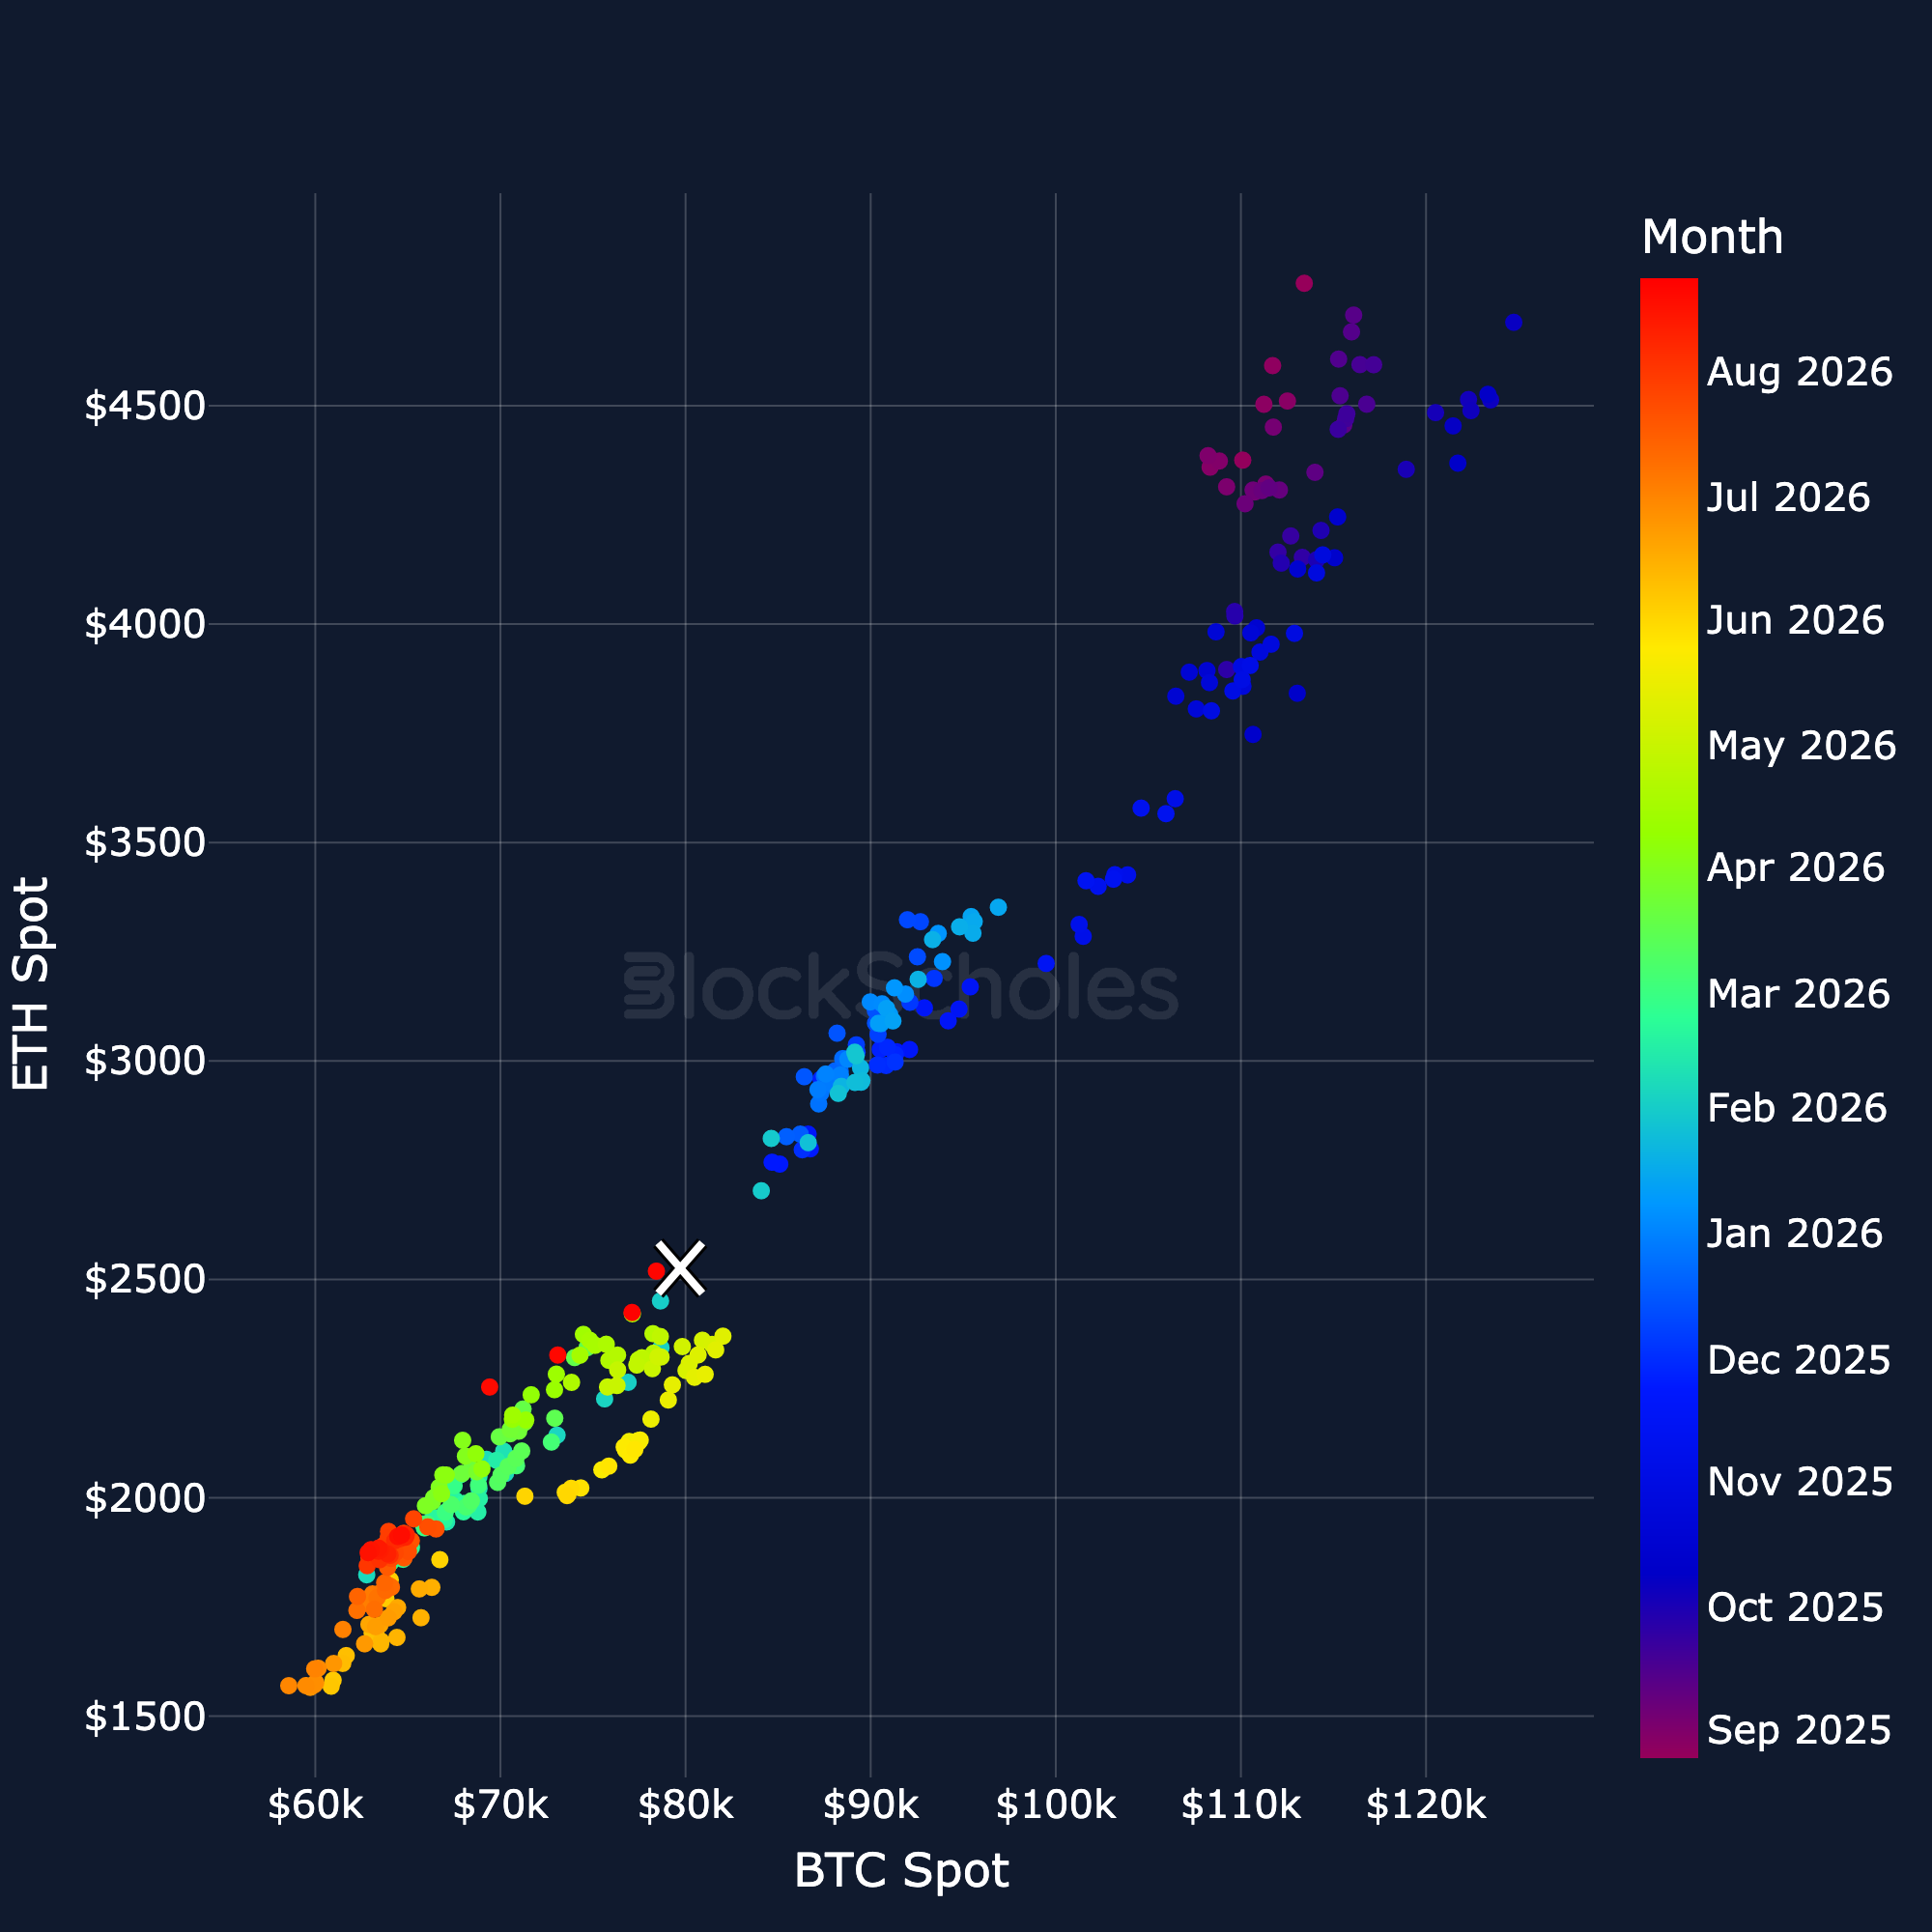
ETH Spot vs BTC Spot regression

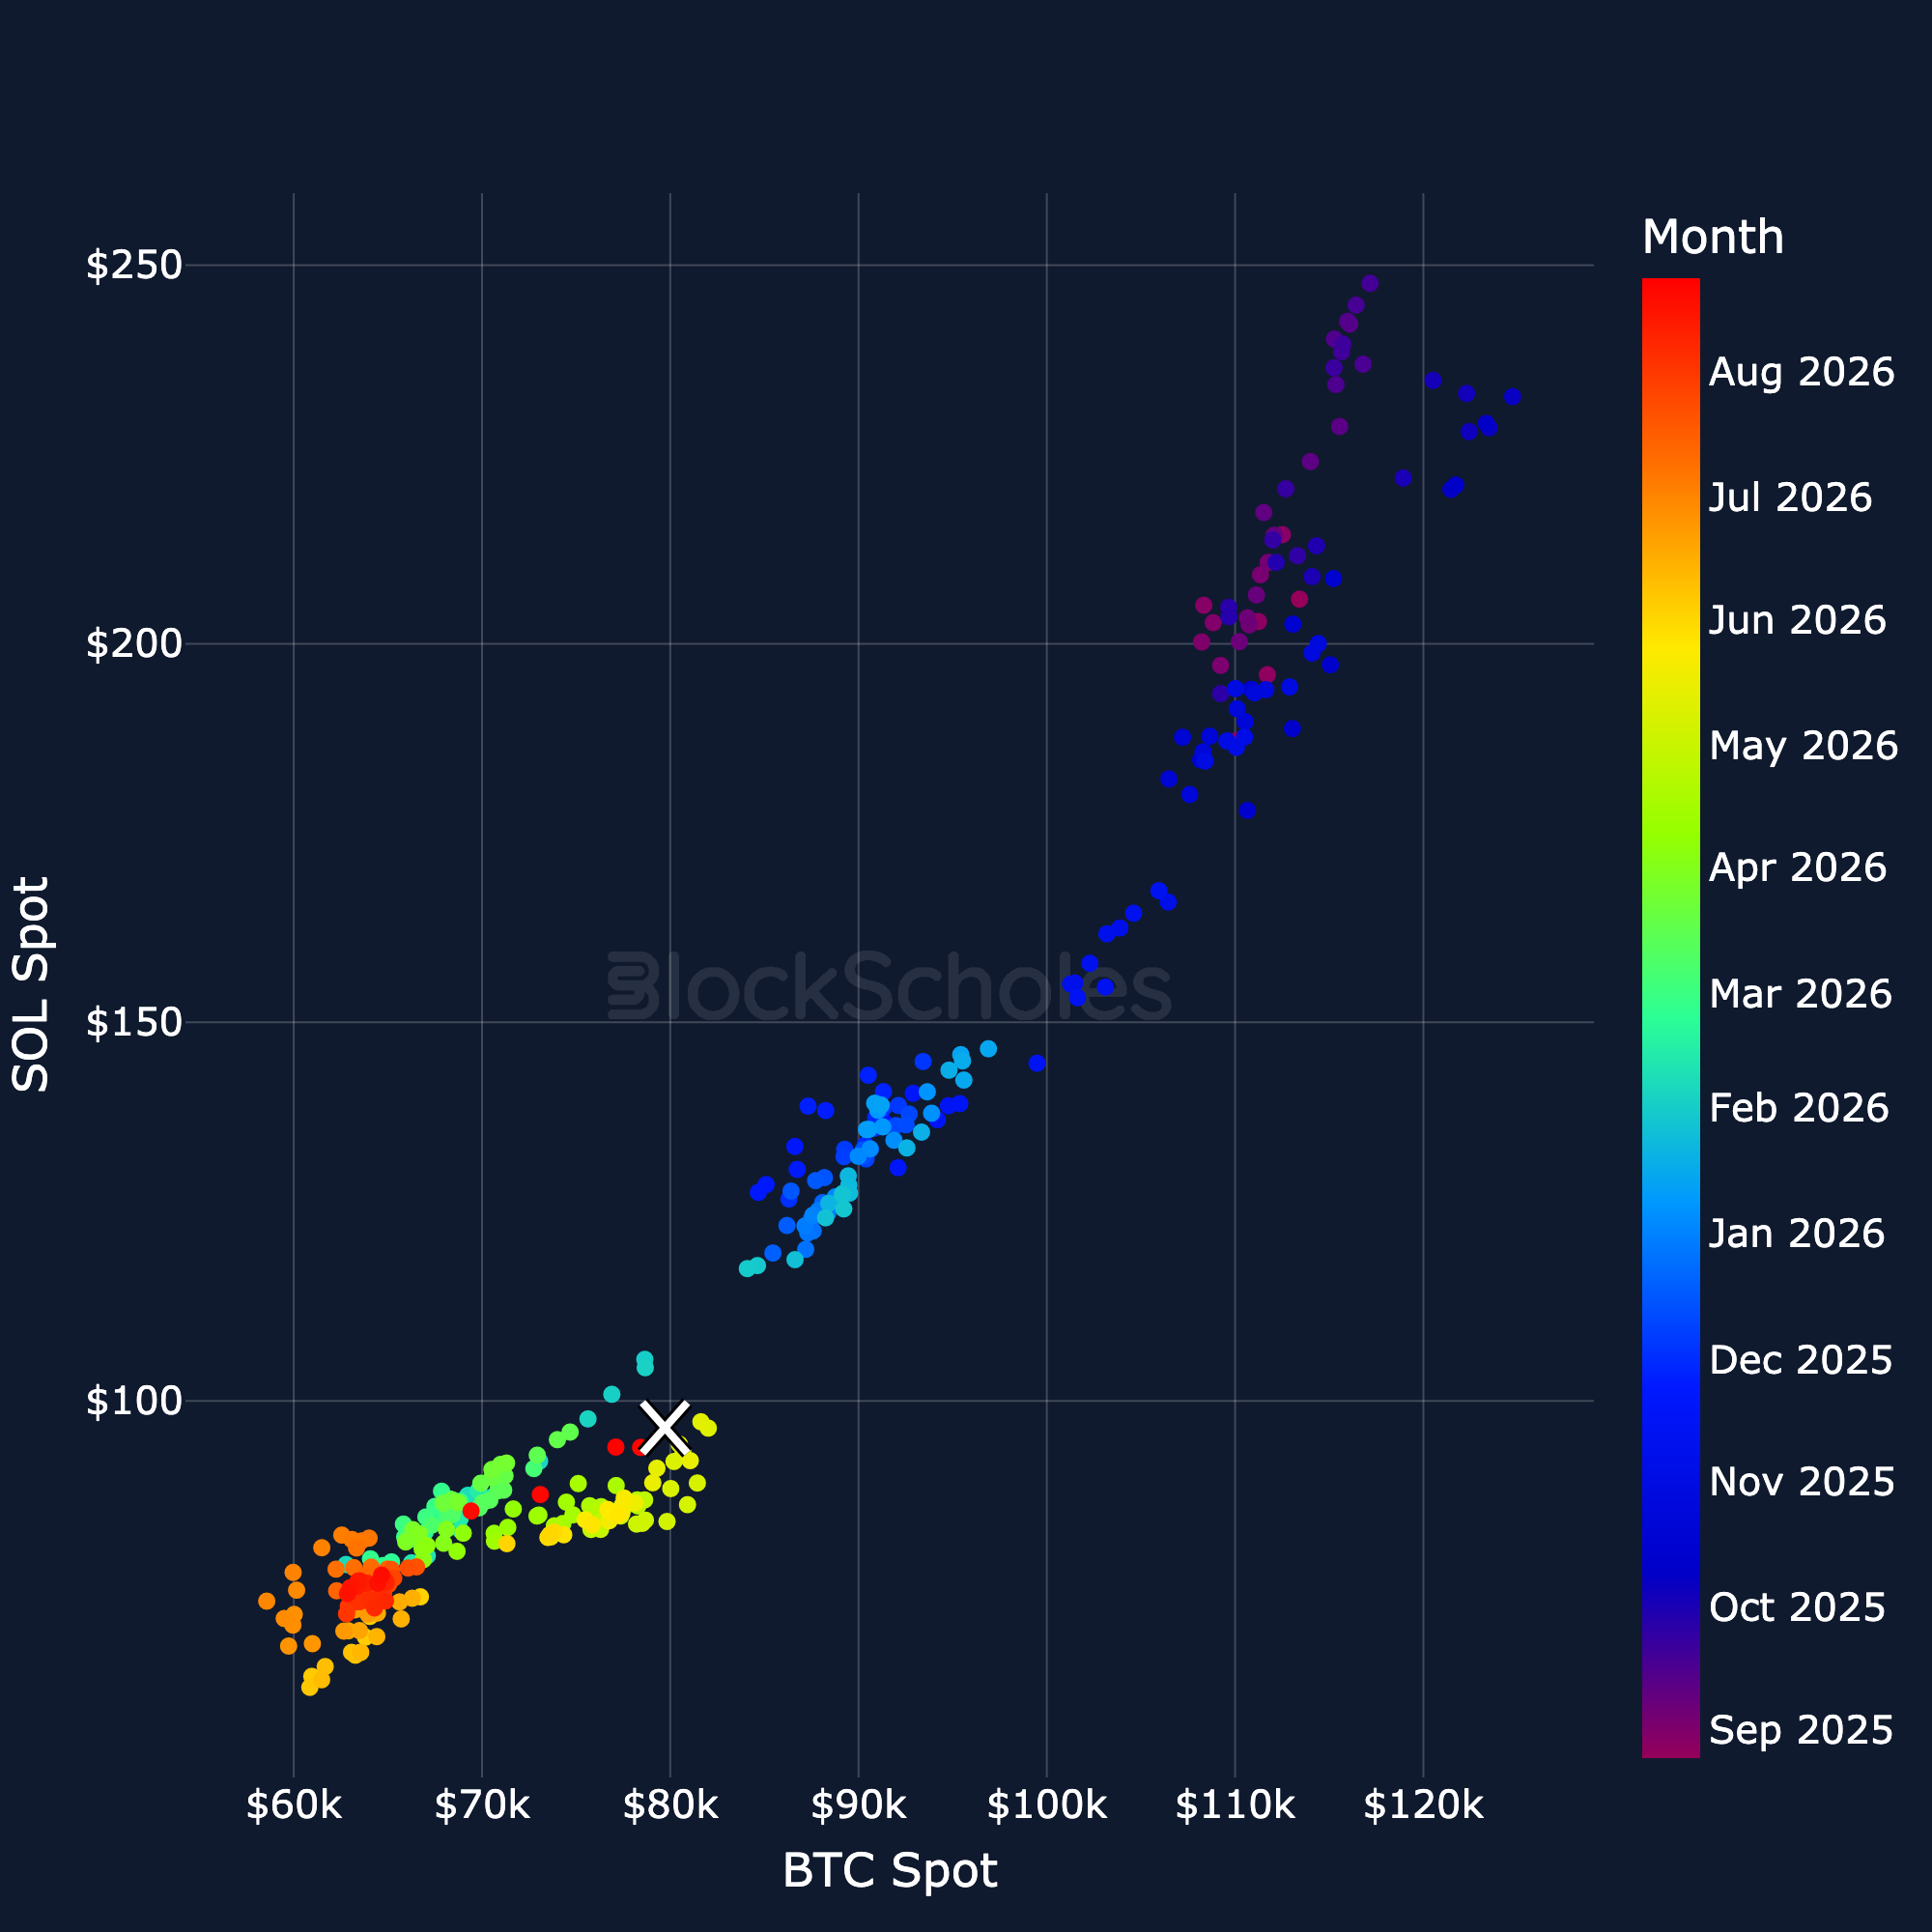
SOL Spot vs BTC Spot regression

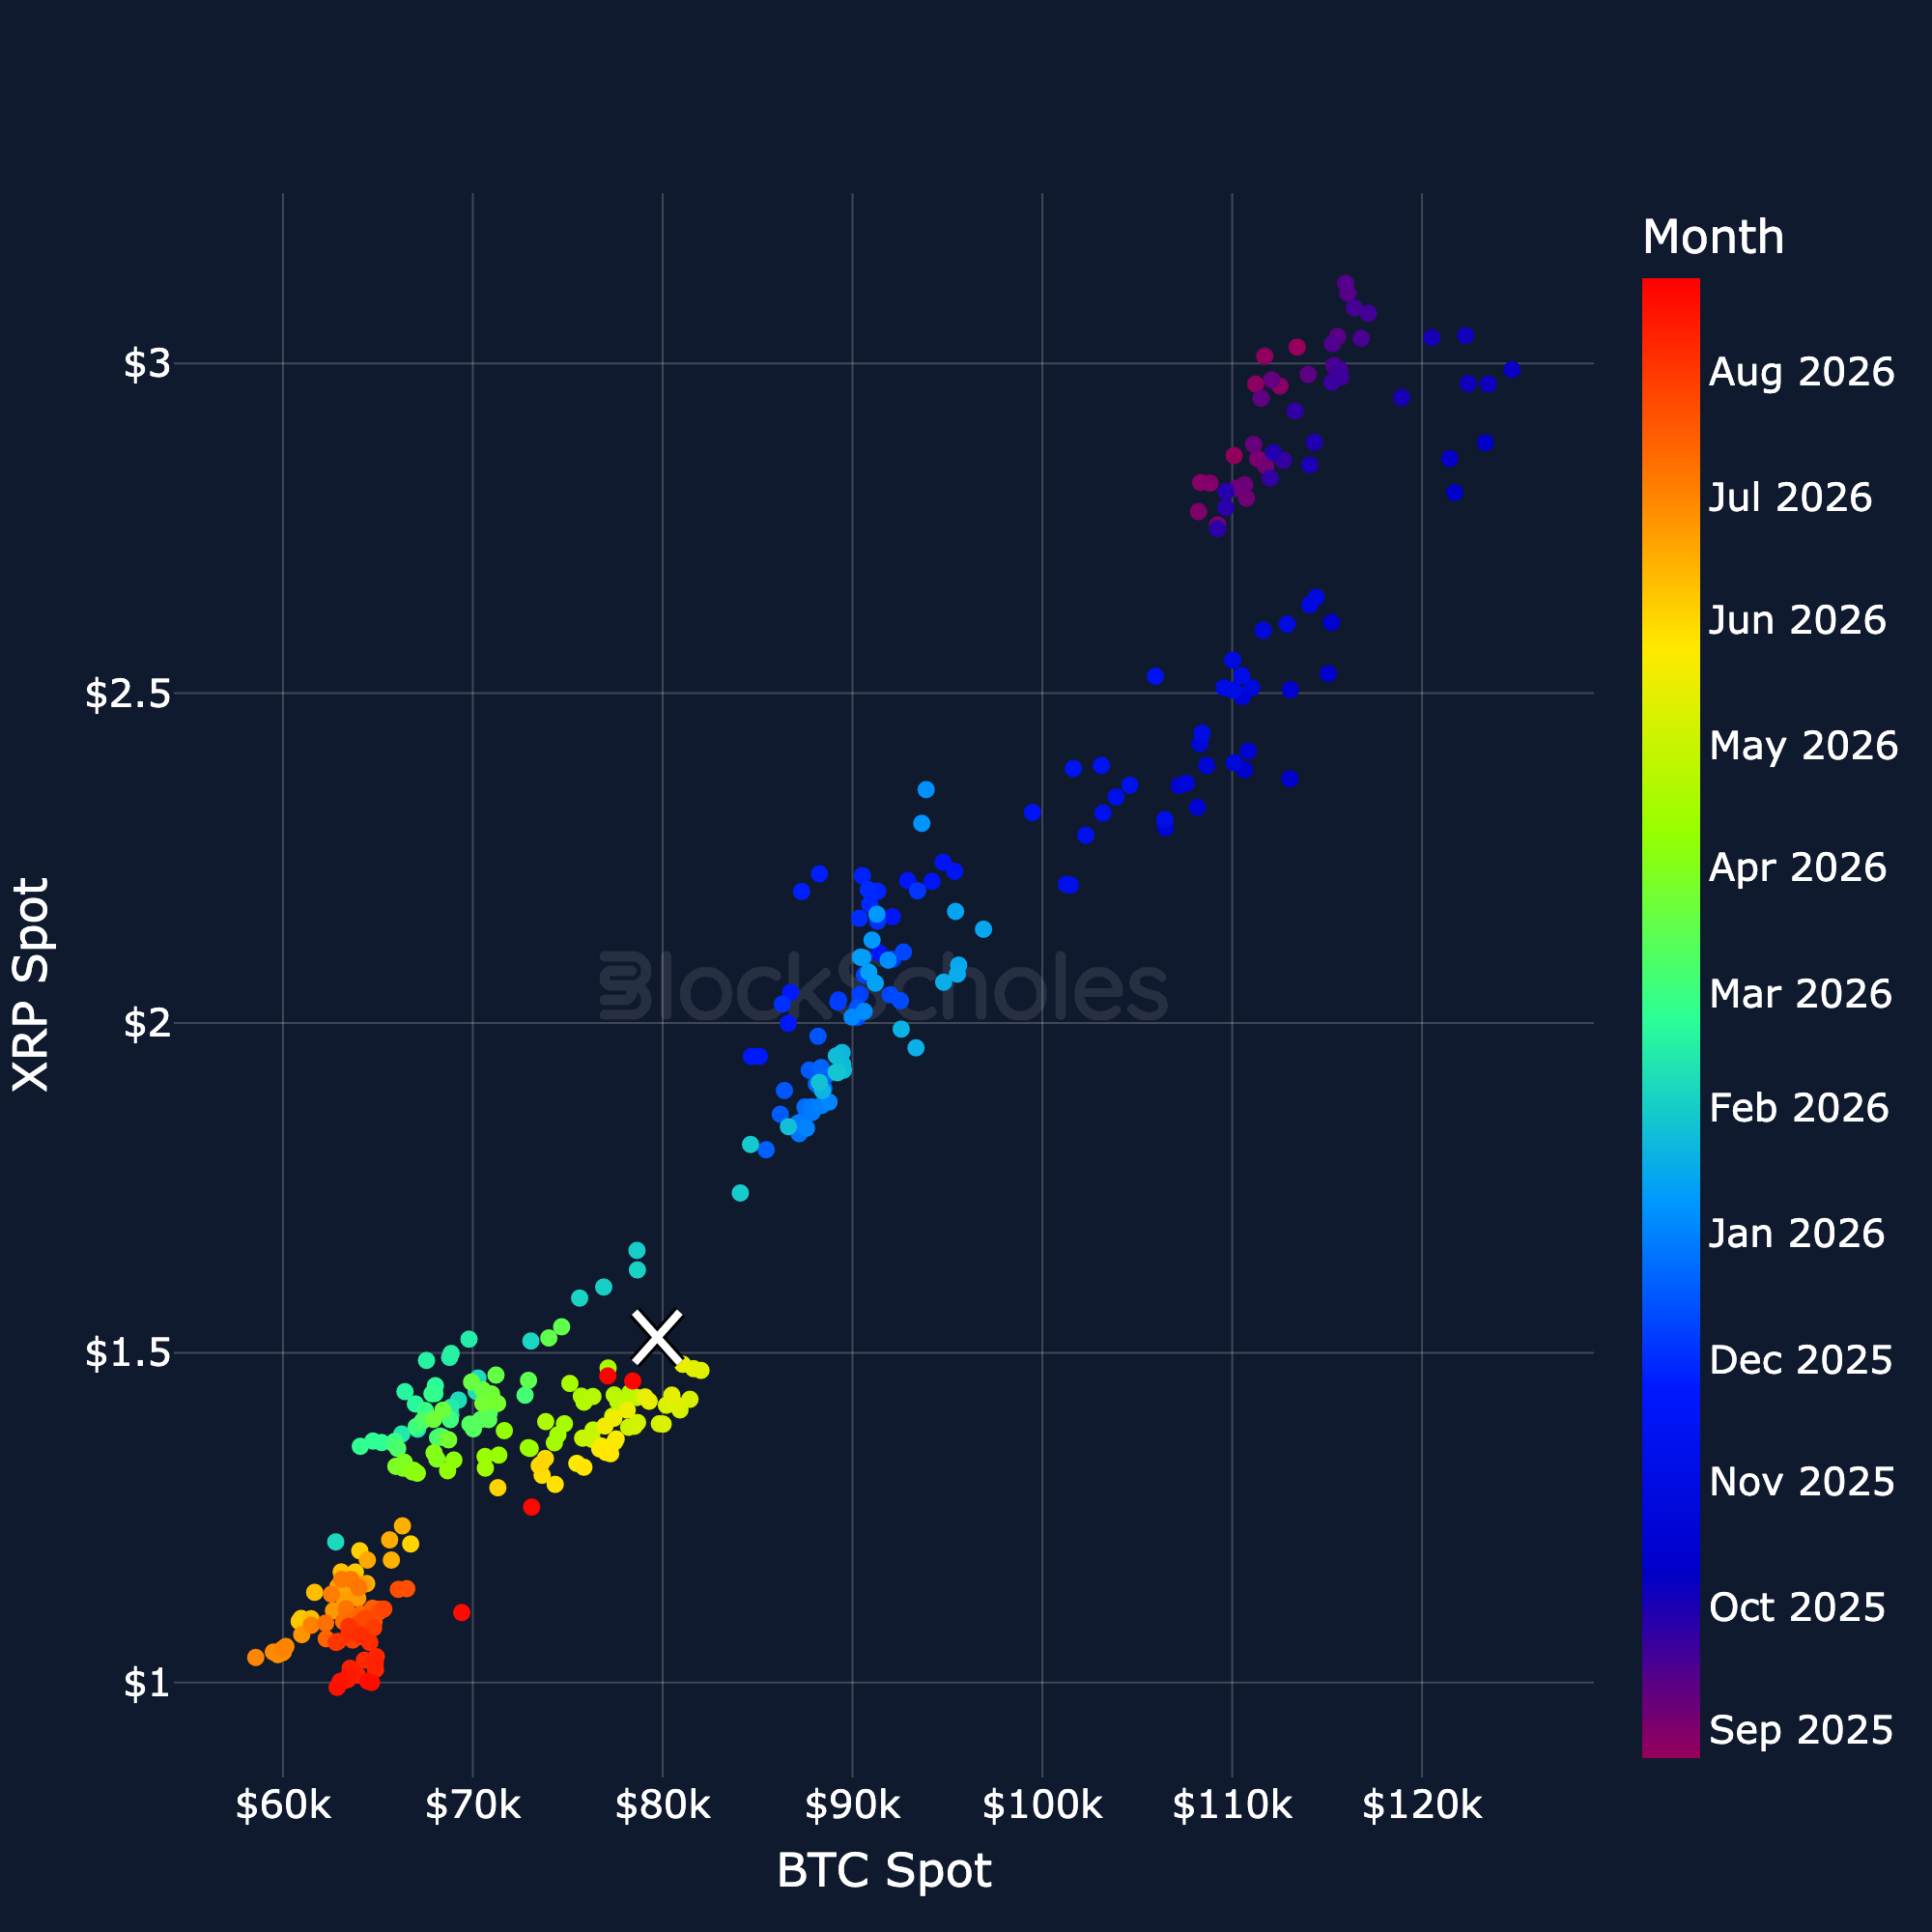
XRP Spot vs BTC Spot regression

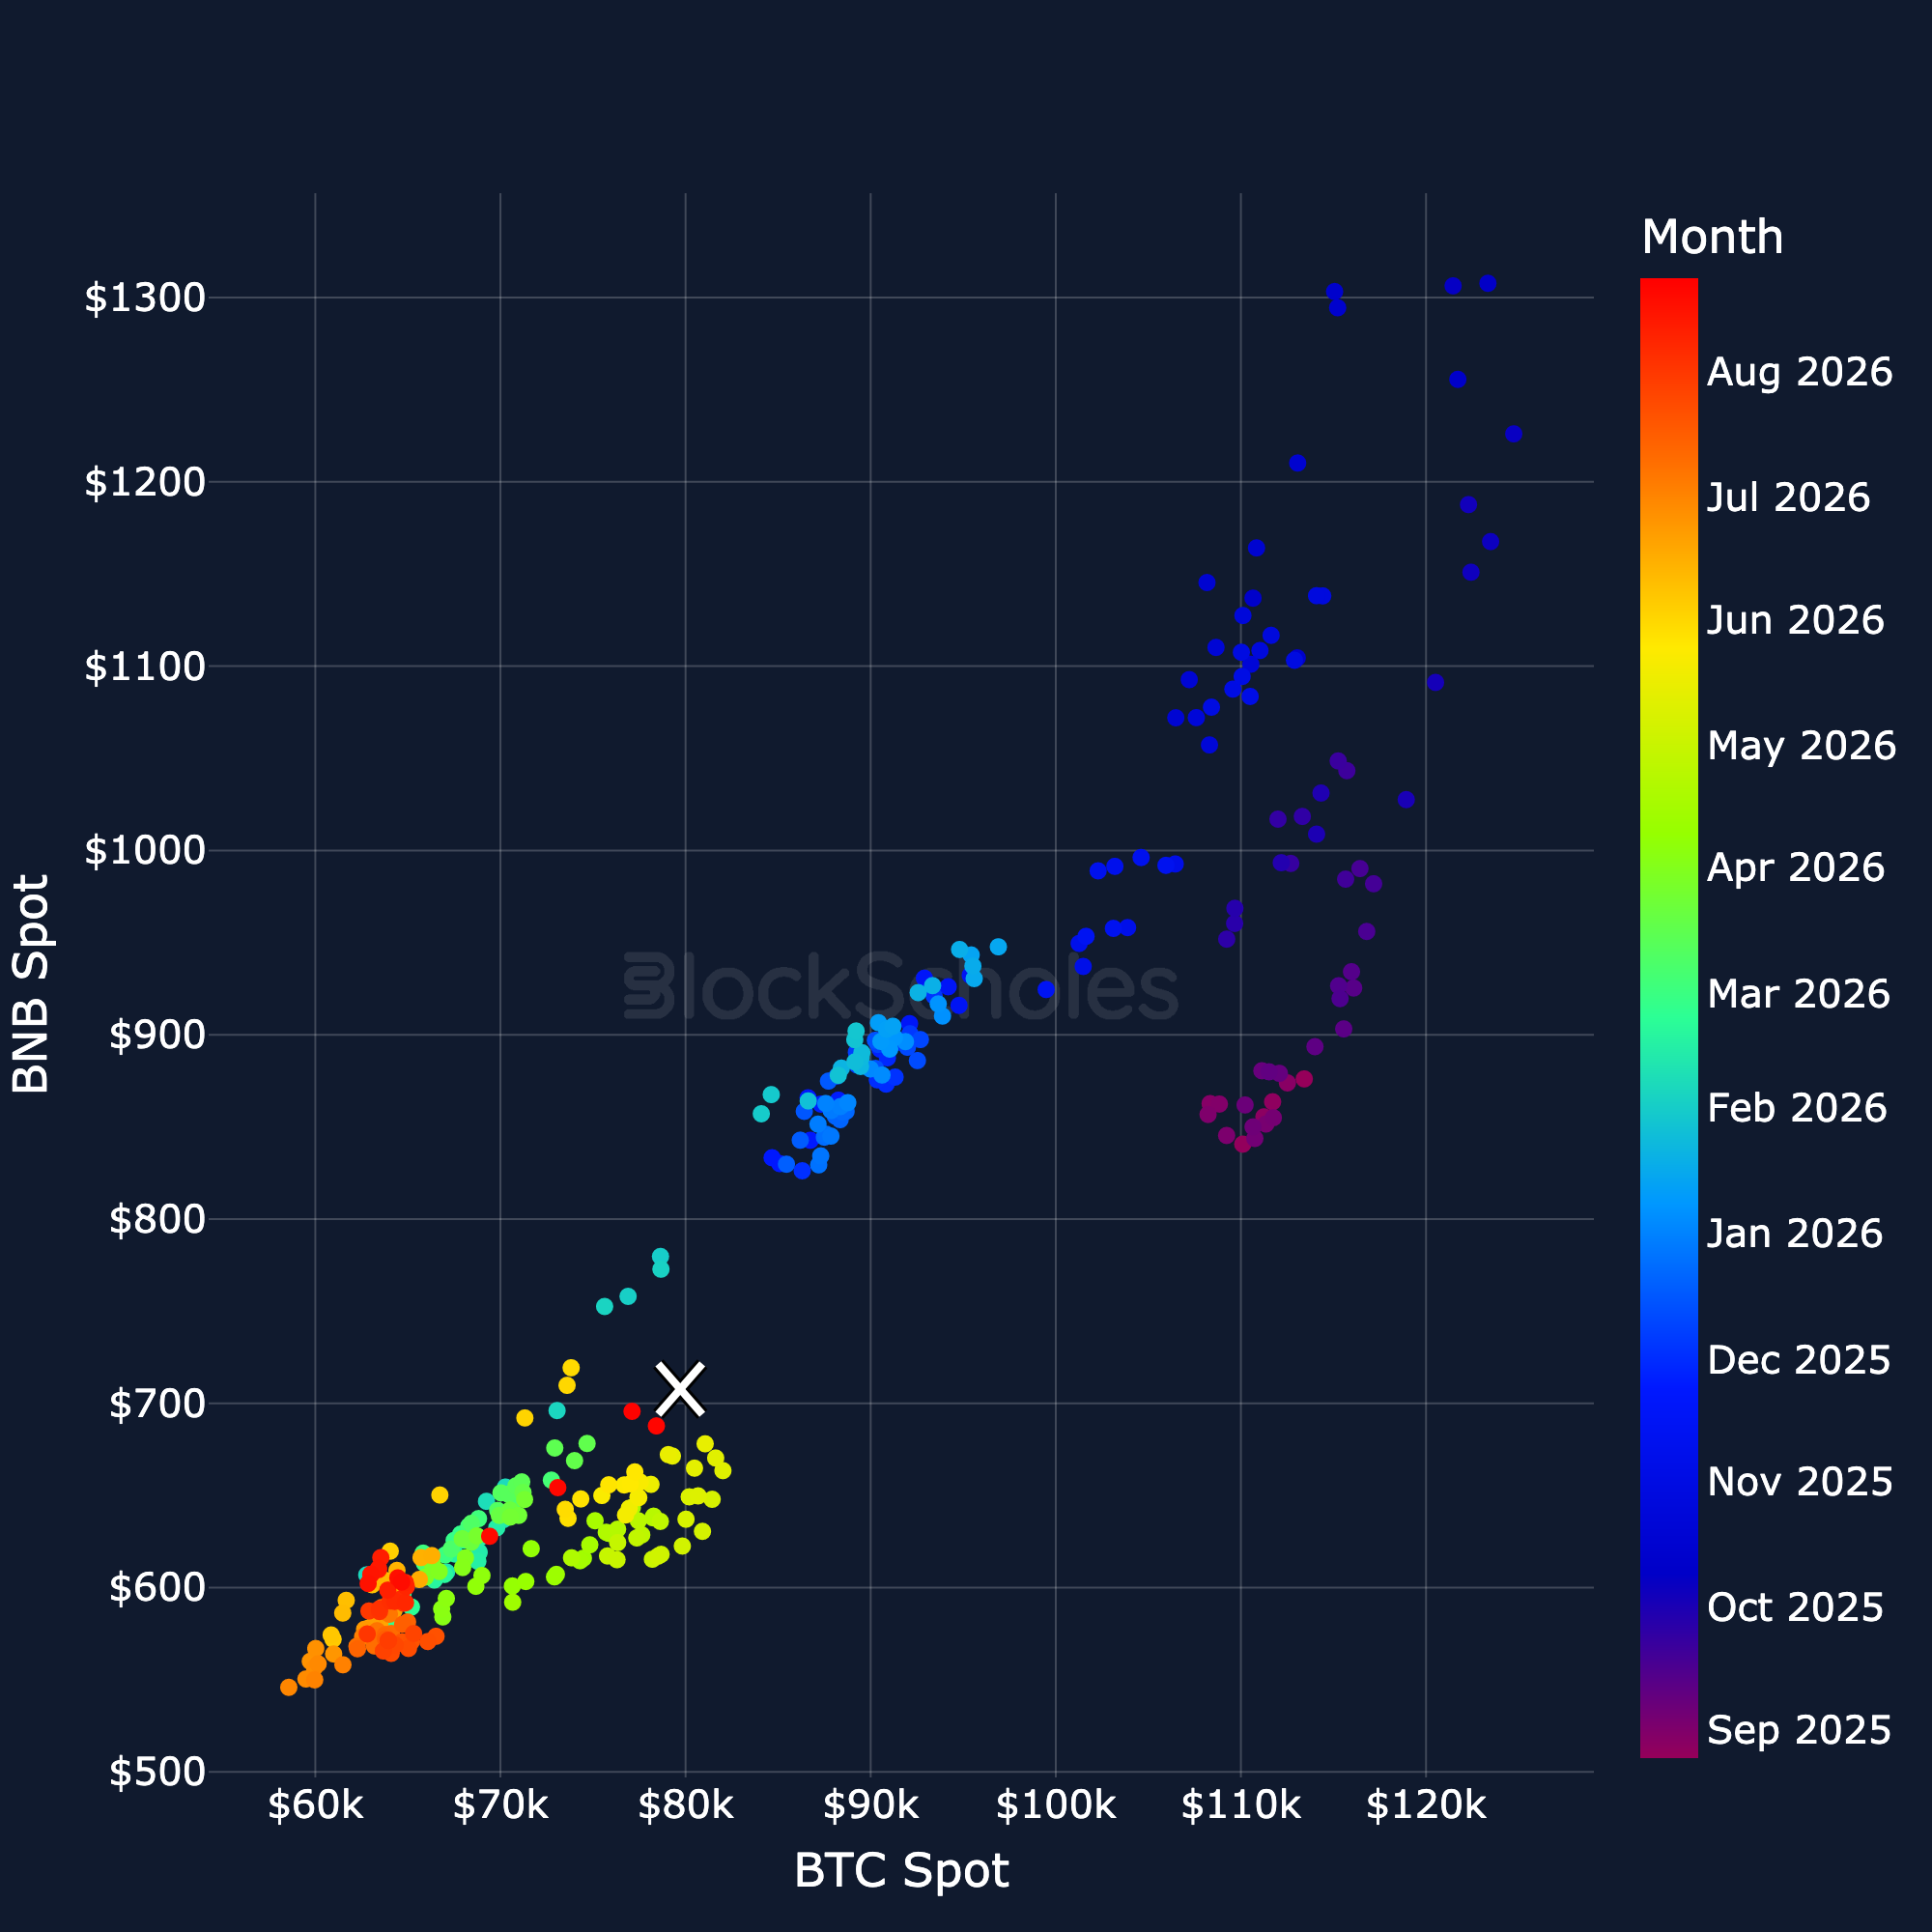
BNB Spot vs BTC Spot regression

Share this post
Copy URL
https://www.blockscholes.com/premium-research/altcoins-analytics-24th-august-2026

BTC & Altcoin Dominance

BTC Dominance

Altcoin Dominance

Altcoin Season Gauge (slow-moving by construction, 90-day lookback): % of top-50 altcoins outperforming BTC over the trailing 90 days (current constituents)

Drawdown from all-time high: BTC + top-20 altcoins by market cap

Altcoins / BTC Spot Crosses

Altcoin spot prices denominated in BTC: ETH

Altcoin spot prices denominated in BTC: SOL

Altcoin spot prices denominated in BTC: XRP

BTC & Altcoin Dominance

BTC Dominance

Altcoin Dominance

Altcoin Season Gauge (slow-moving by construction, 90-day lookback): % of top-50 altcoins outperforming BTC over the trailing 90 days (current constituents)

Drawdown from all-time high: BTC + top-20 altcoins by market cap

Altcoins / BTC Spot Crosses

Altcoin spot prices denominated in BTC: ETH

Altcoin spot prices denominated in BTC: SOL

Altcoin spot prices denominated in BTC: XRP