Back to Research
Last Updated:  
September 14, 2026
6 Minutes

Altcoins Analytics 14th September 2026

This week's edition of our Crypto Altcoins Analytics.

BTC & Altcoin Dominance

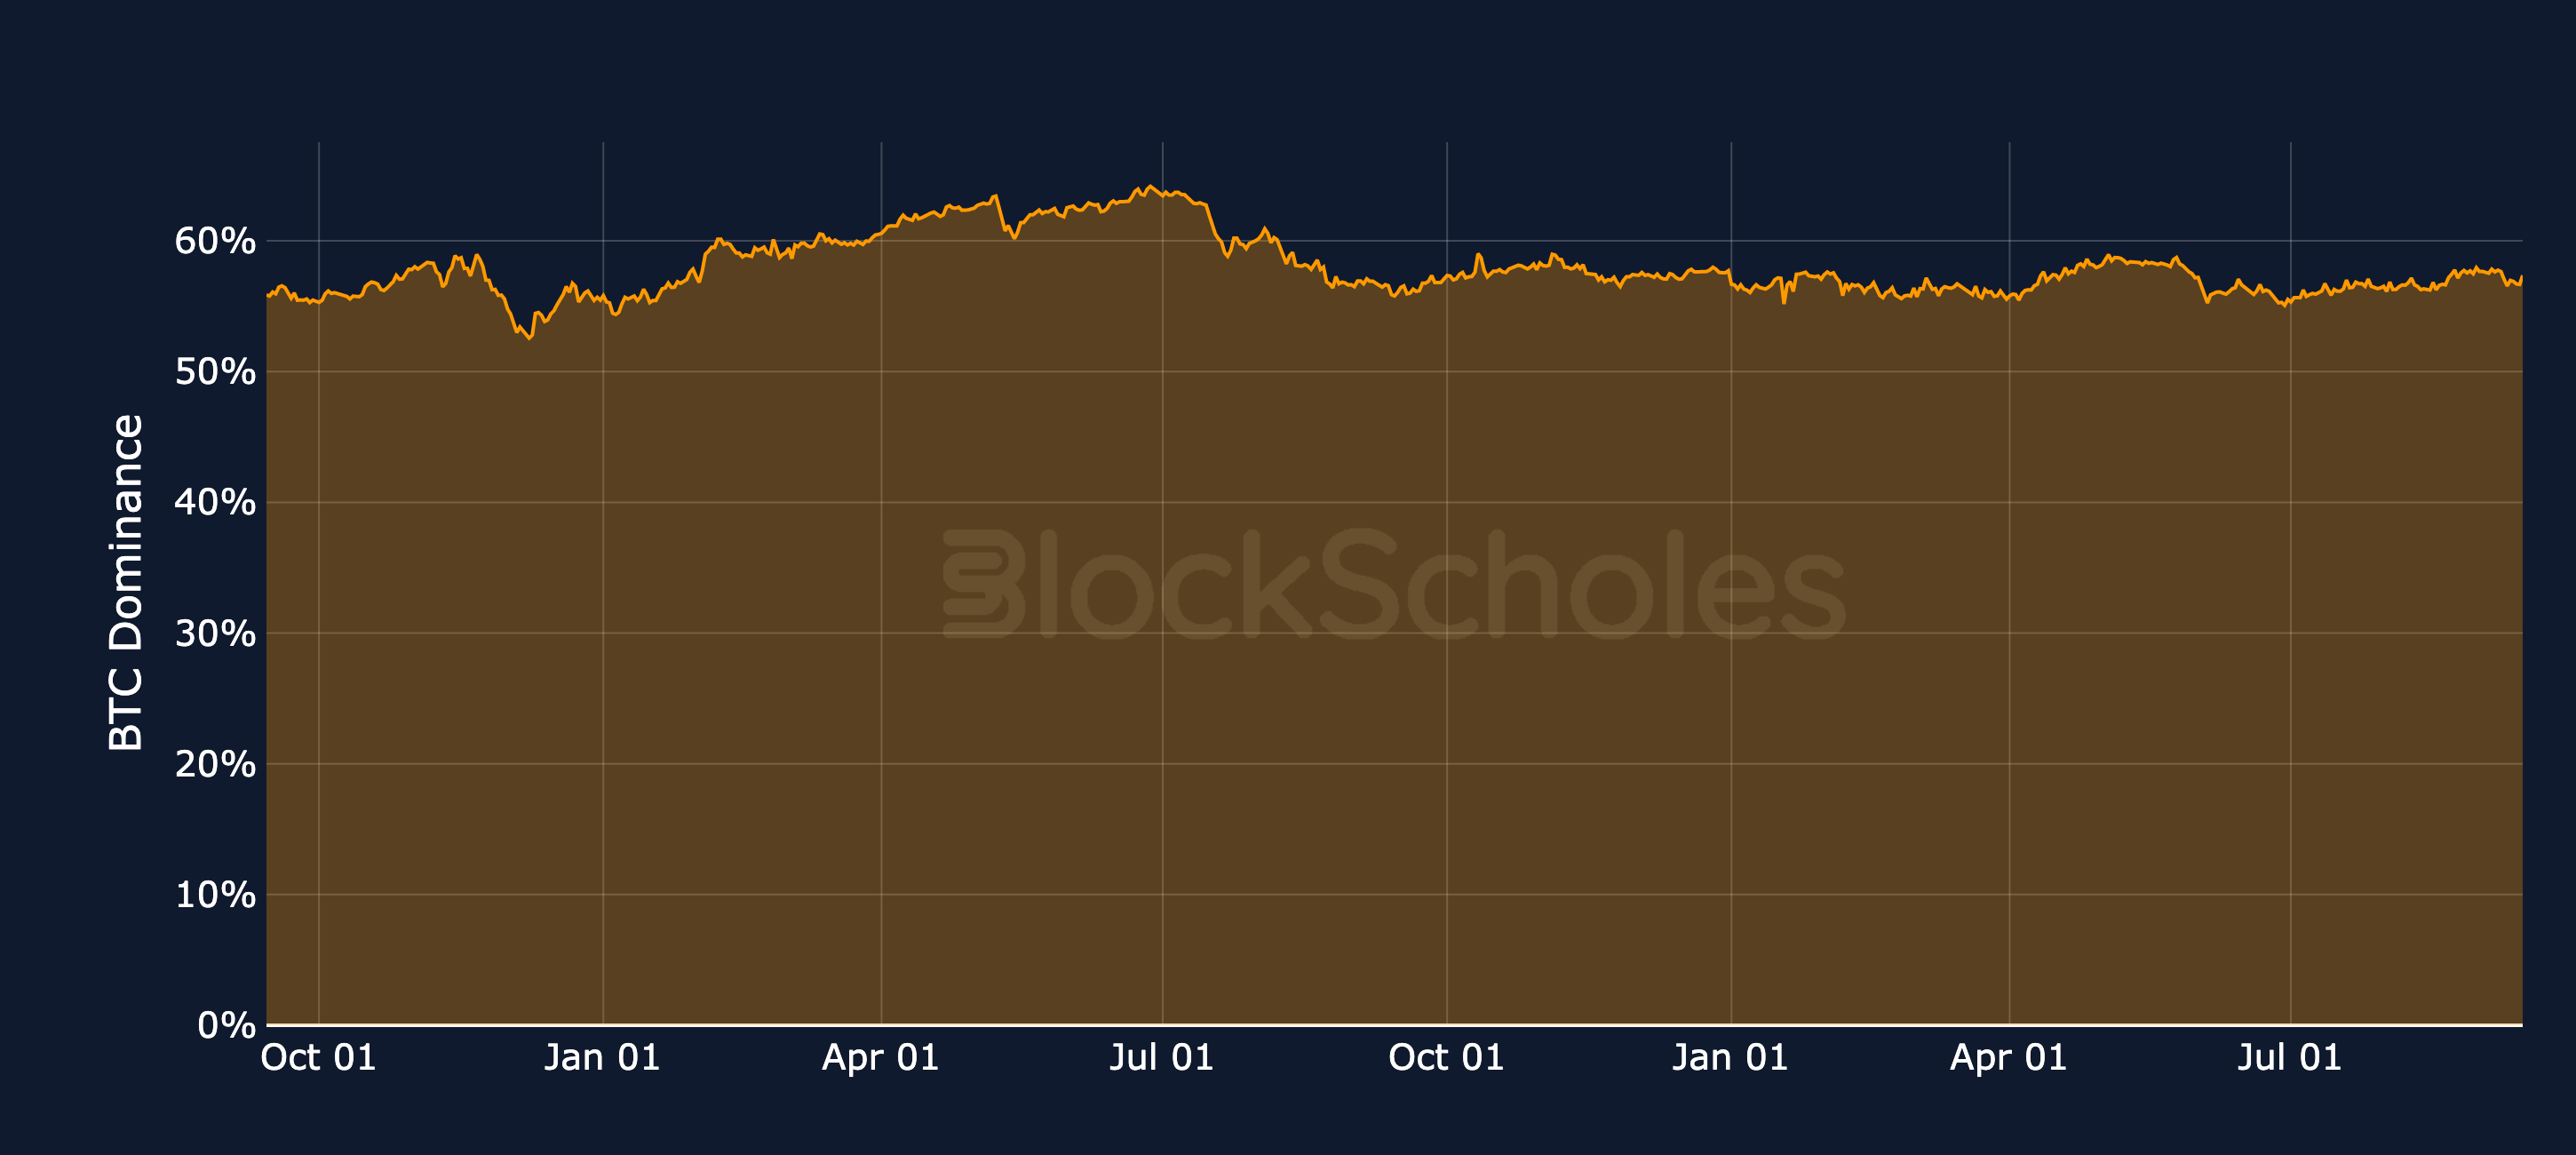
BTC Dominance

Figure 1. Bitcoin's market capitalisation as a share of the total crypto market capitalisation. Source: CoinGecko, Block Scholes.
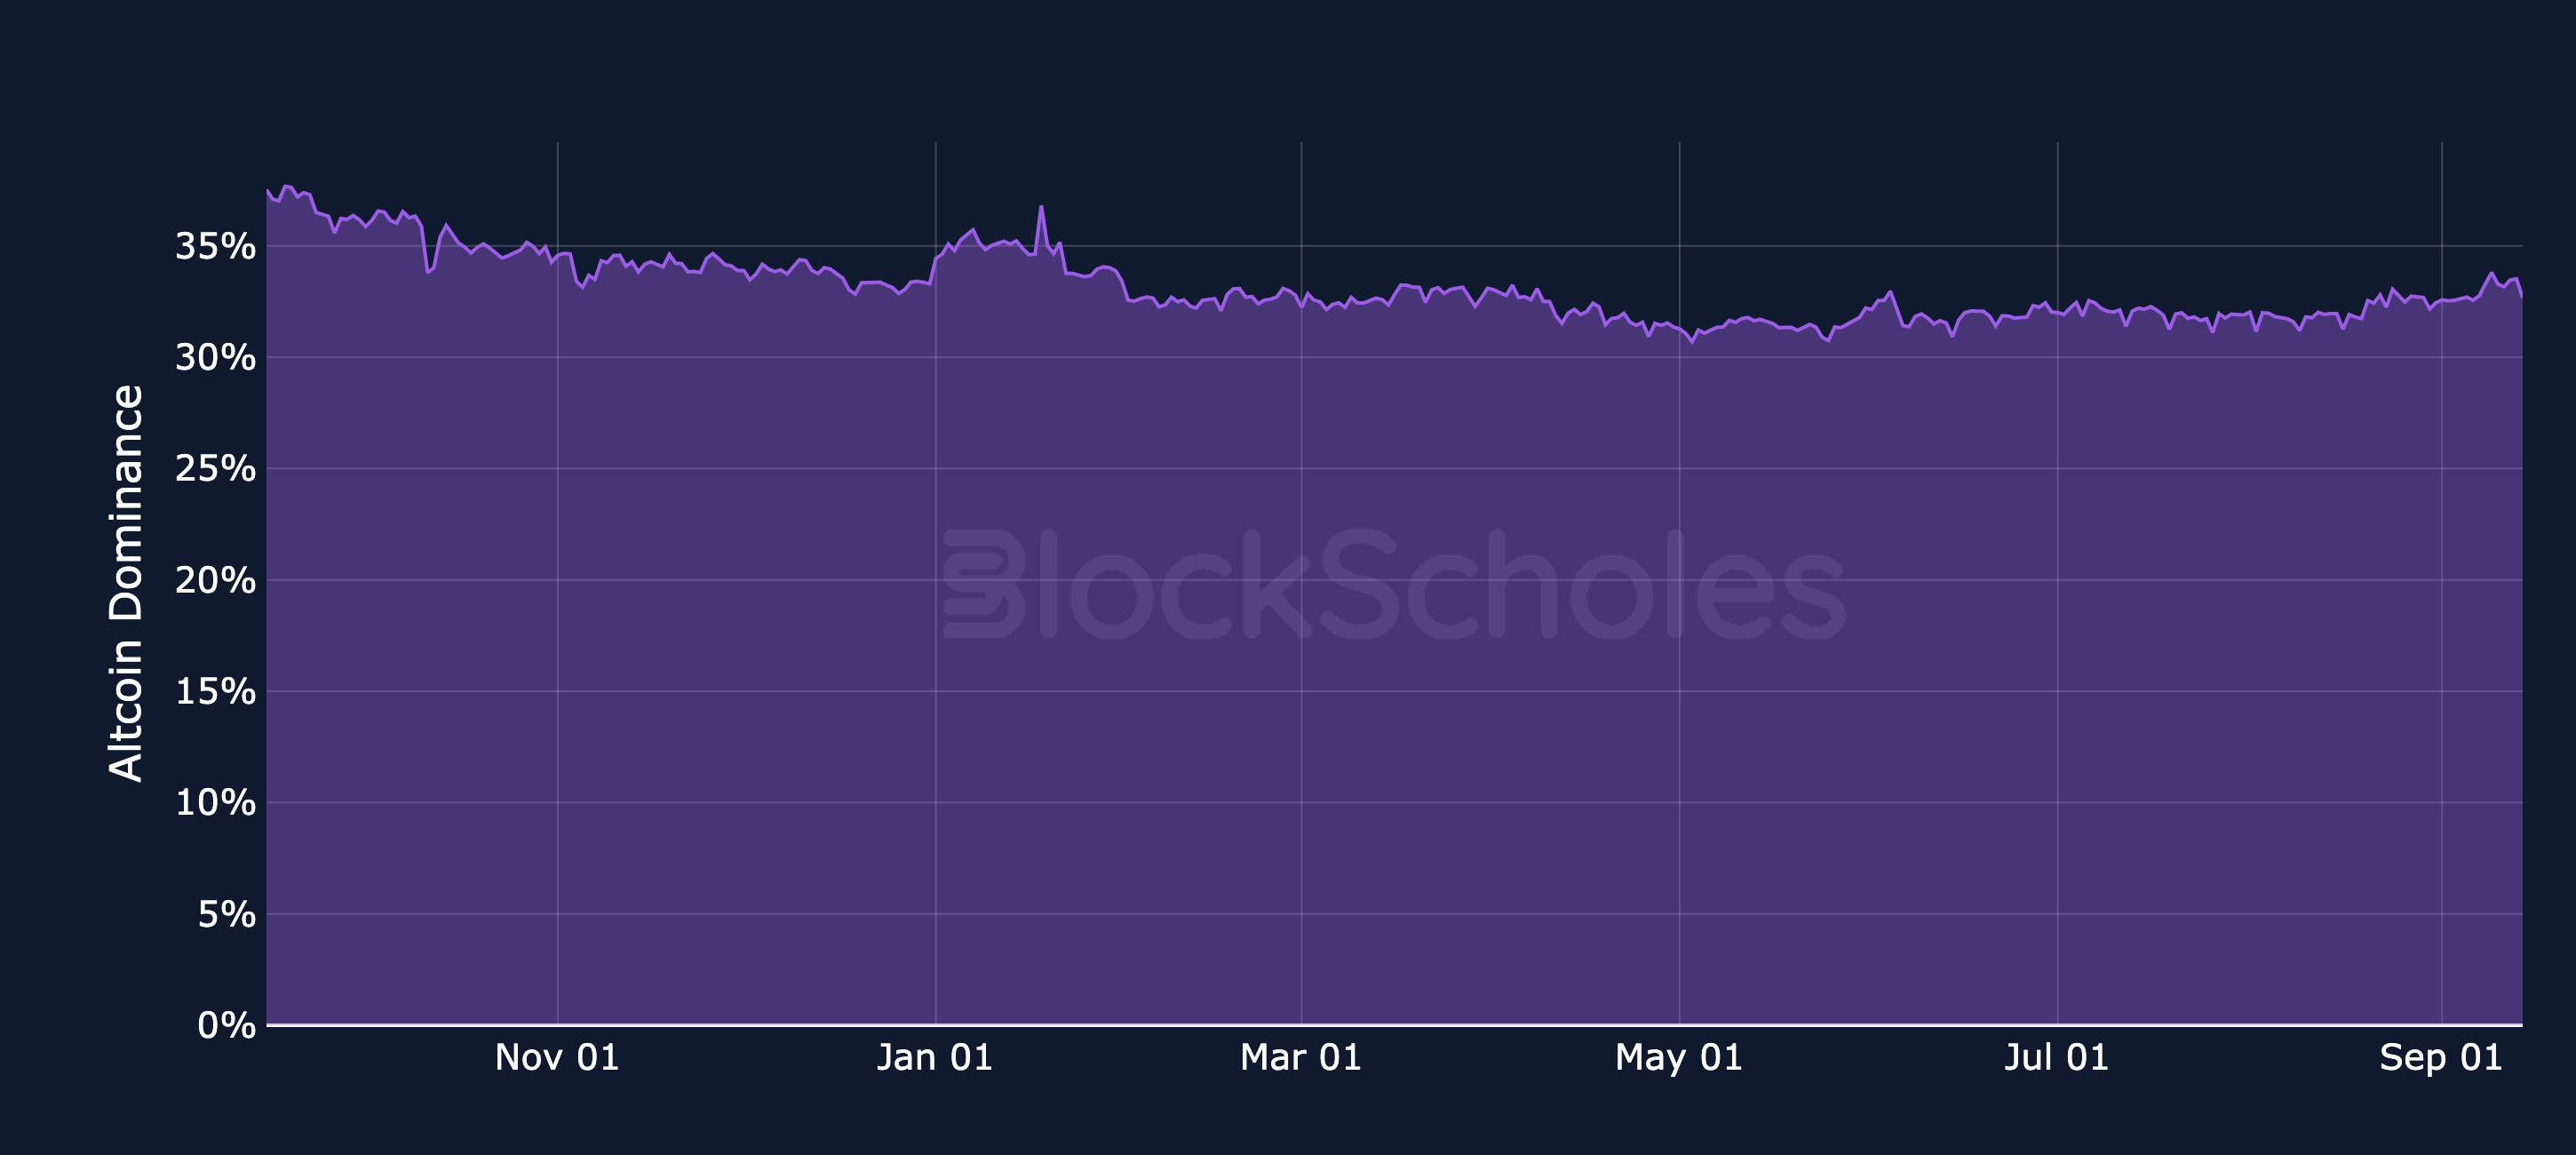
Figure 1. Bitcoin's market capitalisation as a share of the total crypto market capitalisation. Source: CoinGecko, Block Scholes.

Altcoin Dominance

Figure 2. Market capitalisation of altcoins, excluding BTC and stablecoins, as a share of the total crypto market capitalisation. Source: CoinGecko, Block Scholes.
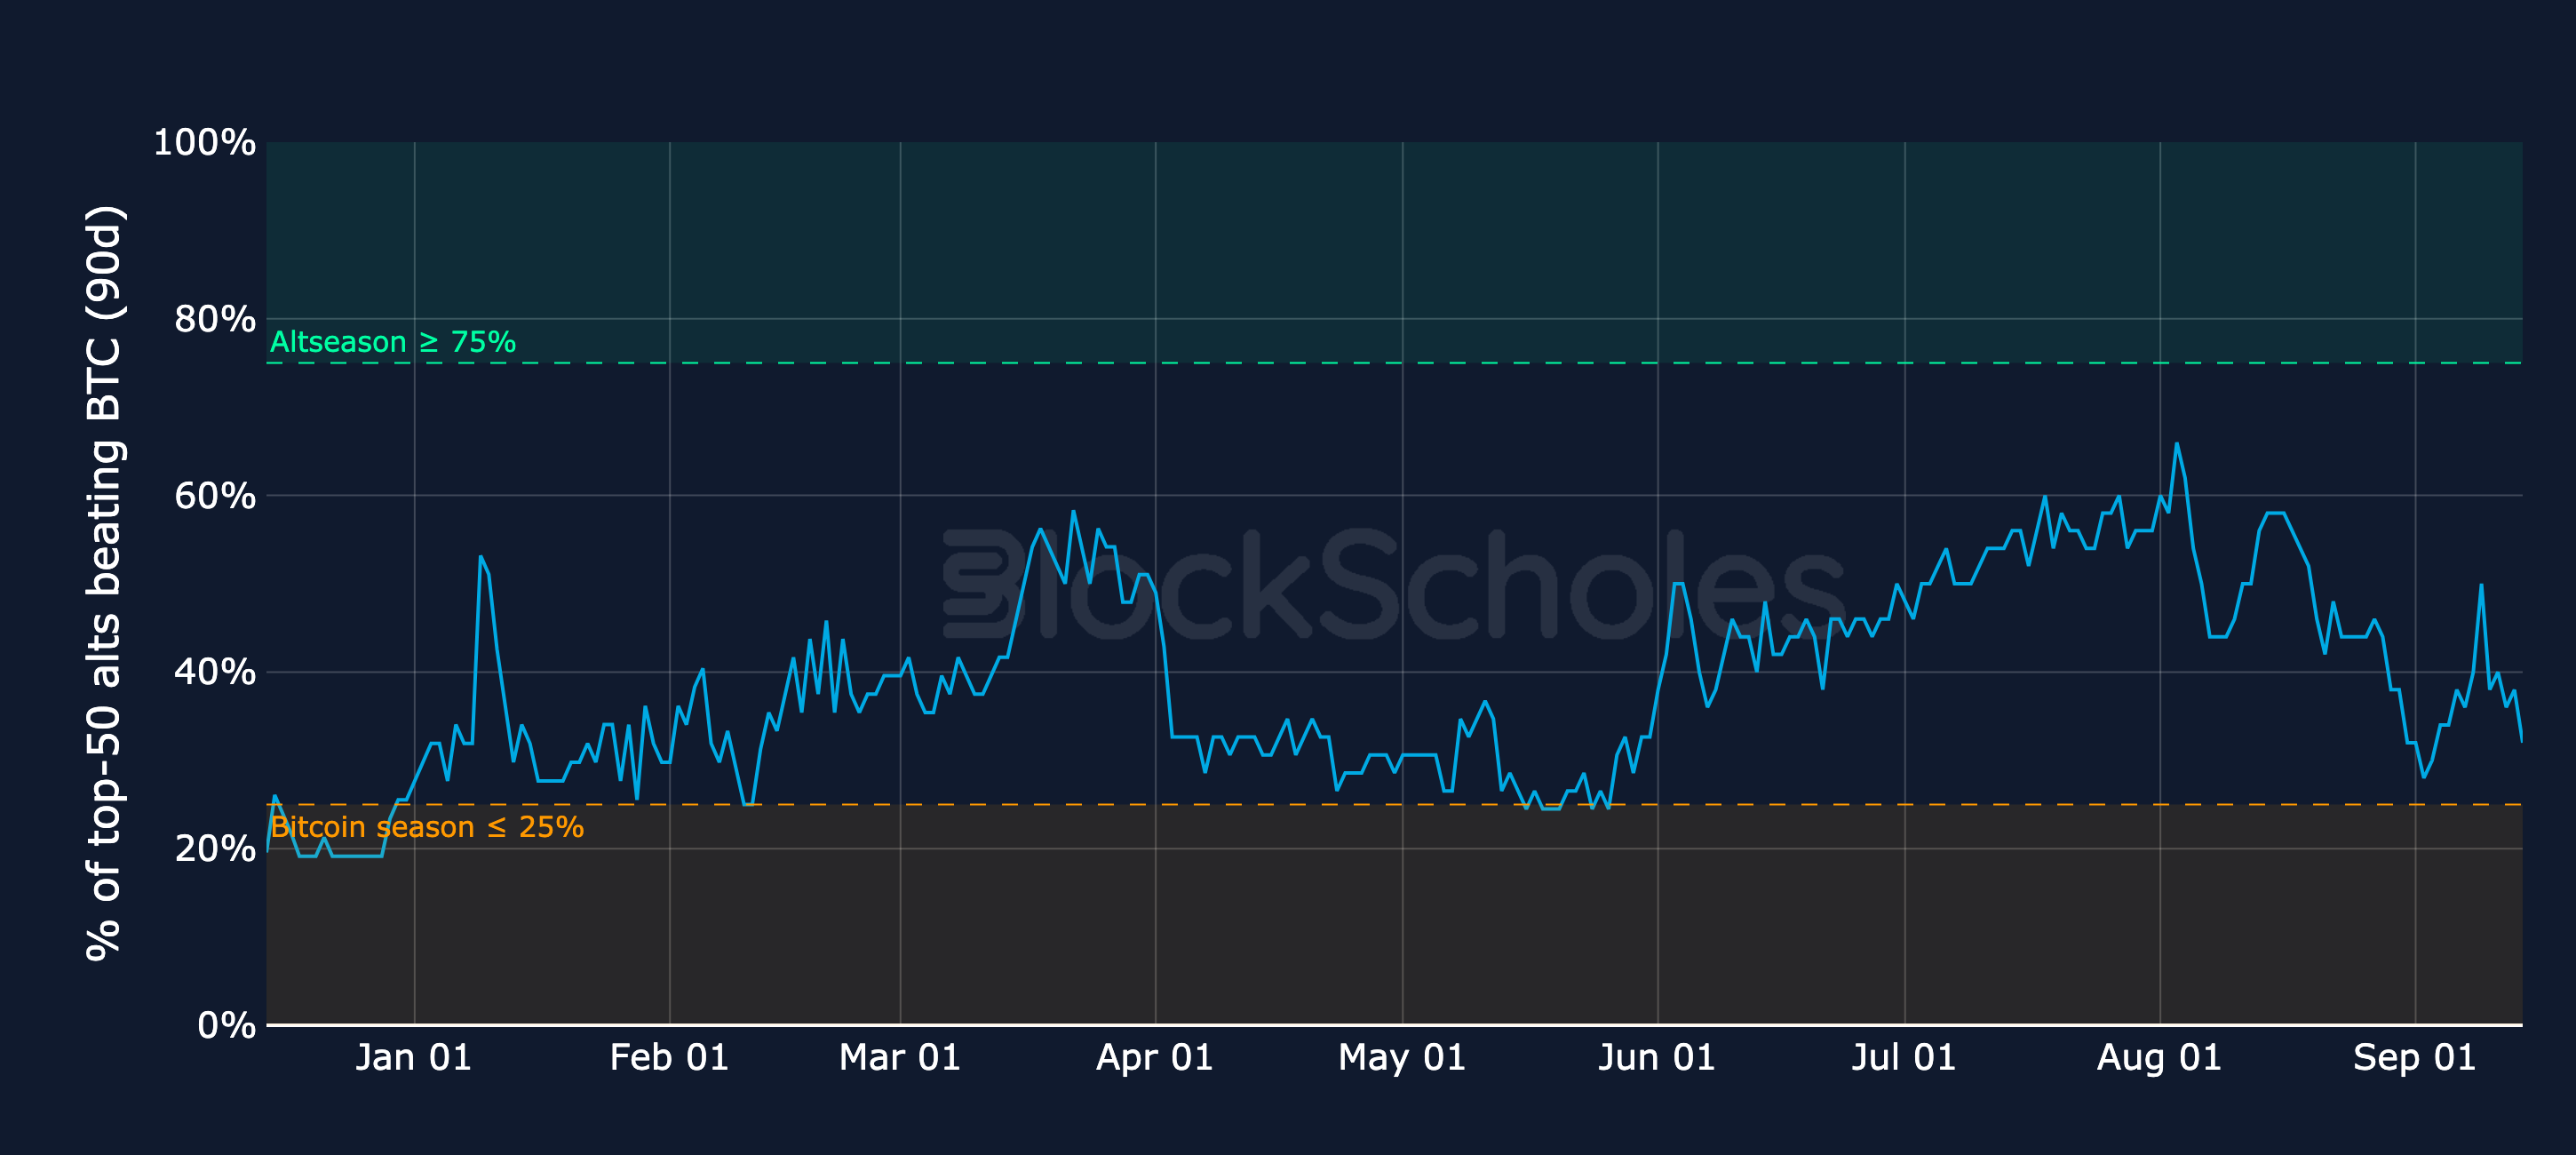
Figure 2. Market capitalisation of altcoins, excluding BTC and stablecoins, as a share of the total crypto market capitalisation. Source: CoinGecko, Block Scholes.

Altcoin Season Gauge (90-day lookback)

Figure 3. Share of the top-50 altcoins (current constituents) whose trailing 90-day return beats BTC's; slow-moving by construction. Source: CoinGecko, Block Scholes.
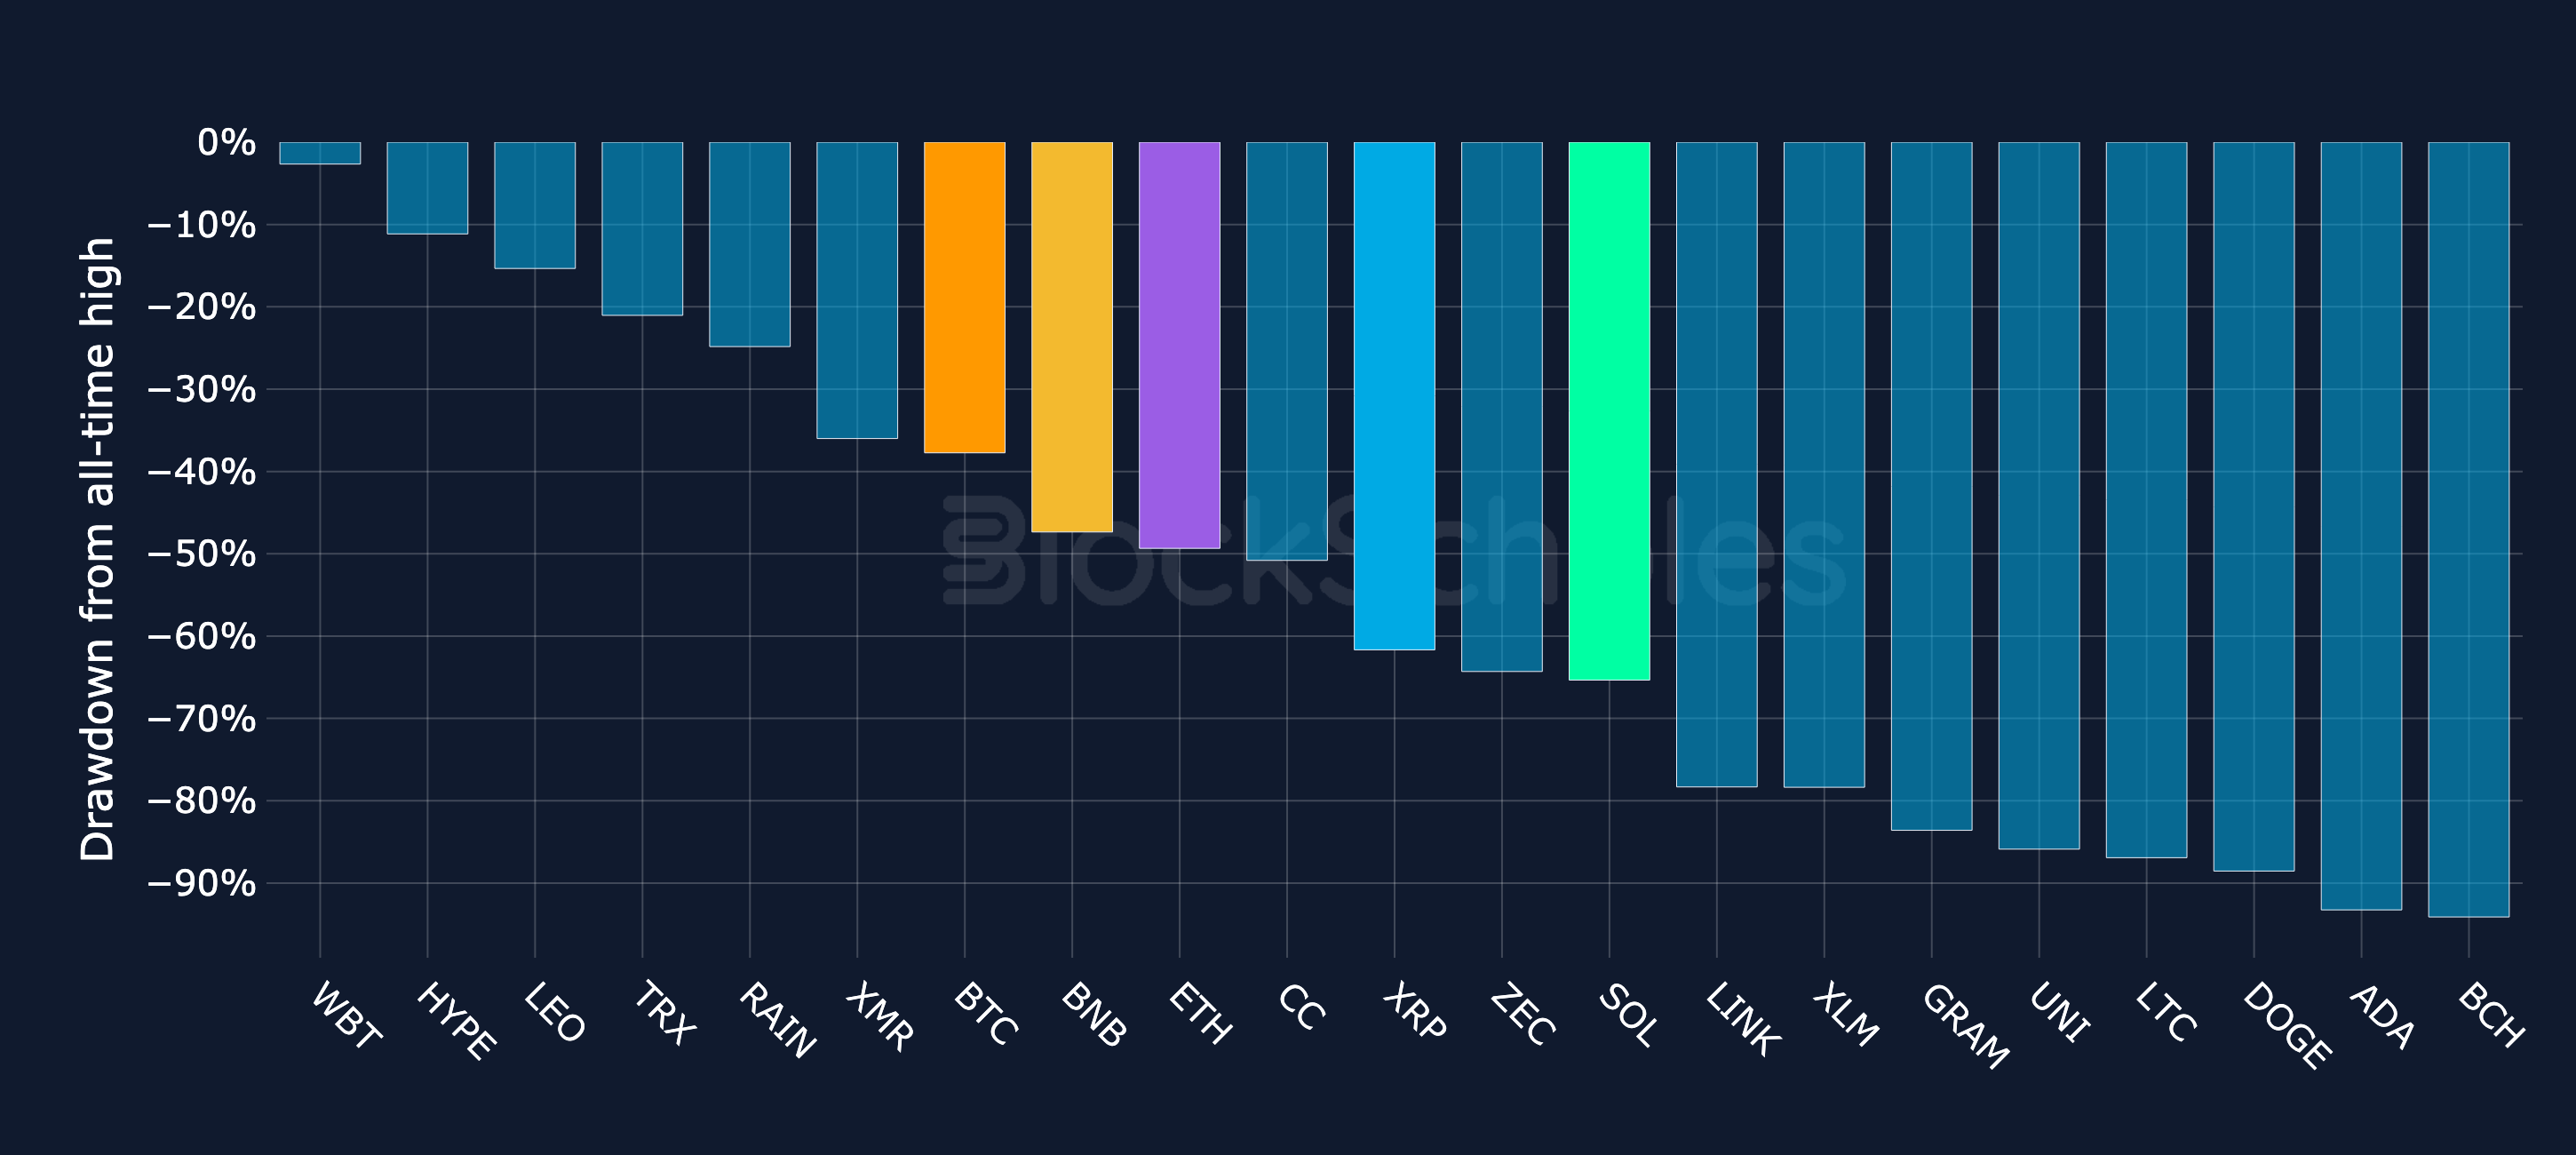
Figure 3. Share of the top-50 altcoins (current constituents) whose trailing 90-day return beats BTC's; slow-moving by construction. Source: CoinGecko, Block Scholes.

Drawdown from all-time high: BTC + top-20 altcoins by market cap

Figure 4. Percentage drawdown from each asset's all-time high for BTC and the top-20 altcoins by market cap. Source: CoinGecko, Block Scholes.
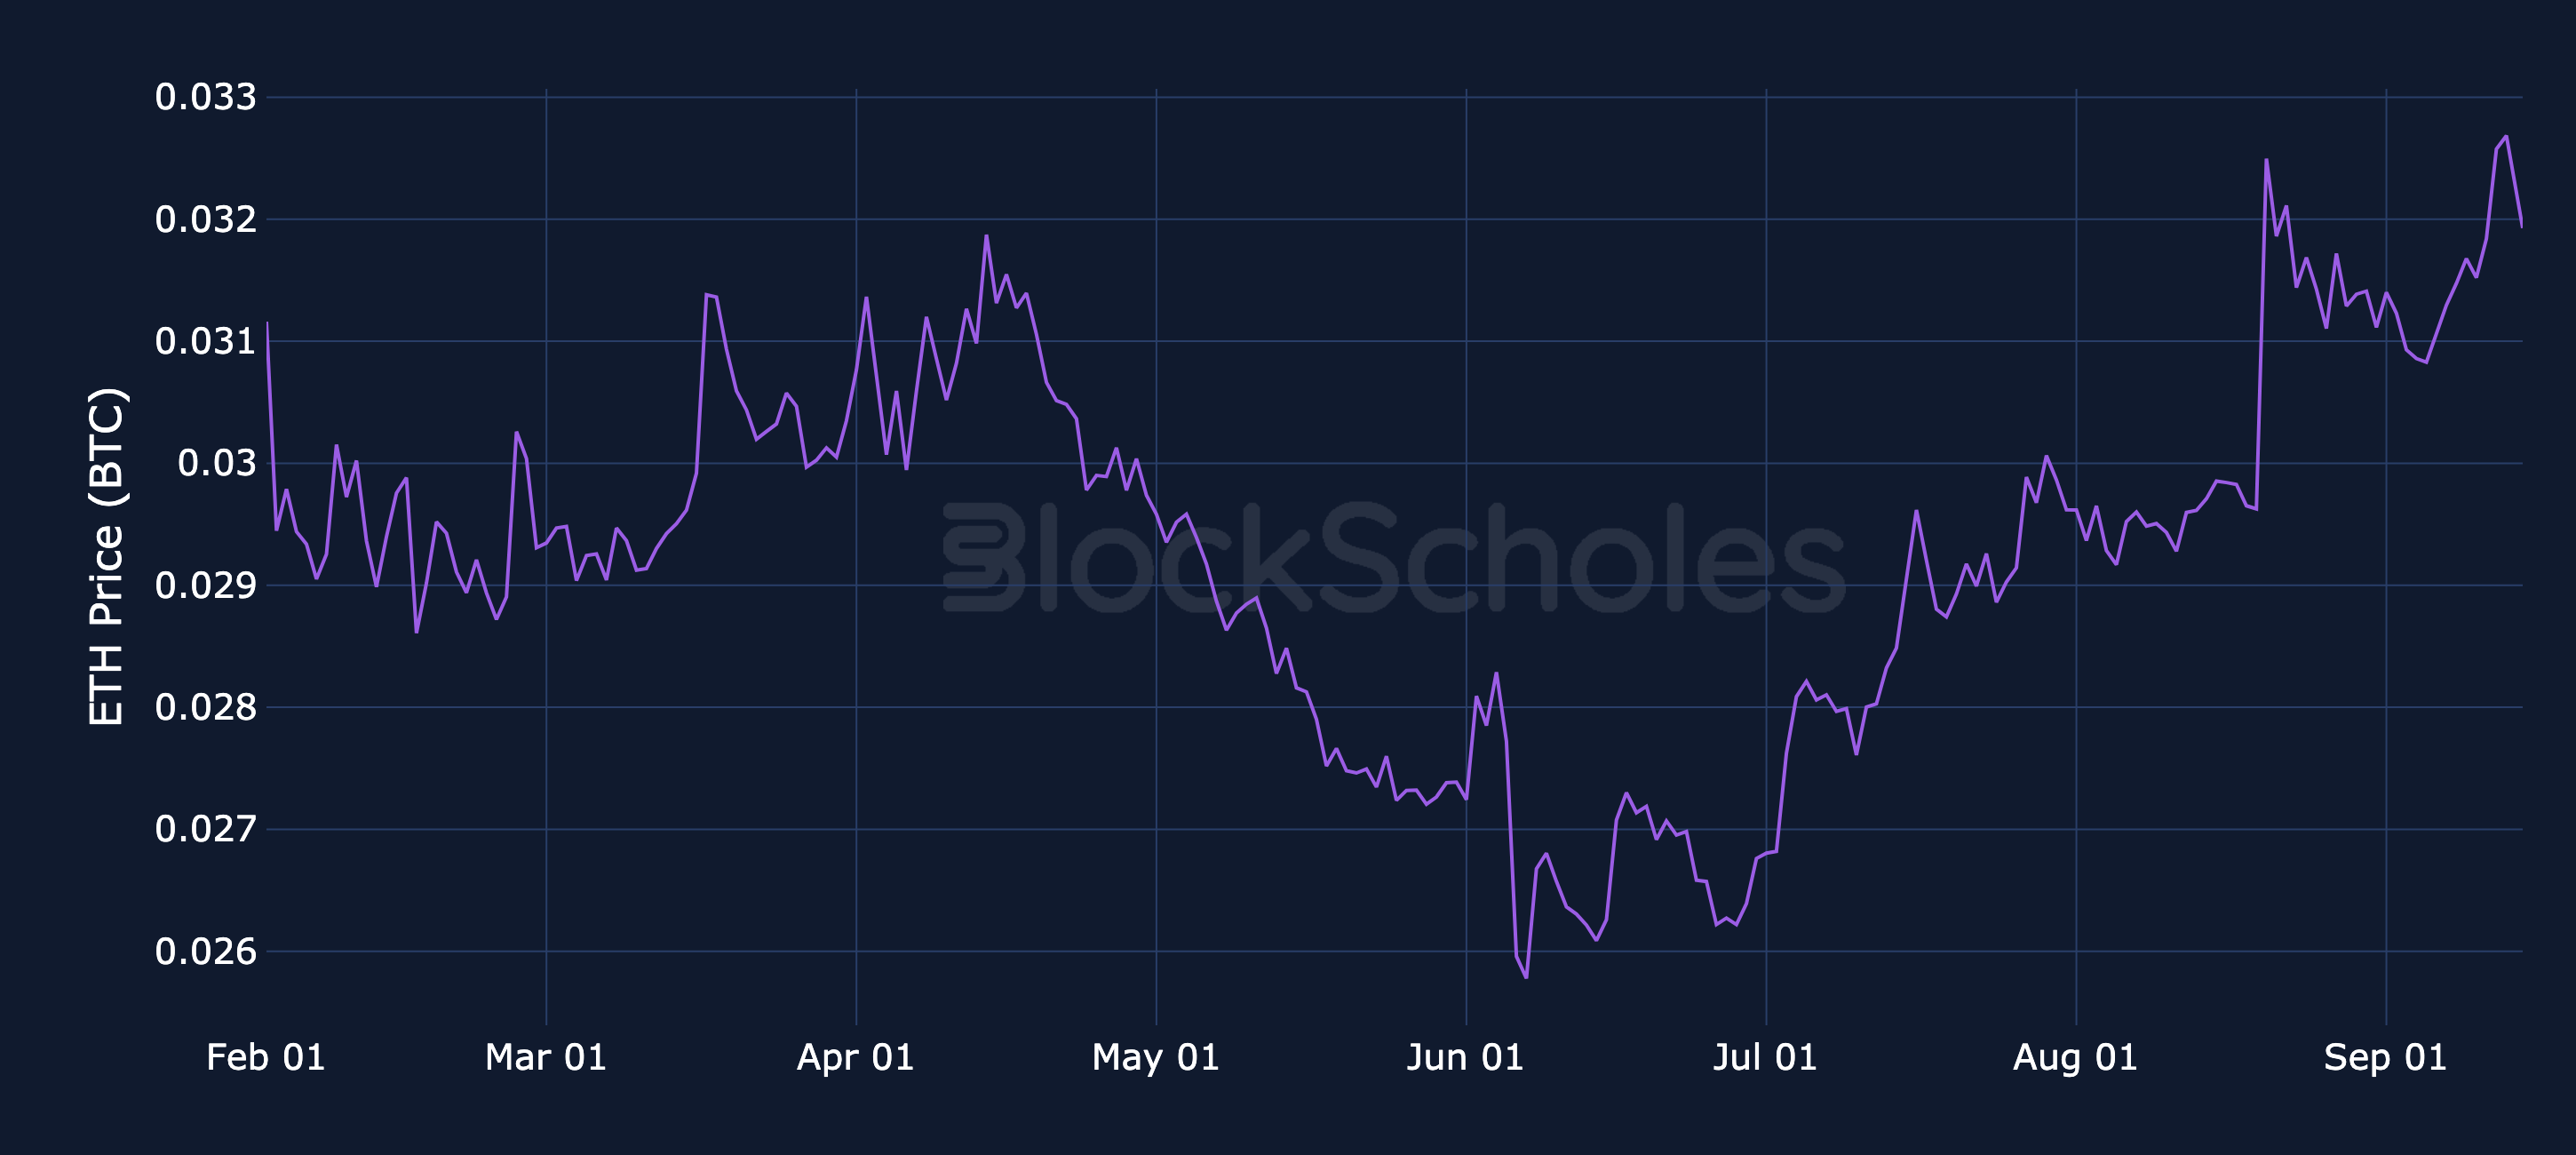
Figure 4. Percentage drawdown from each asset's all-time high for BTC and the top-20 altcoins by market cap. Source: CoinGecko, Block Scholes.

Altcoins / BTC Spot Crosses

Altcoin spot prices denominated in BTC: ETH

Figure 5. ETH spot price denominated in BTC (the ETH/BTC cross). Source: CoinGecko, Block Scholes.
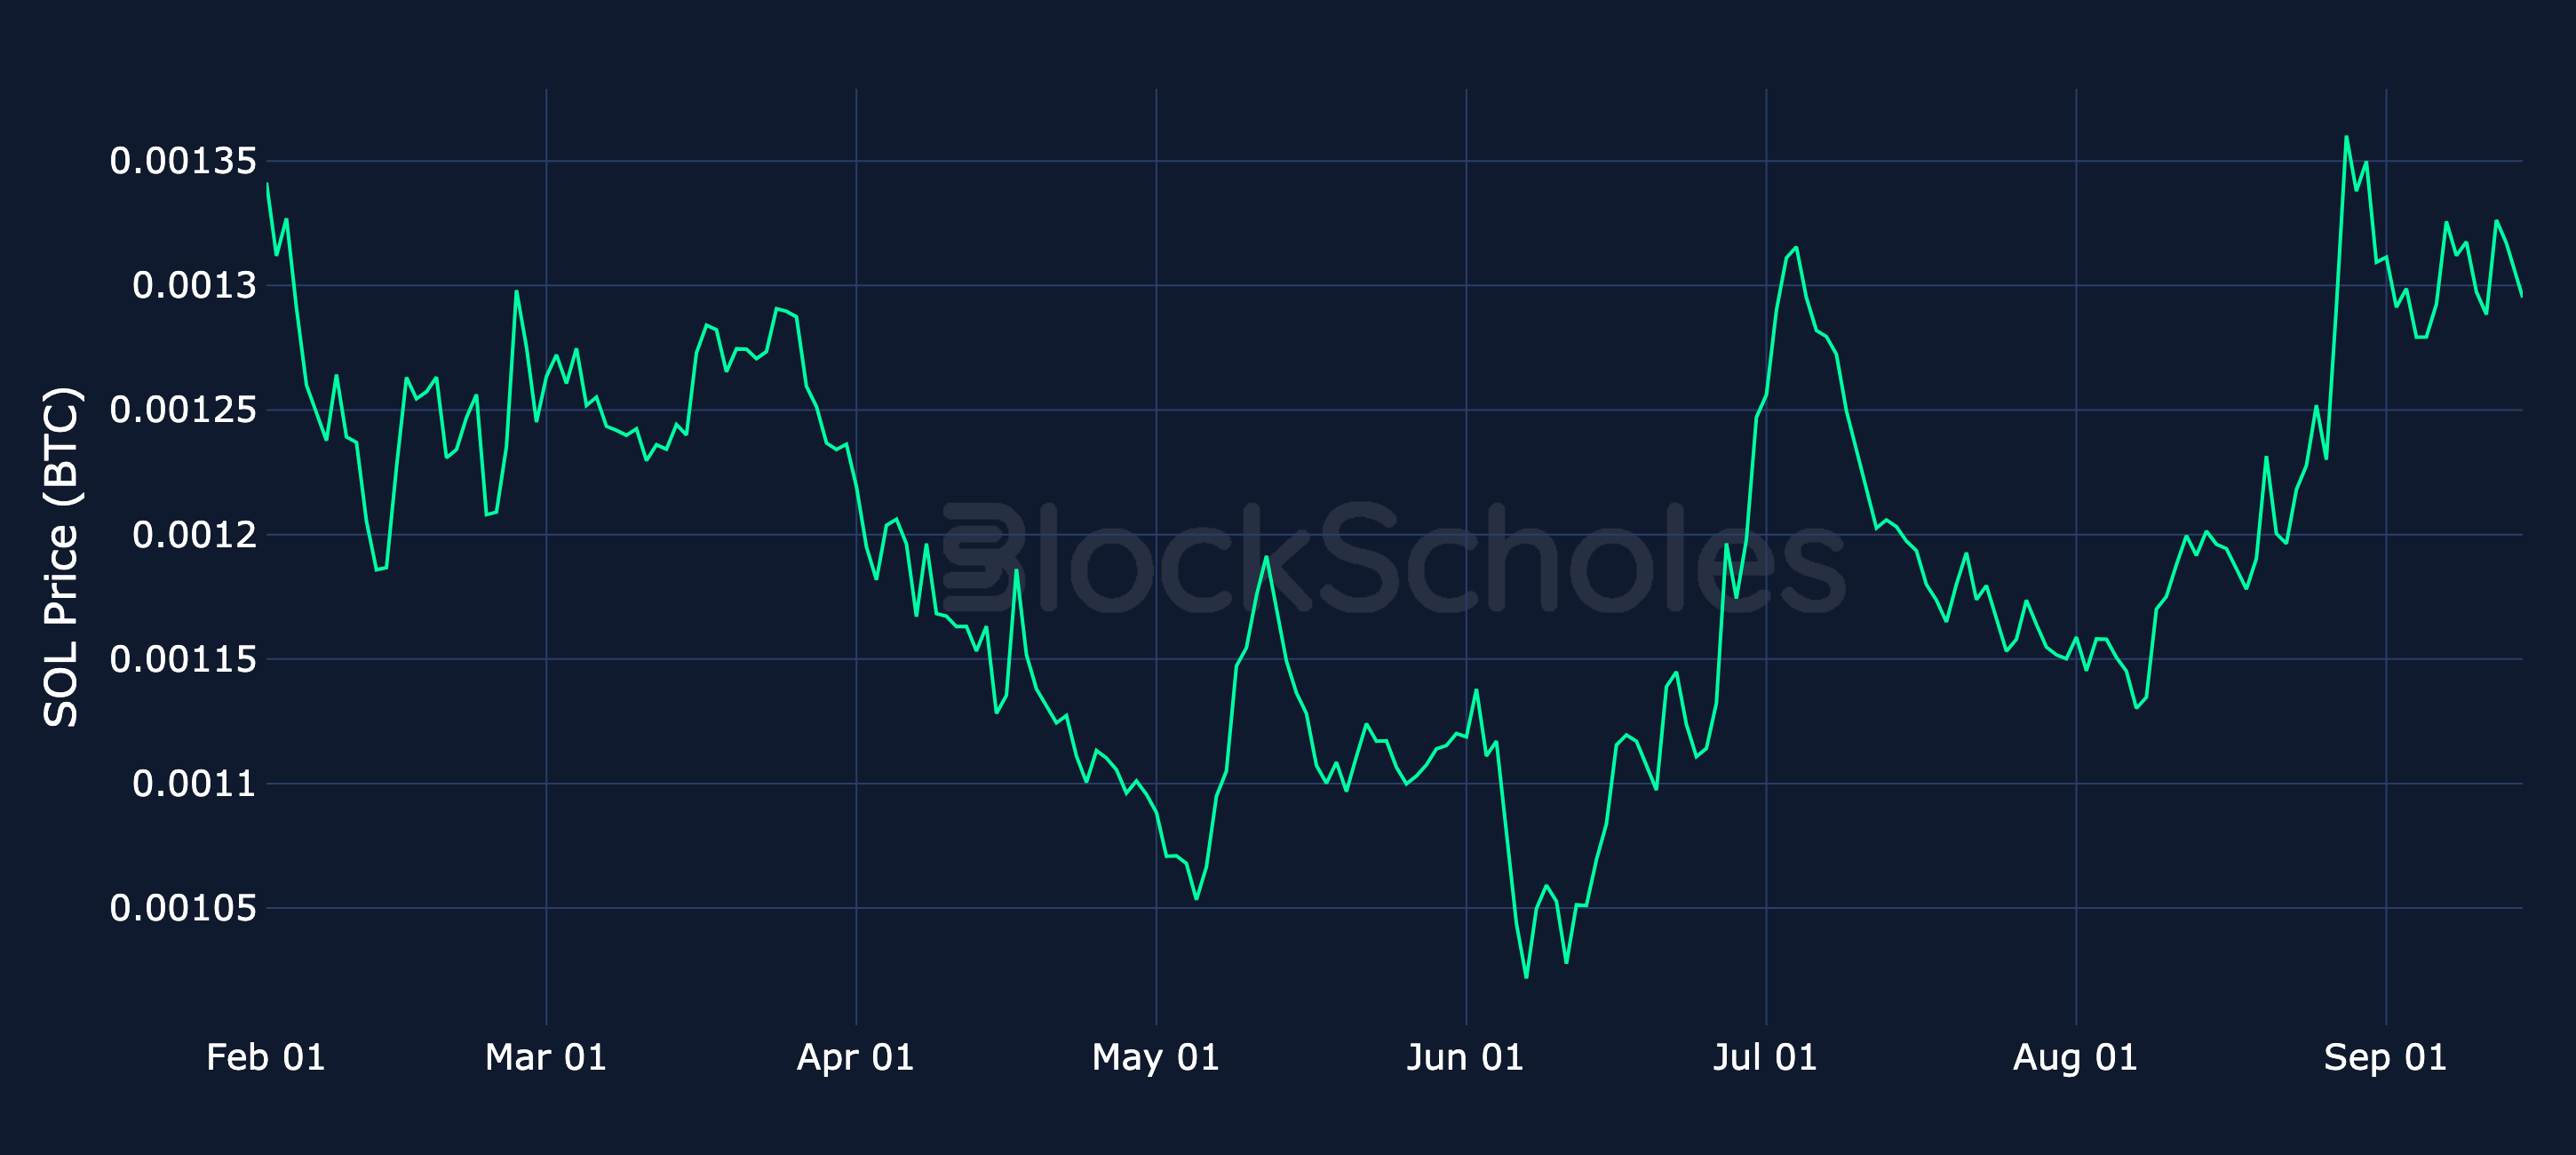
Figure 5. ETH spot price denominated in BTC (the ETH/BTC cross). Source: CoinGecko, Block Scholes.

Altcoin spot prices denominated in BTC: SOL

Figure 6. SOL spot price denominated in BTC (the SOL/BTC cross). Source: CoinGecko, Block Scholes.
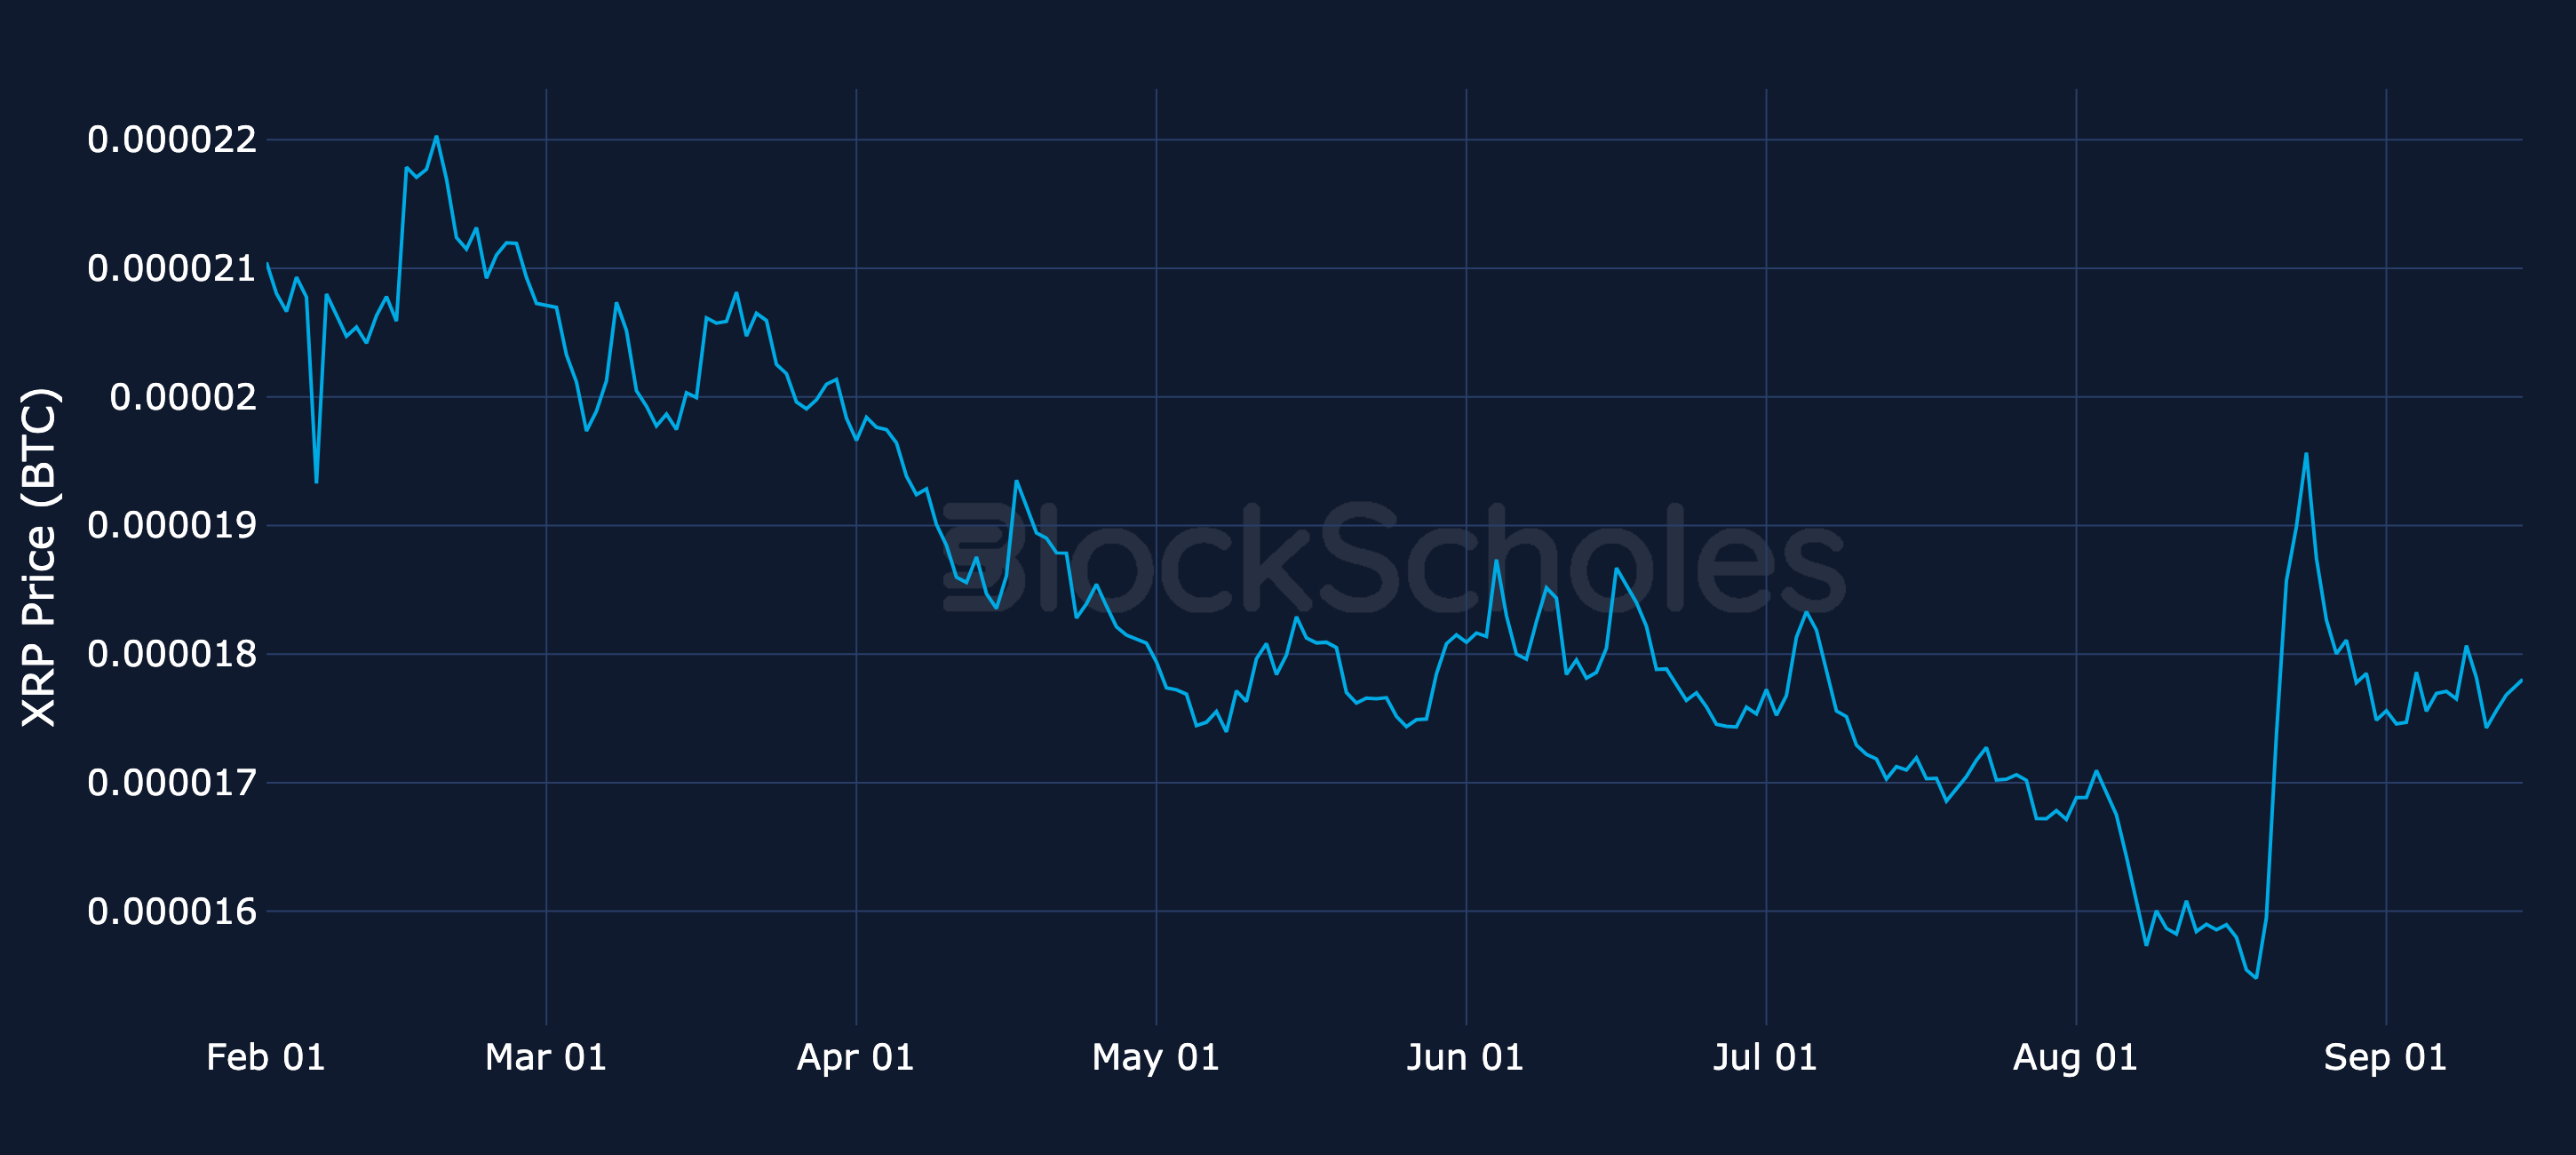
Figure 6. SOL spot price denominated in BTC (the SOL/BTC cross). Source: CoinGecko, Block Scholes.

Altcoin spot prices denominated in BTC: XRP

Figure 7. XRP spot price denominated in BTC (the XRP/BTC cross). Source: CoinGecko, Block Scholes.
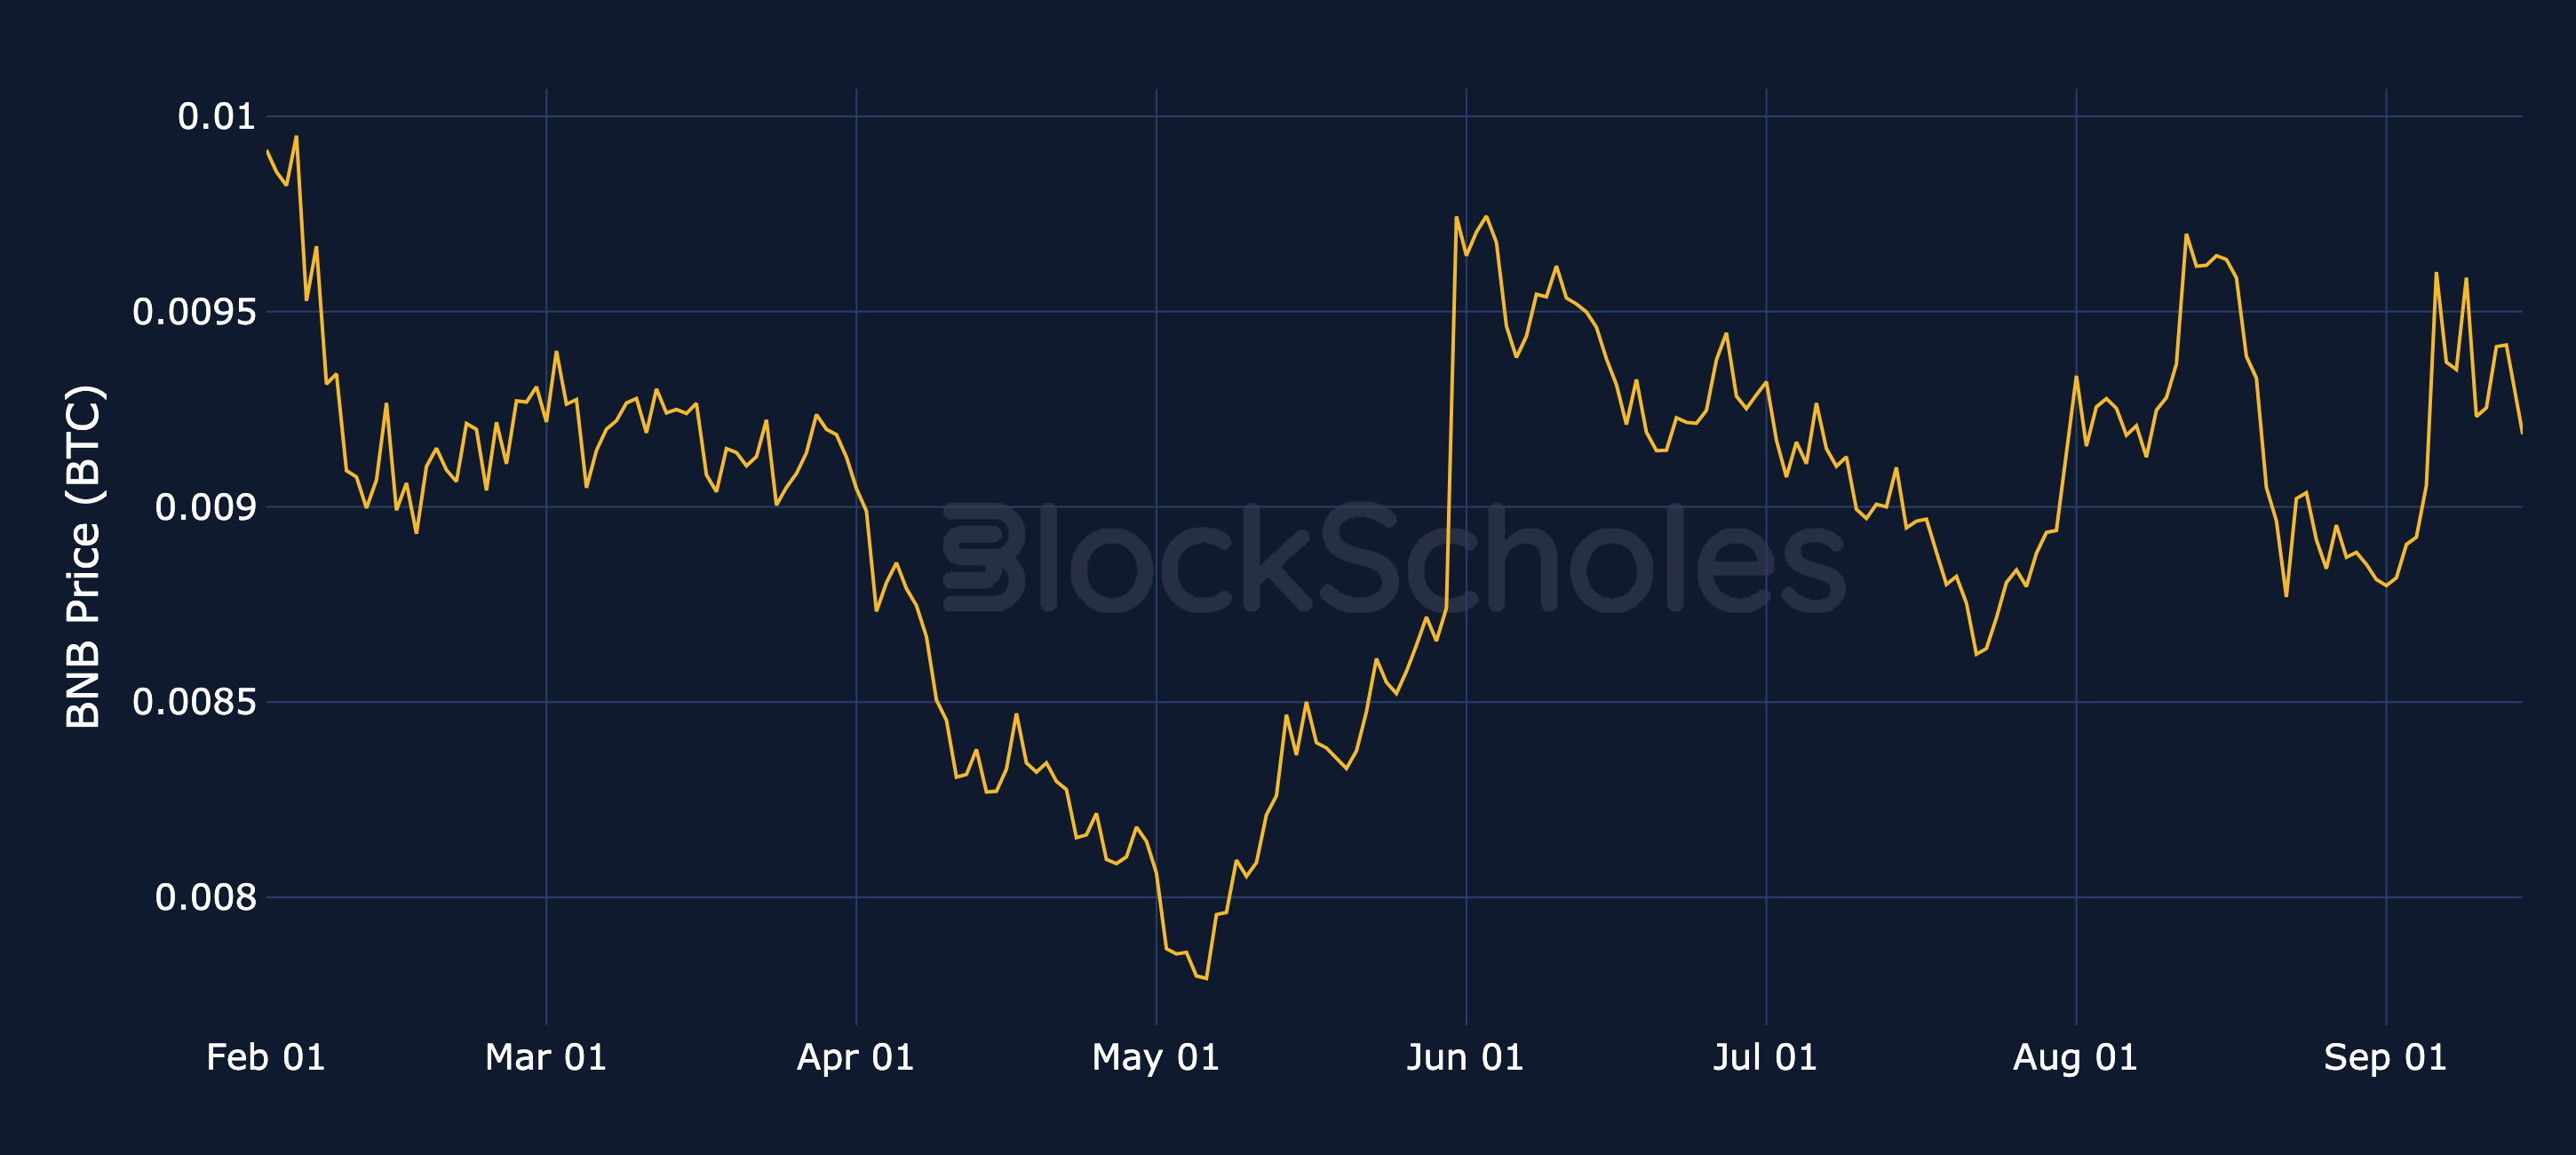
Figure 7. XRP spot price denominated in BTC (the XRP/BTC cross). Source: CoinGecko, Block Scholes.

Altcoin spot prices denominated in BTC: BNB

Figure 8. BNB spot price denominated in BTC (the BNB/BTC cross). Source: CoinGecko, Block Scholes.
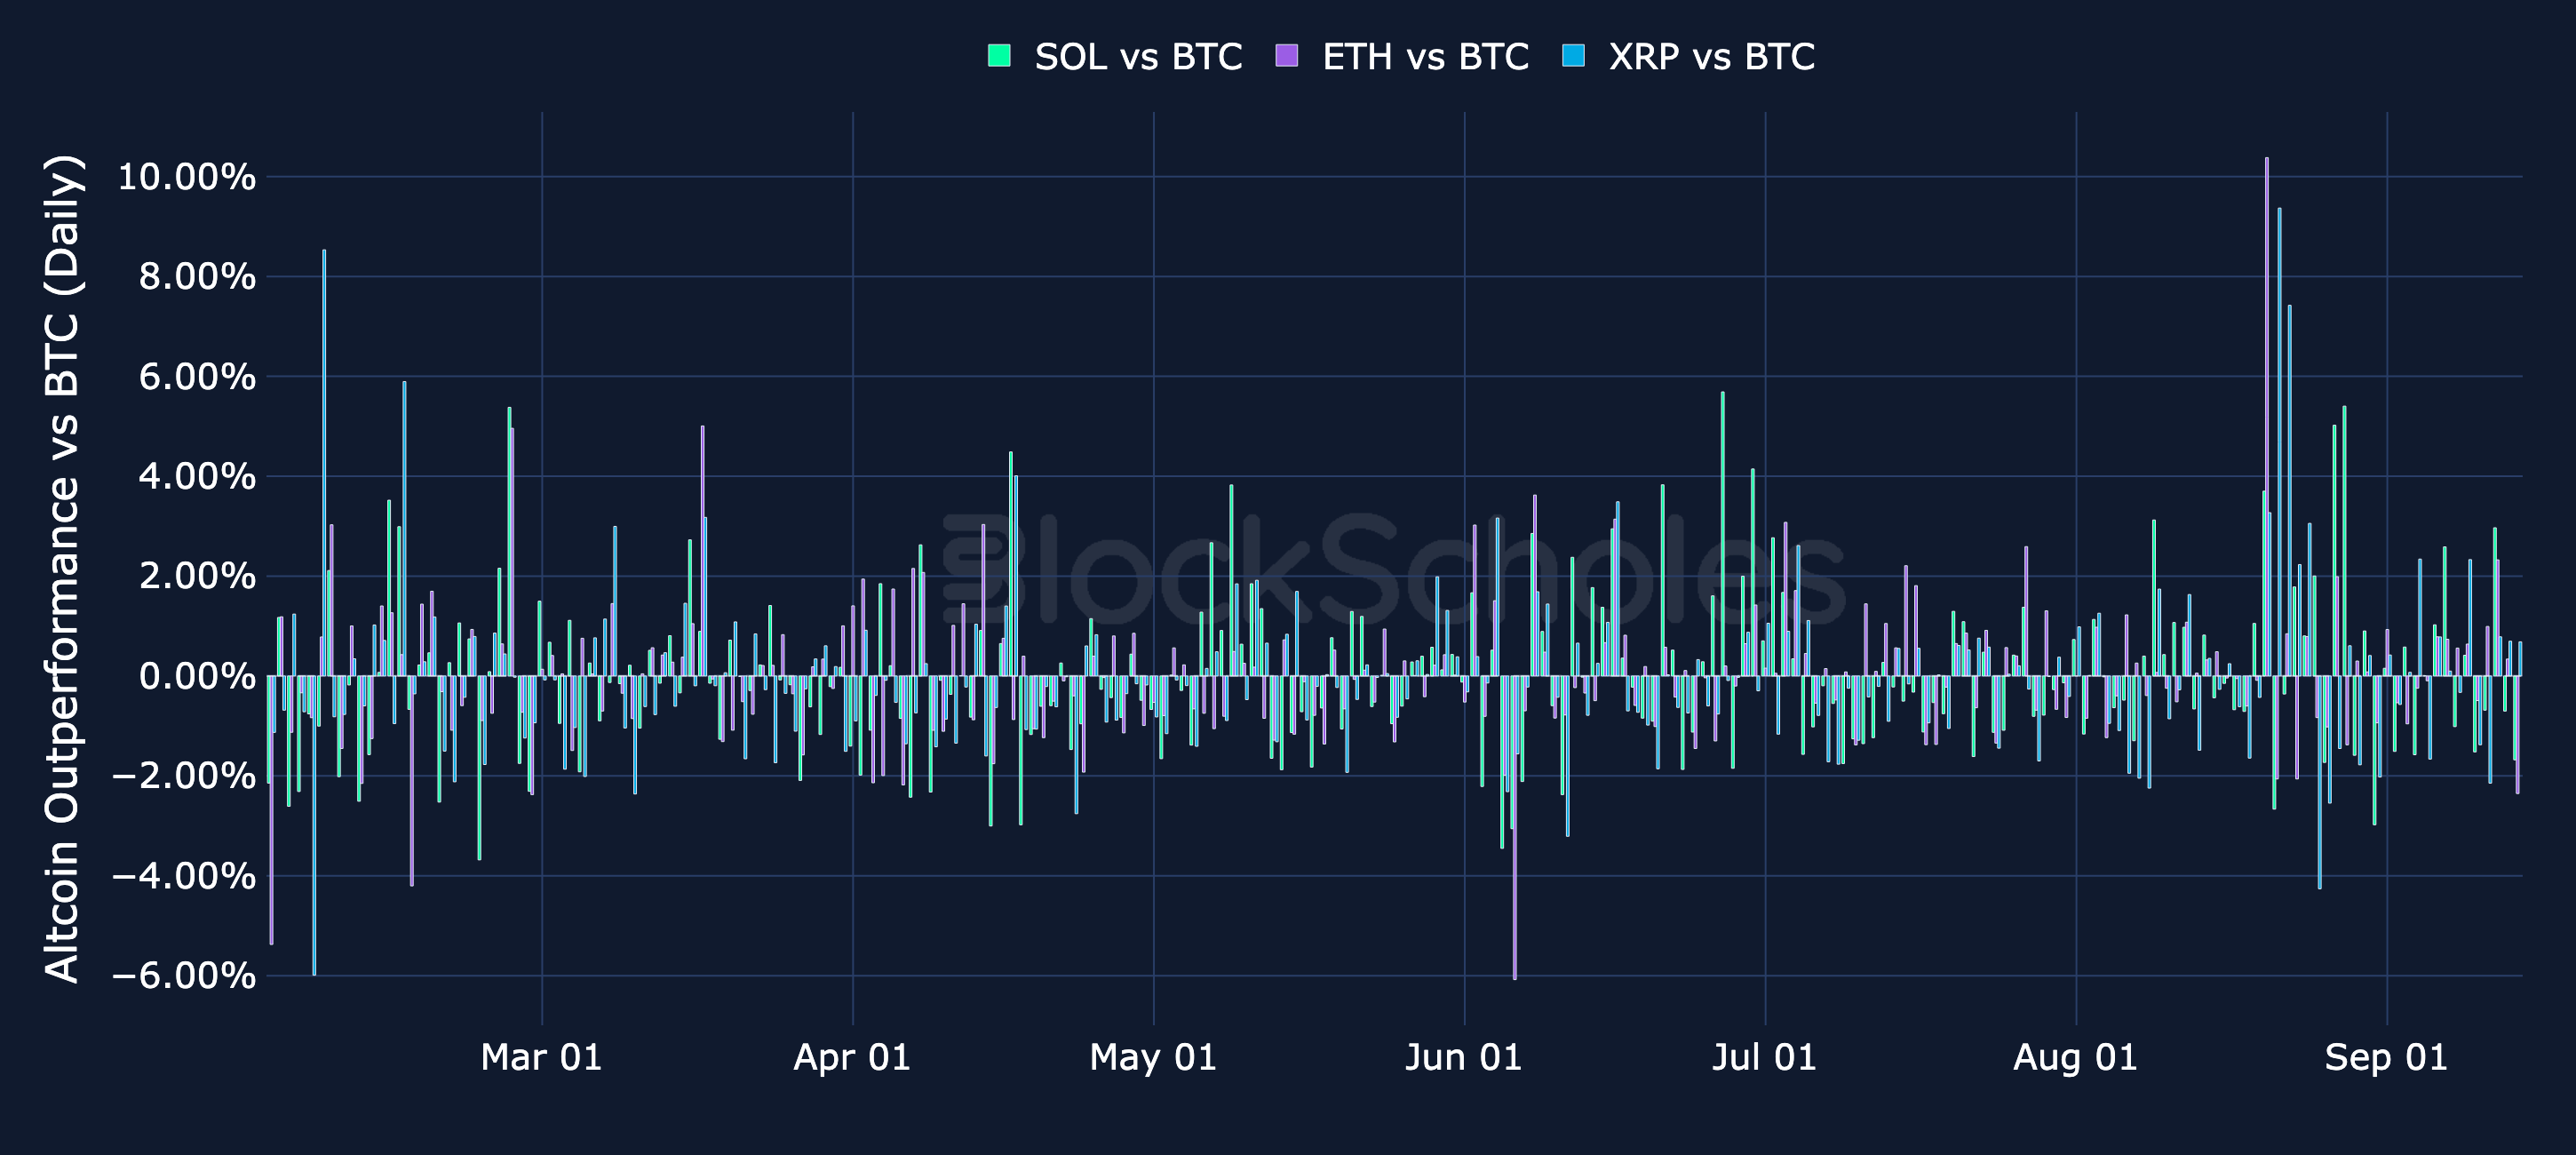
Figure 8. BNB spot price denominated in BTC (the BNB/BTC cross). Source: CoinGecko, Block Scholes.

Altcoins performance vs BTC

Daily relative simple returns vs BTC

Figure 9. Daily simple return of each tracked altcoin minus BTC's daily return. Source: CoinGecko, Block Scholes.
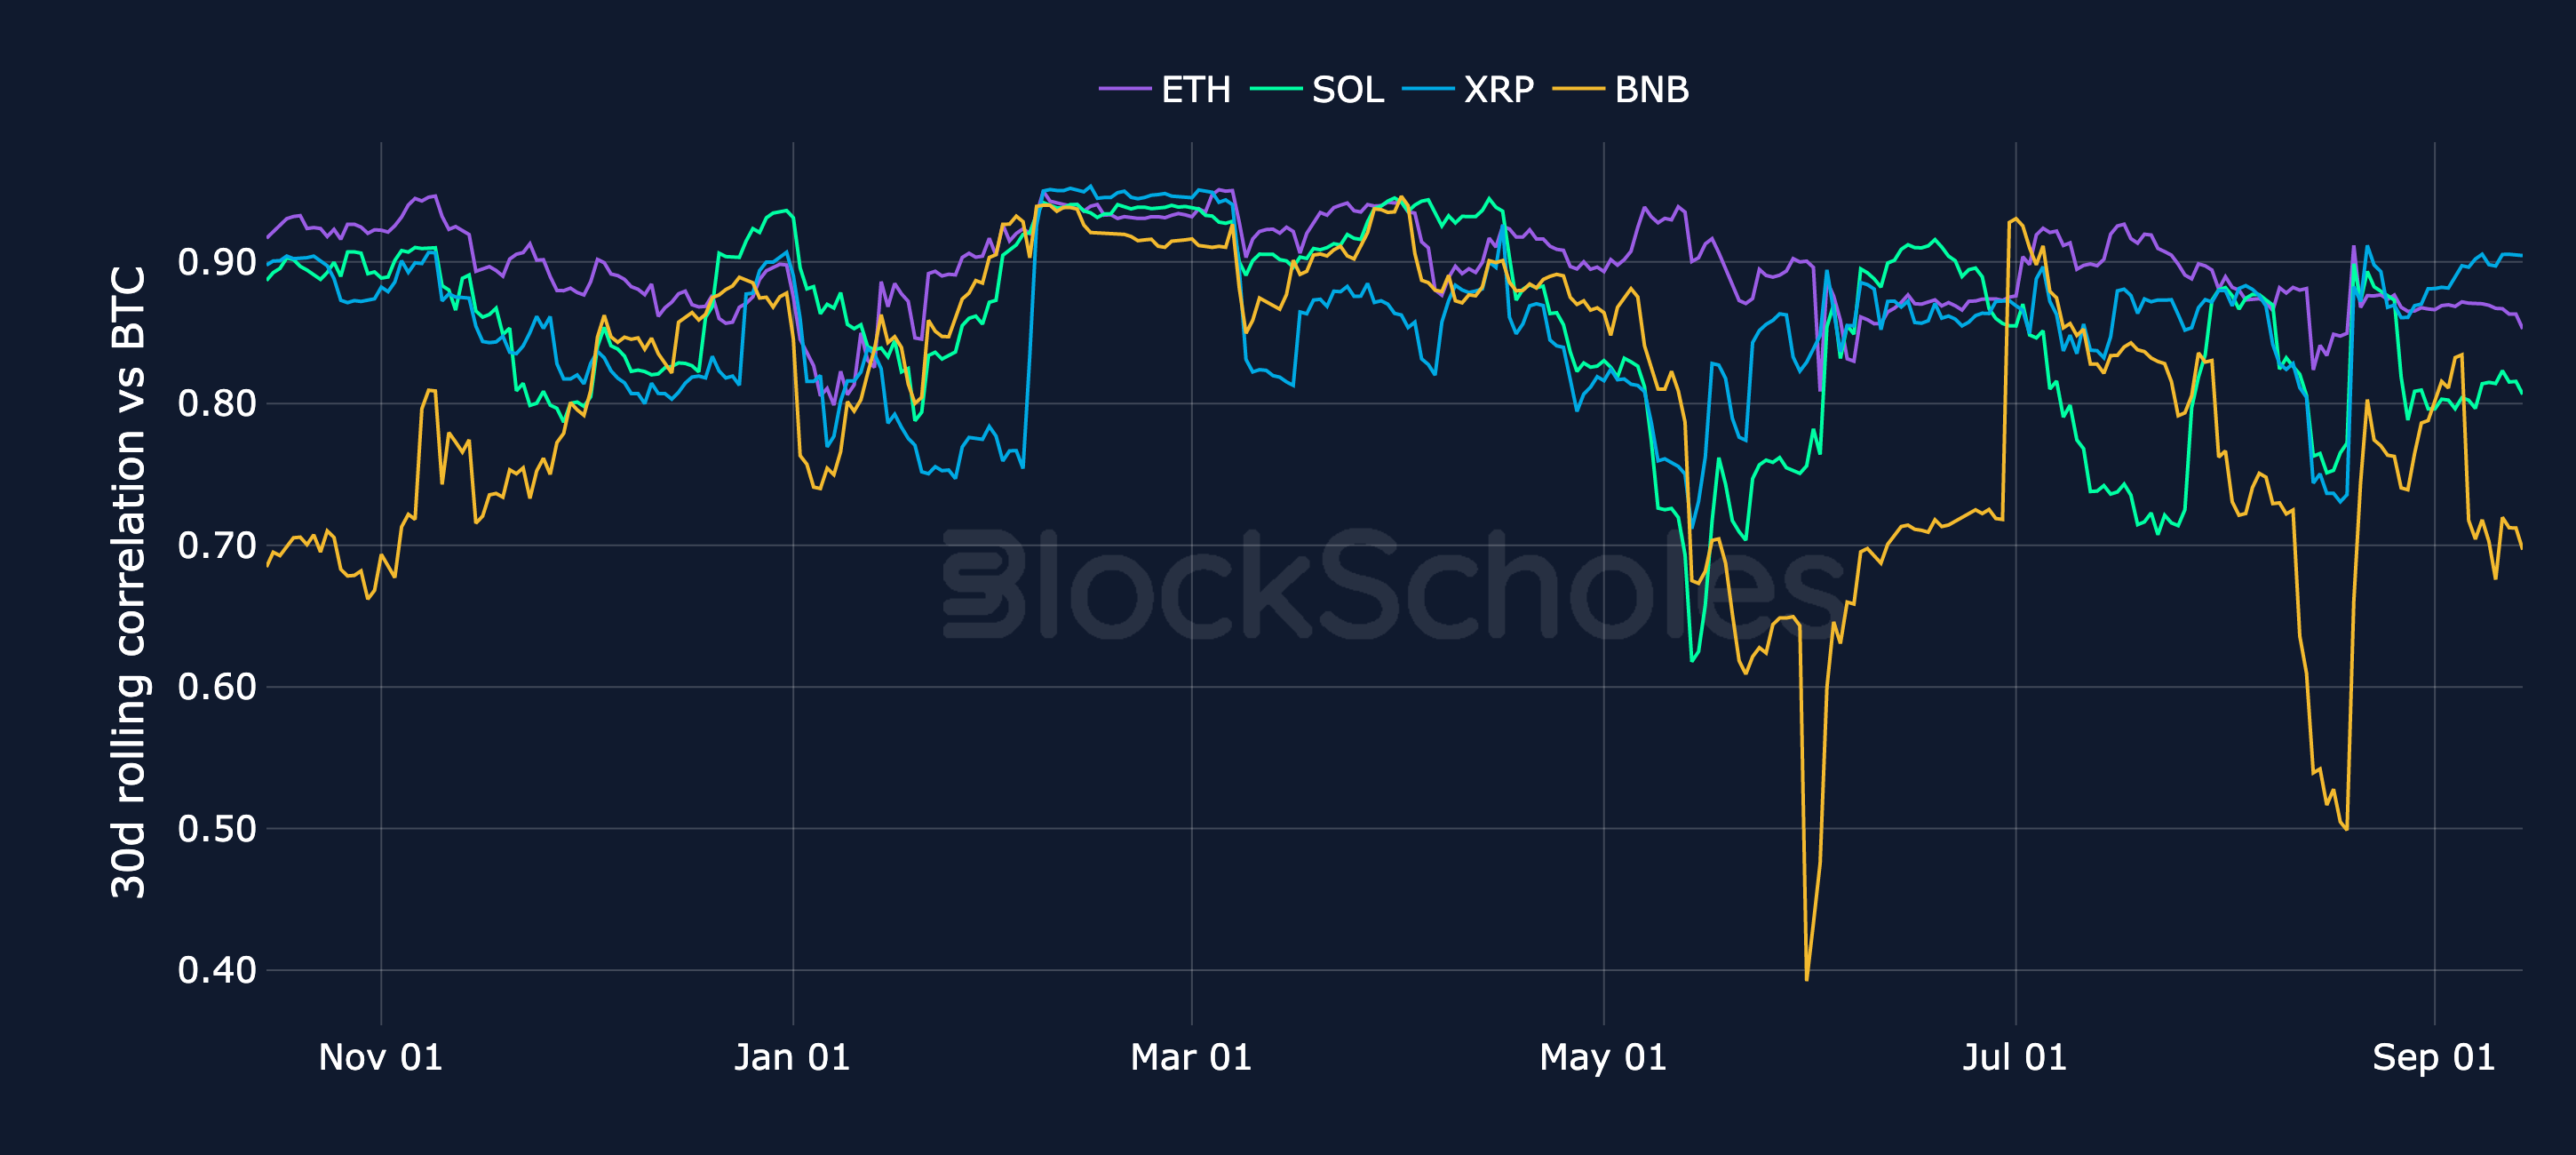
Figure 9. Daily simple return of each tracked altcoin minus BTC's daily return. Source: CoinGecko, Block Scholes.

Rolling 30-day correlation vs BTC

Figure 10. Rolling 30-day correlation of each altcoin's daily returns with BTC's. Source: CoinGecko, Block Scholes.
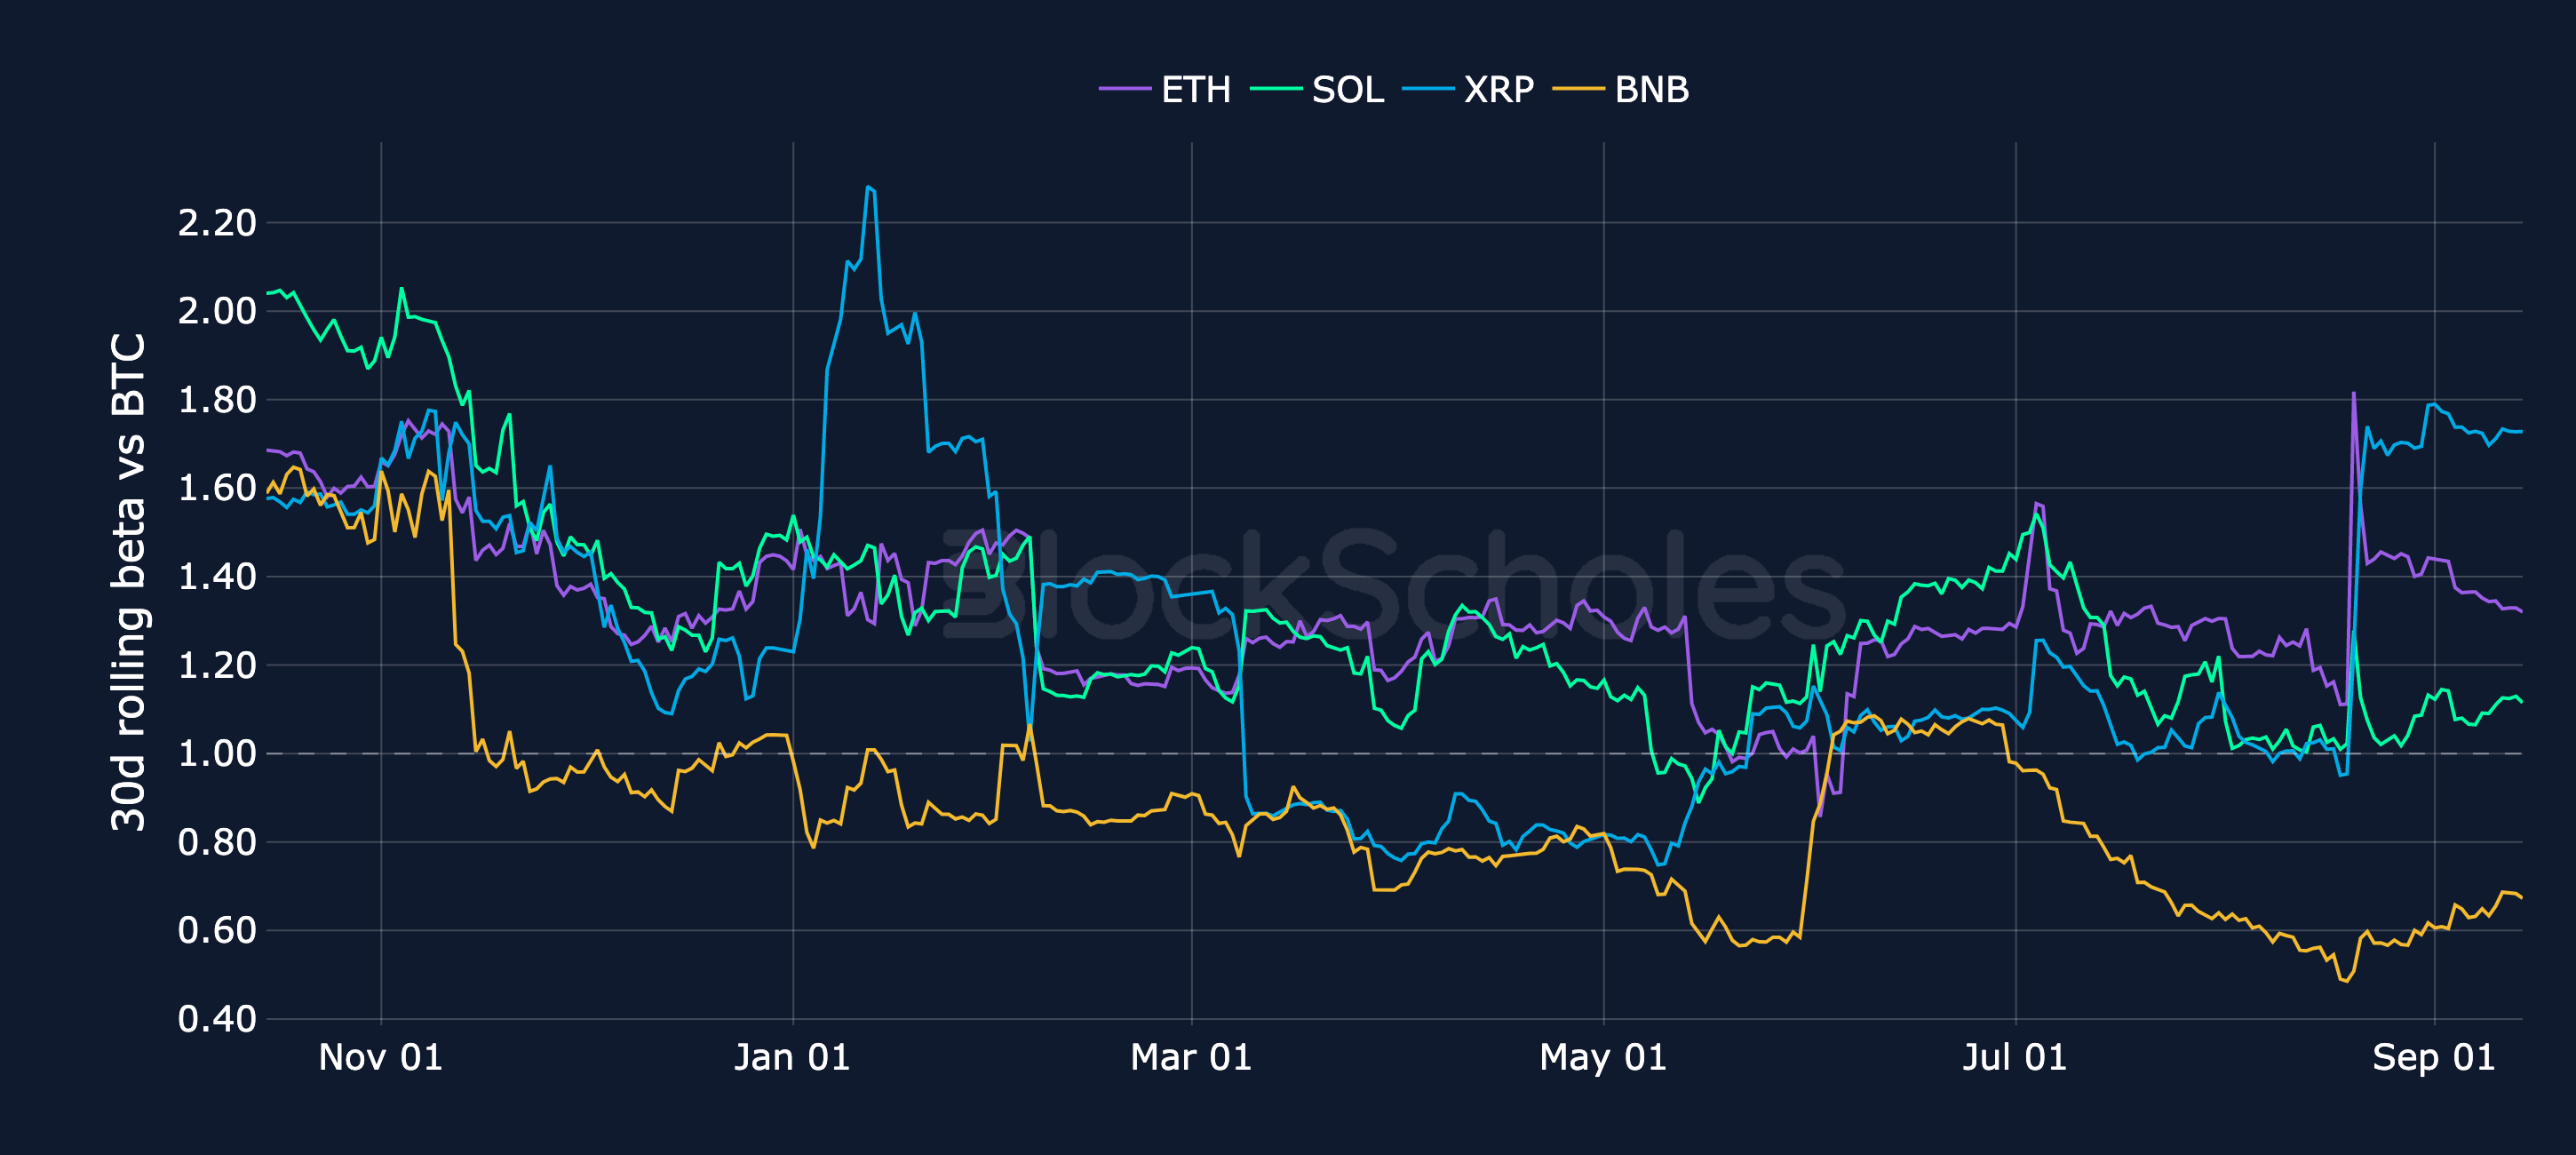
Figure 10. Rolling 30-day correlation of each altcoin's daily returns with BTC's. Source: CoinGecko, Block Scholes.

Rolling 30-day beta vs BTC

Figure 11. Rolling 30-day beta of each altcoin's daily returns to BTC's. Source: CoinGecko, Block Scholes.
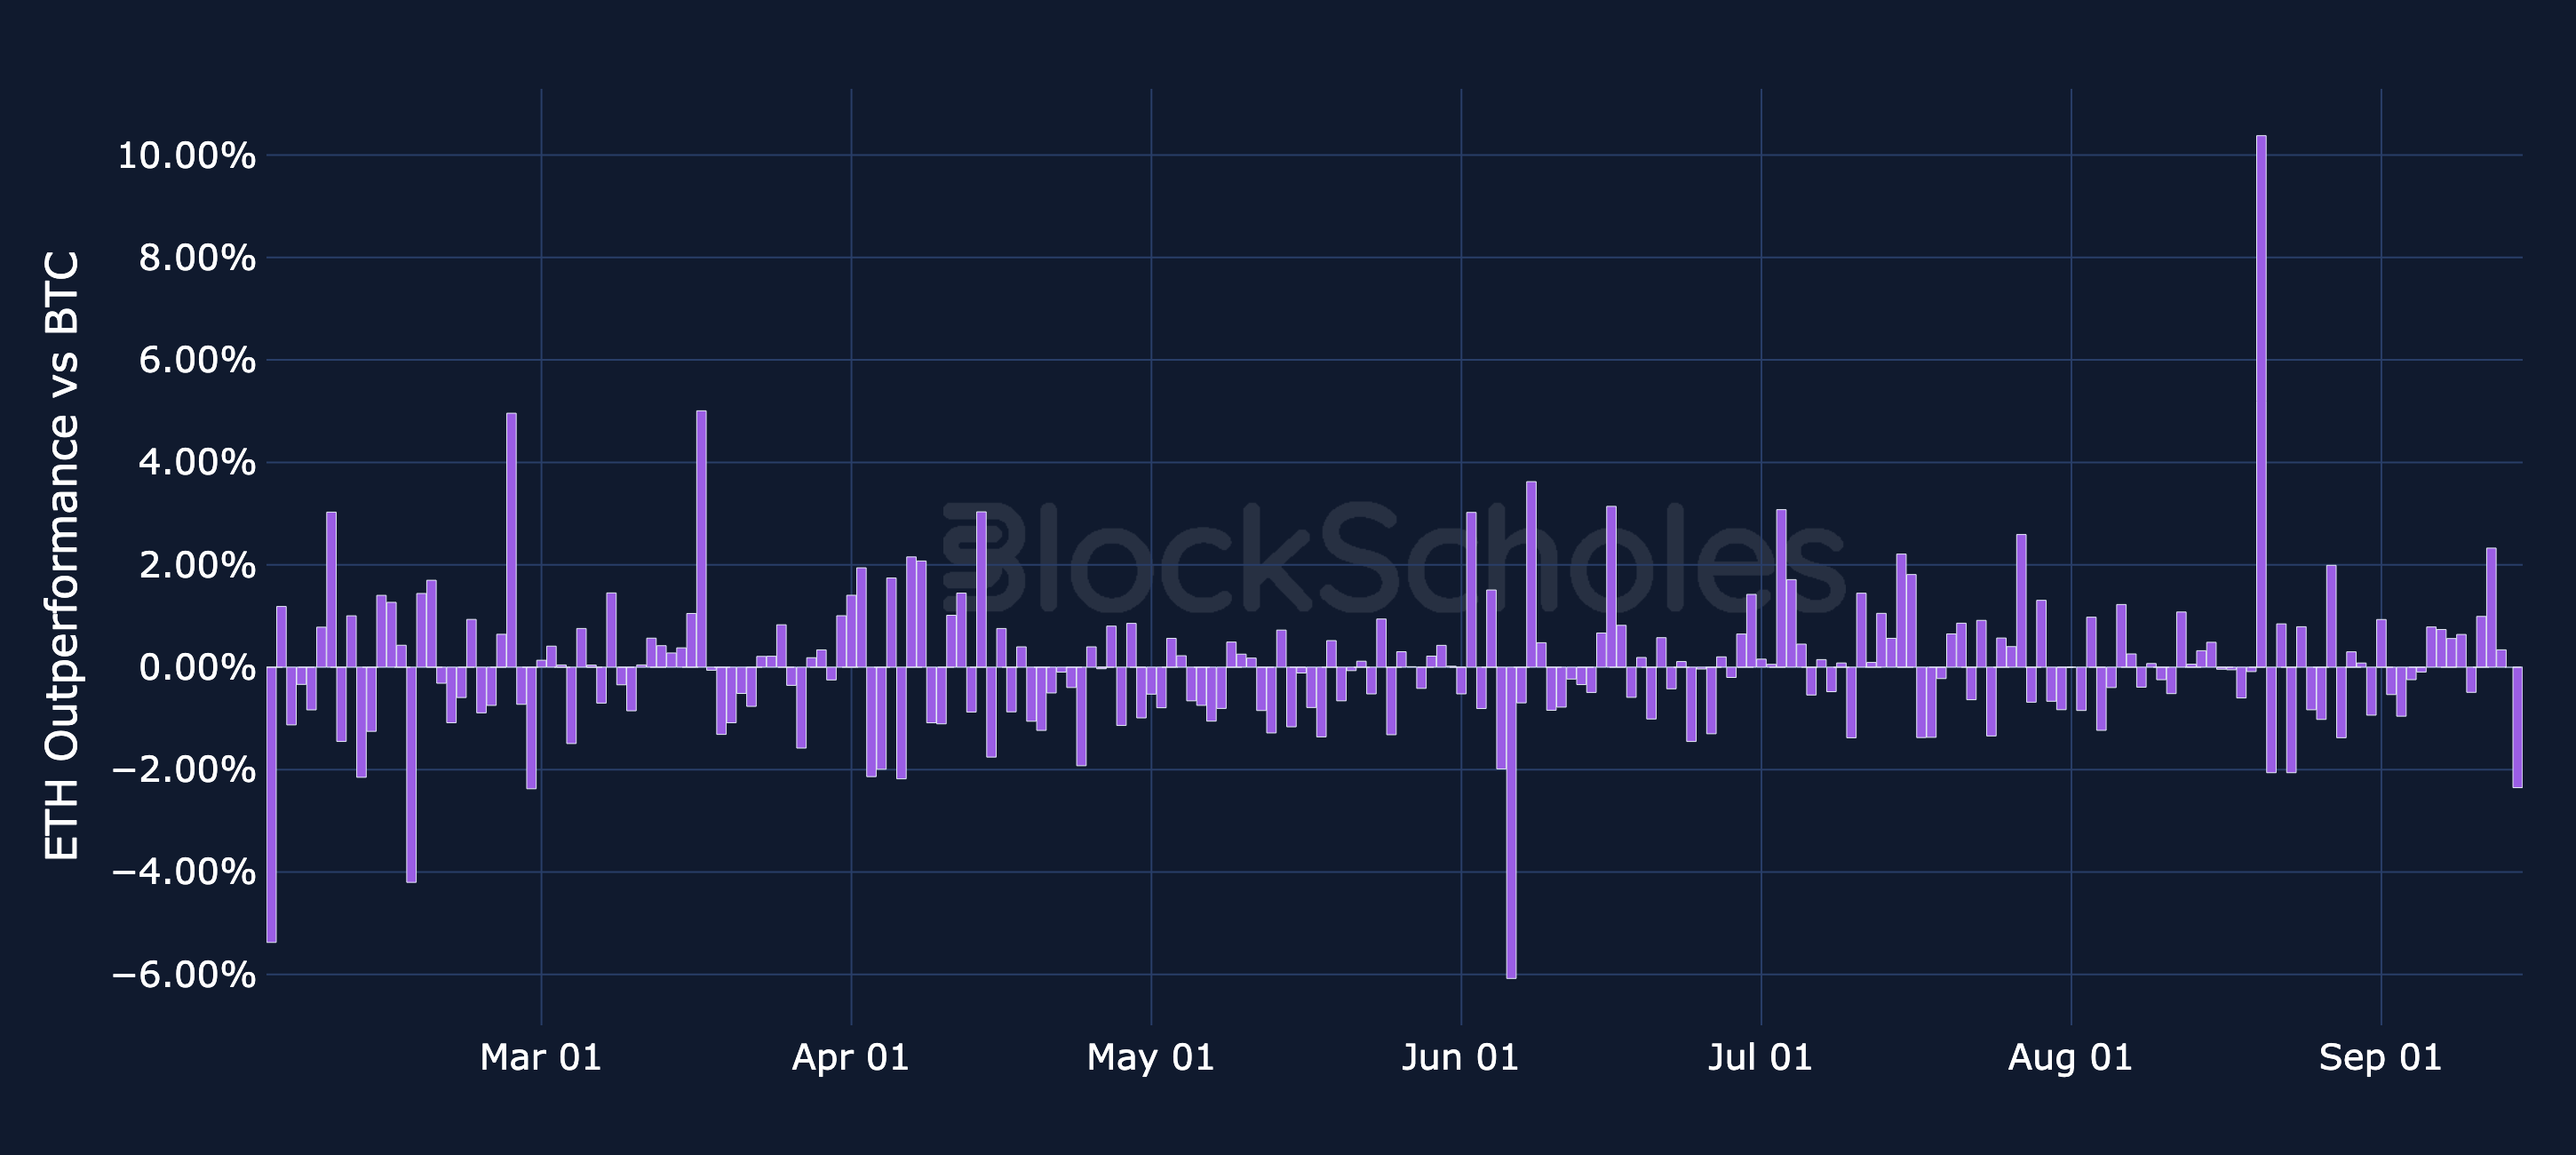
Figure 11. Rolling 30-day beta of each altcoin's daily returns to BTC's. Source: CoinGecko, Block Scholes.

Altcoin Performance vs BTC

Daily relative simple returns vs BTC: ETH

Figure 12. Daily simple return of ETH minus BTC's daily return. Source: CoinGecko, Block Scholes.
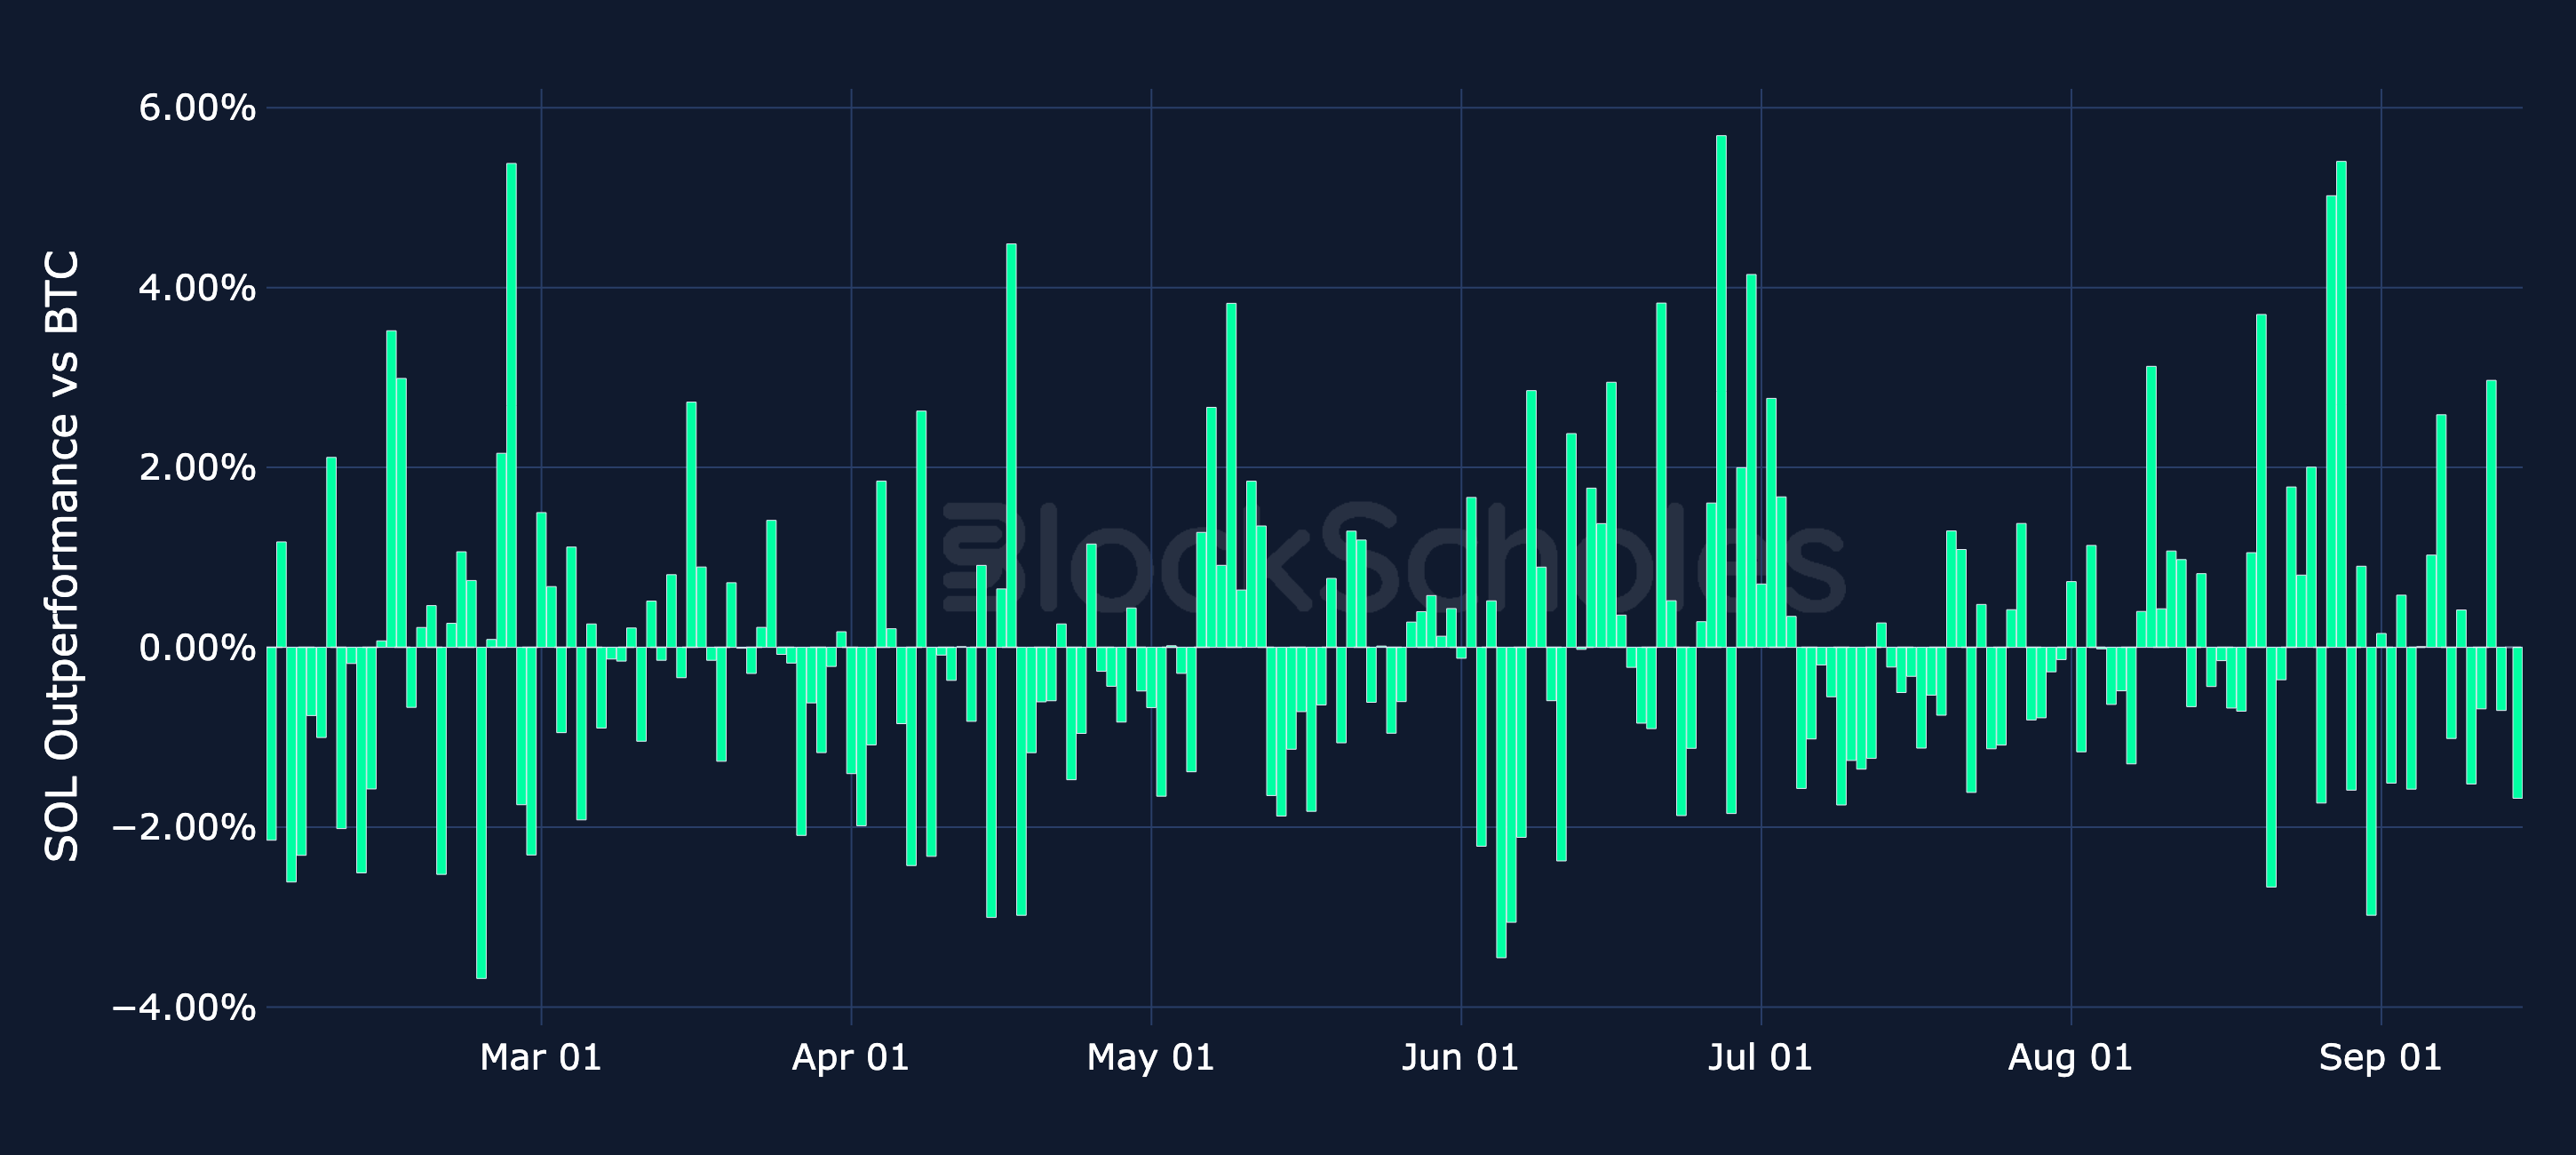
Figure 12. Daily simple return of ETH minus BTC's daily return. Source: CoinGecko, Block Scholes.

Daily relative simple returns vs BTC: SOL

Figure 13. Daily simple return of SOL minus BTC's daily return. Source: CoinGecko, Block Scholes.
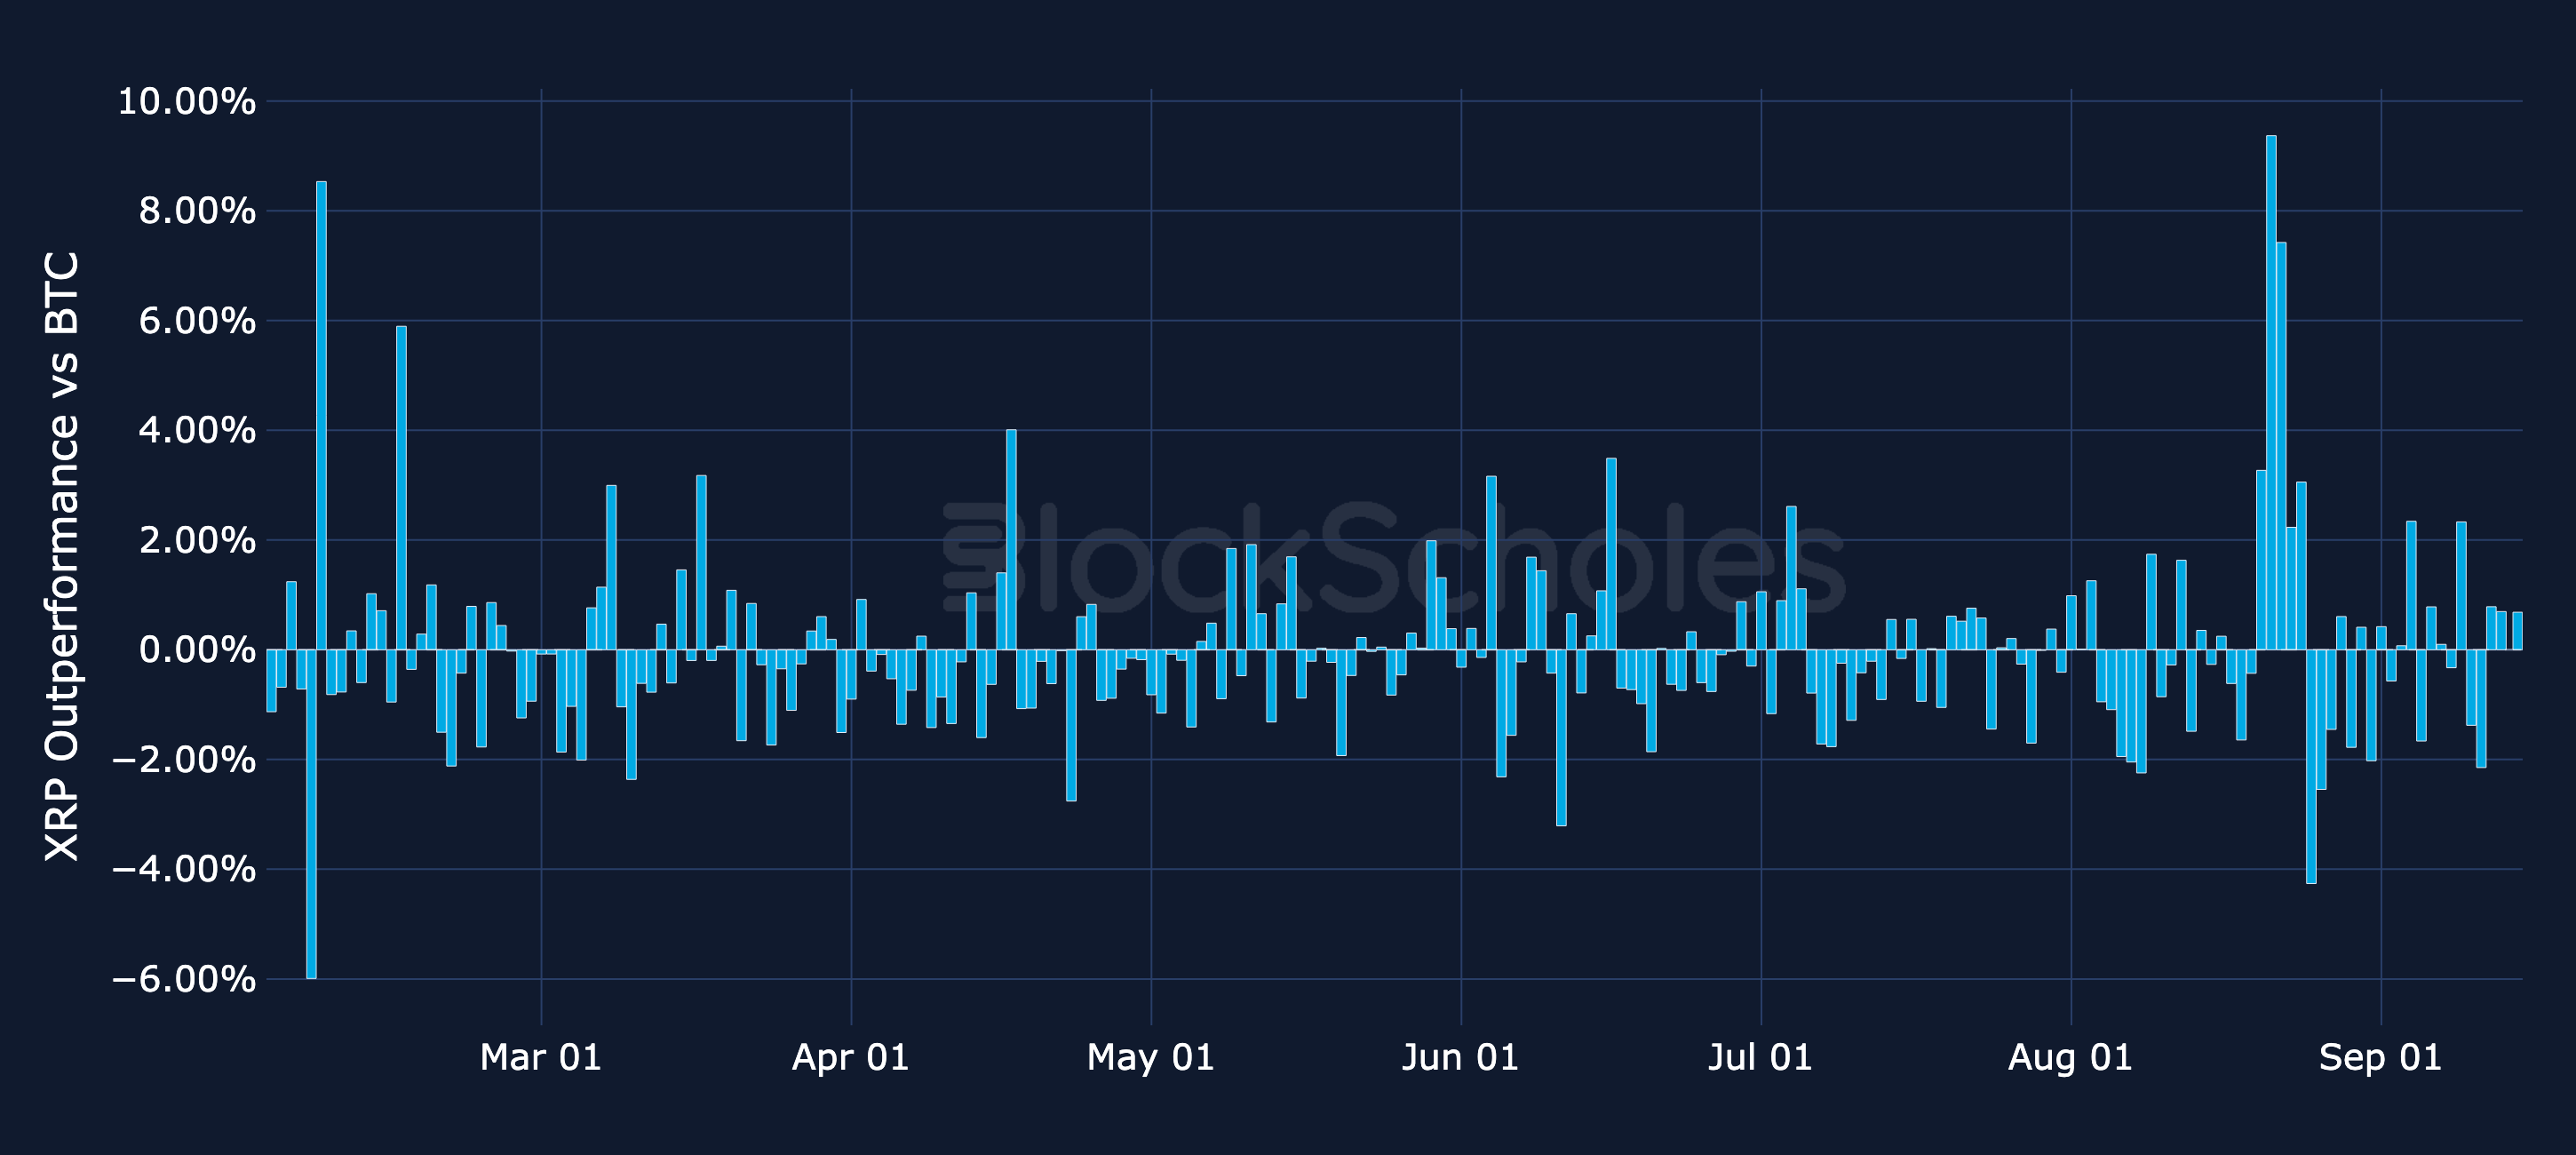
Figure 13. Daily simple return of SOL minus BTC's daily return. Source: CoinGecko, Block Scholes.

Daily relative simple returns vs BTC: XRP

Figure 14. Daily simple return of XRP minus BTC's daily return. Source: CoinGecko, Block Scholes.
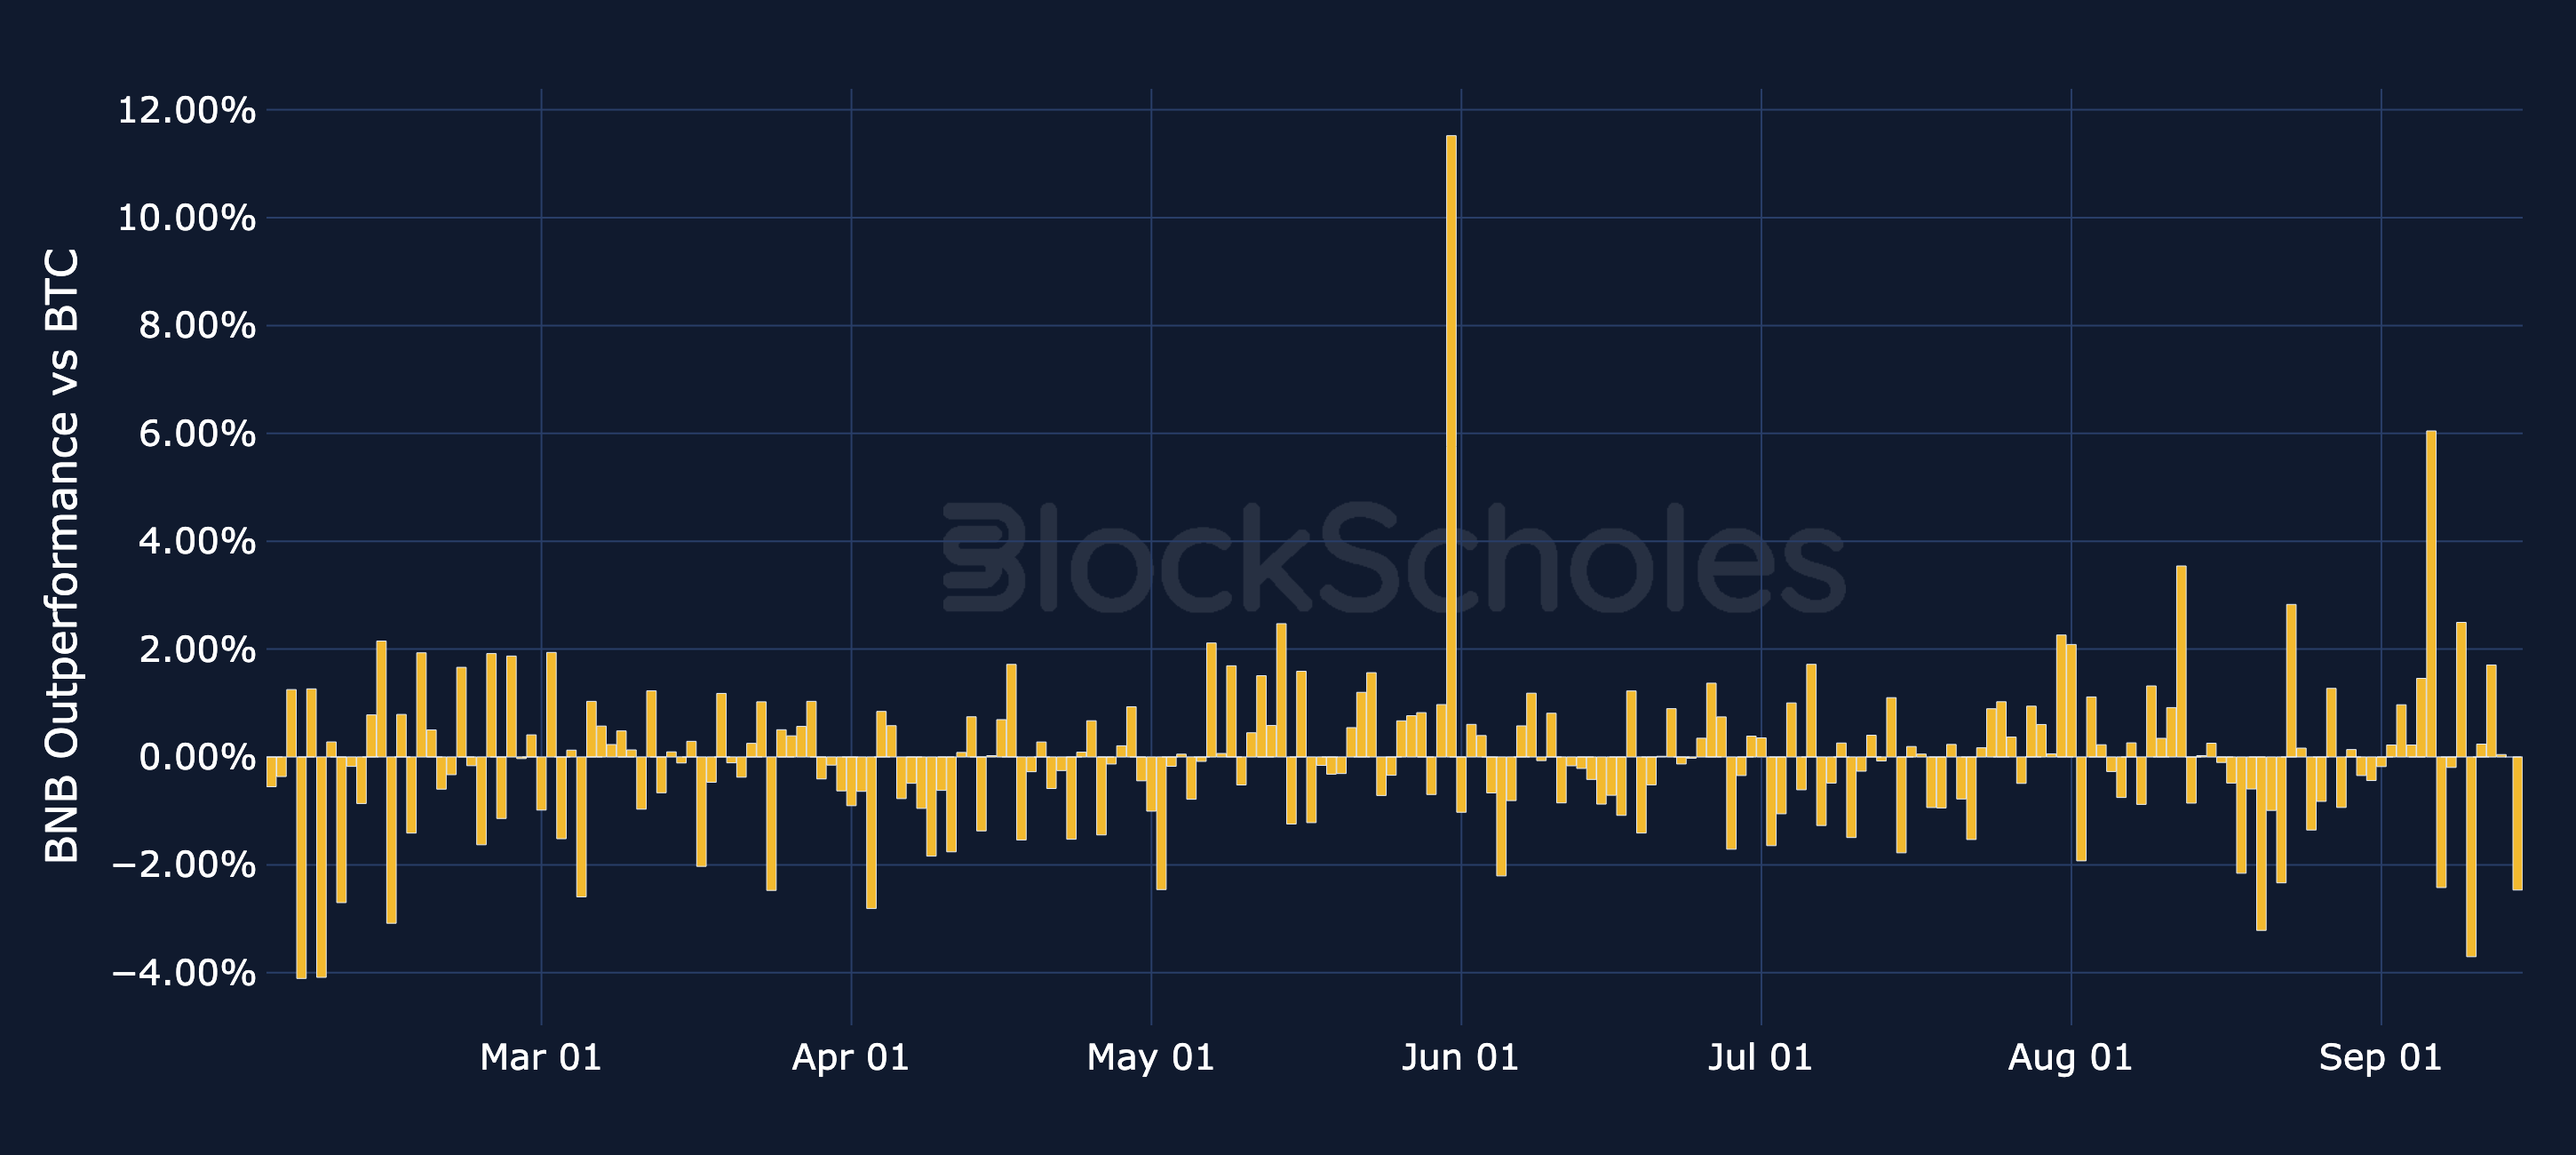
Figure 14. Daily simple return of XRP minus BTC's daily return. Source: CoinGecko, Block Scholes.

Daily relative simple returns vs BTC: BNB

Figure 15. Daily simple return of BNB minus BTC's daily return. Source: CoinGecko, Block Scholes.

Figure 15. Daily simple return of BNB minus BTC's daily return. Source: CoinGecko, Block Scholes.

ETF Flows: BTC, ETH & Altcoins

ETF Flows – BTC ETFs have been recovering since cumulative flows bottomed on 13th July: they have taken in $4.30B over the 43 trading days since, with net inflows on 28 of them, winning back about half of the $8.91B shed after the 6th May peak. The past week (8th September–11th September) broke that run with $463M of outflows. ETH ETFs extended their inflows with $197M over the same week, leaving cumulative ETH ETF flows at their highest level this year.

XRP led altcoin ETF inflows over the past week at $19M, followed by SOL at $10.3M, LINK at $5.36M, HBAR at $1.25M and DOT at $663K, while HYPE saw a net $26.4M outflow. XRP's funds took in money on 3 of the 4 trading days and had no outflow sessions. TRX joins the ETF charts this week after Canary Capital launched its staked TRX ETF (TRXS): the fund held about $49.9M in net assets as of 11th September and recorded no net flows over its first two trading days, so its line and bars sit at zero for now.

Adjusted for market cap, SOL has the largest 20-day rolling net ETF inflow among altcoin ETFs, at around 0.35% of token market cap (as of 11th September). ETH's rolling net inflow is larger still, at around 0.69% of its market cap.
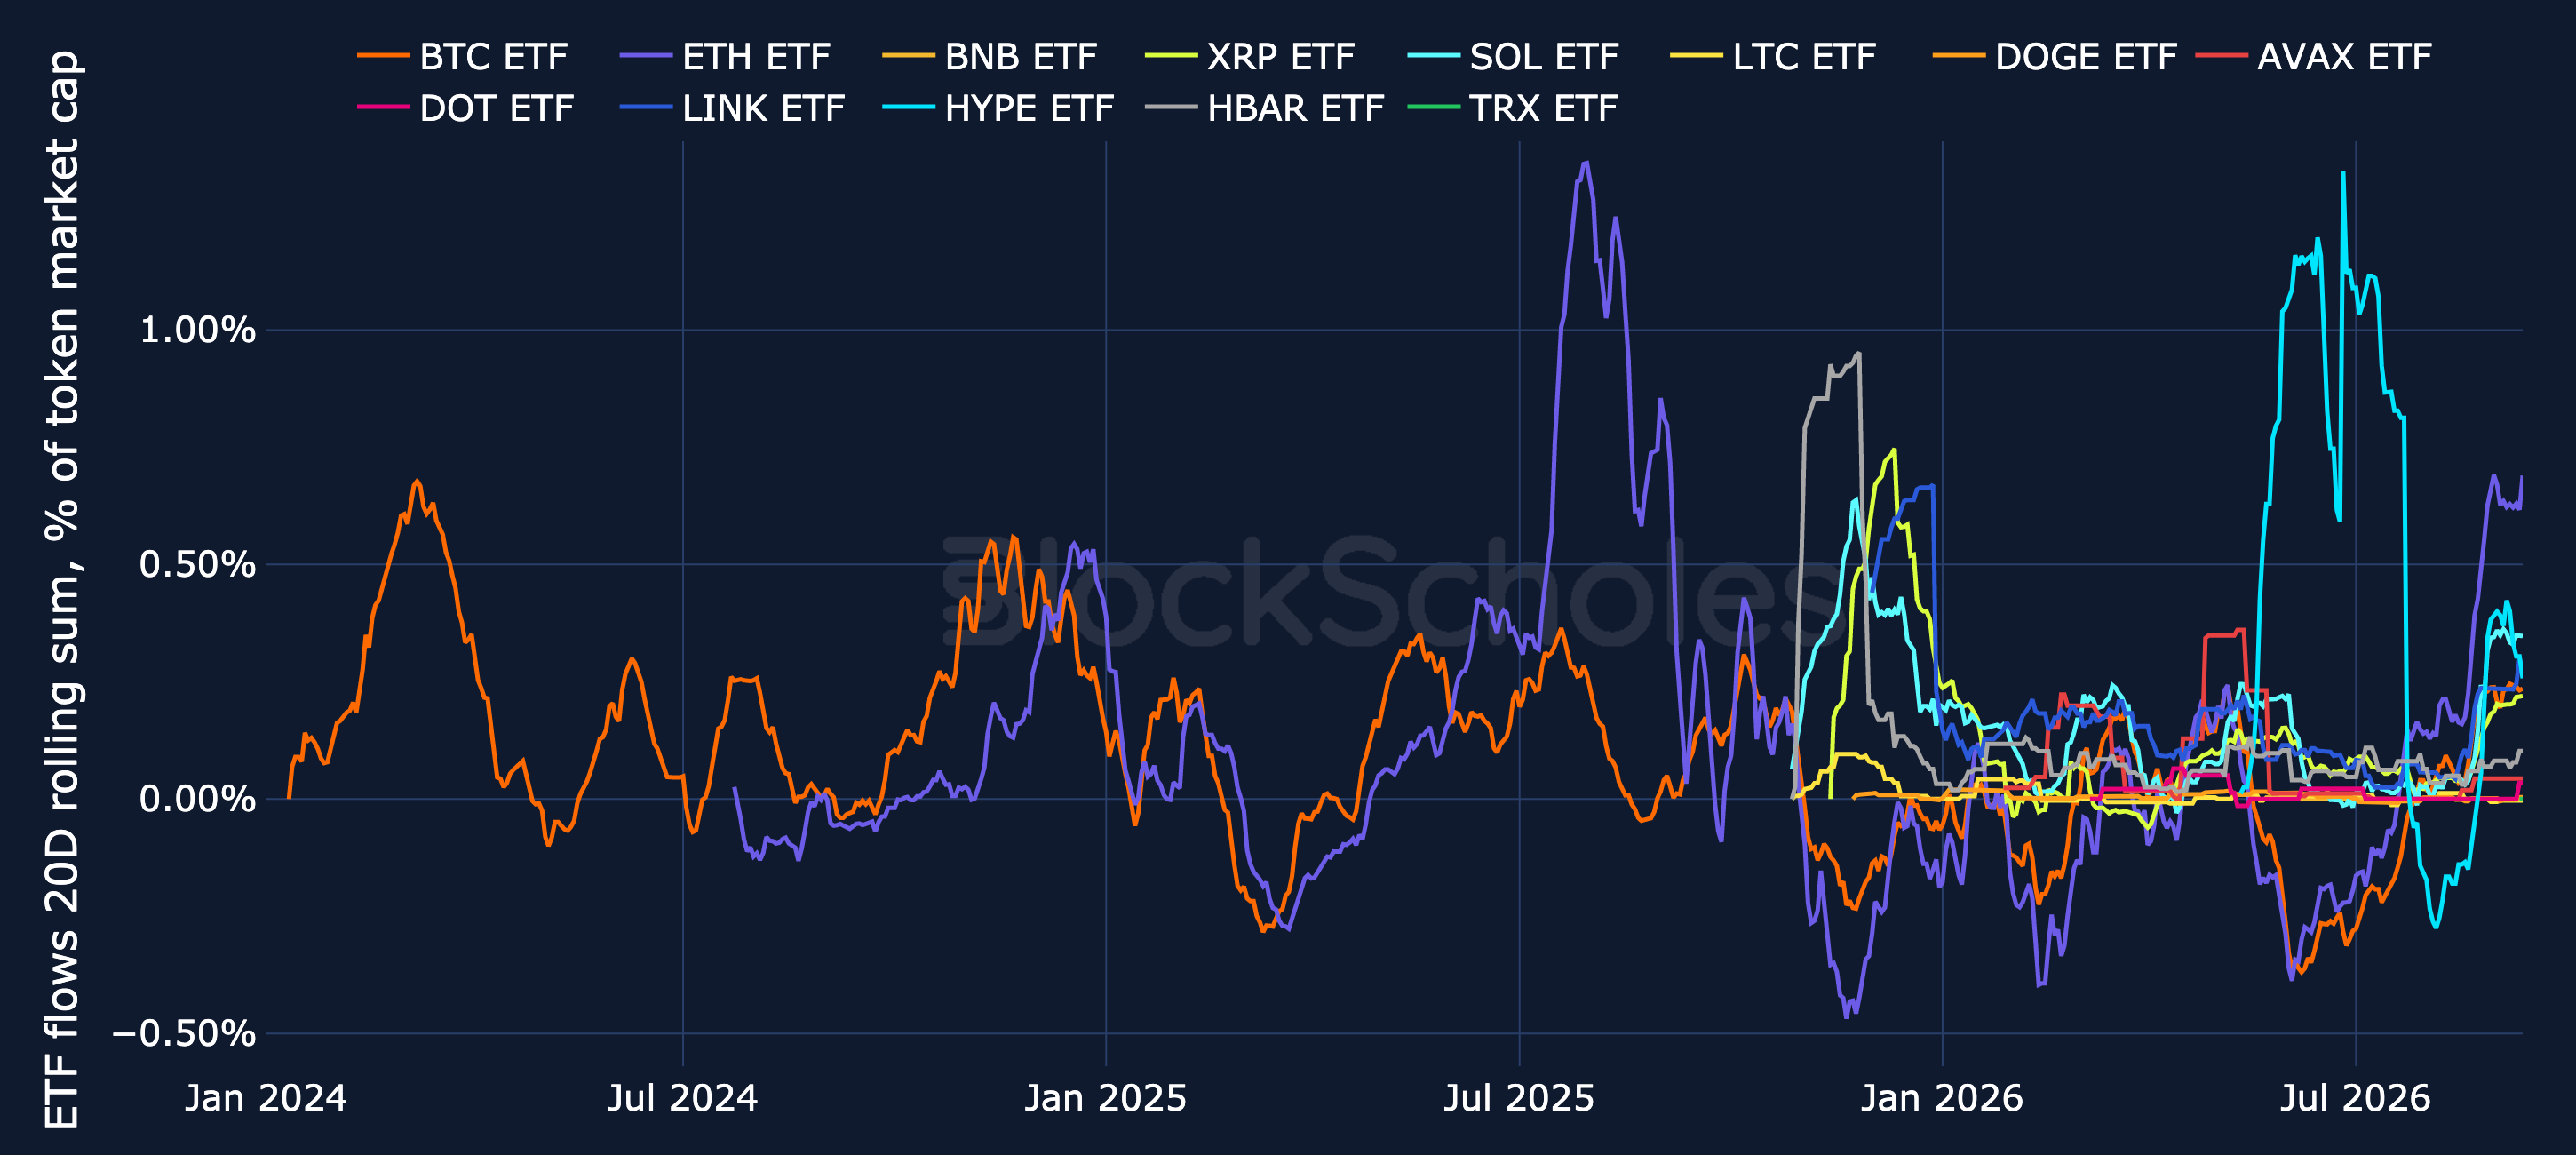
ETF net flows: BTC, ETH & Altcoins (20-day rolling, % of market cap)

Figure 16. Net flows into spot BTC, ETH and altcoin ETFs, 20-day rolling sum as a percentage of each token's market cap. Source: SoSoValue, CoinGecko, Block Scholes.
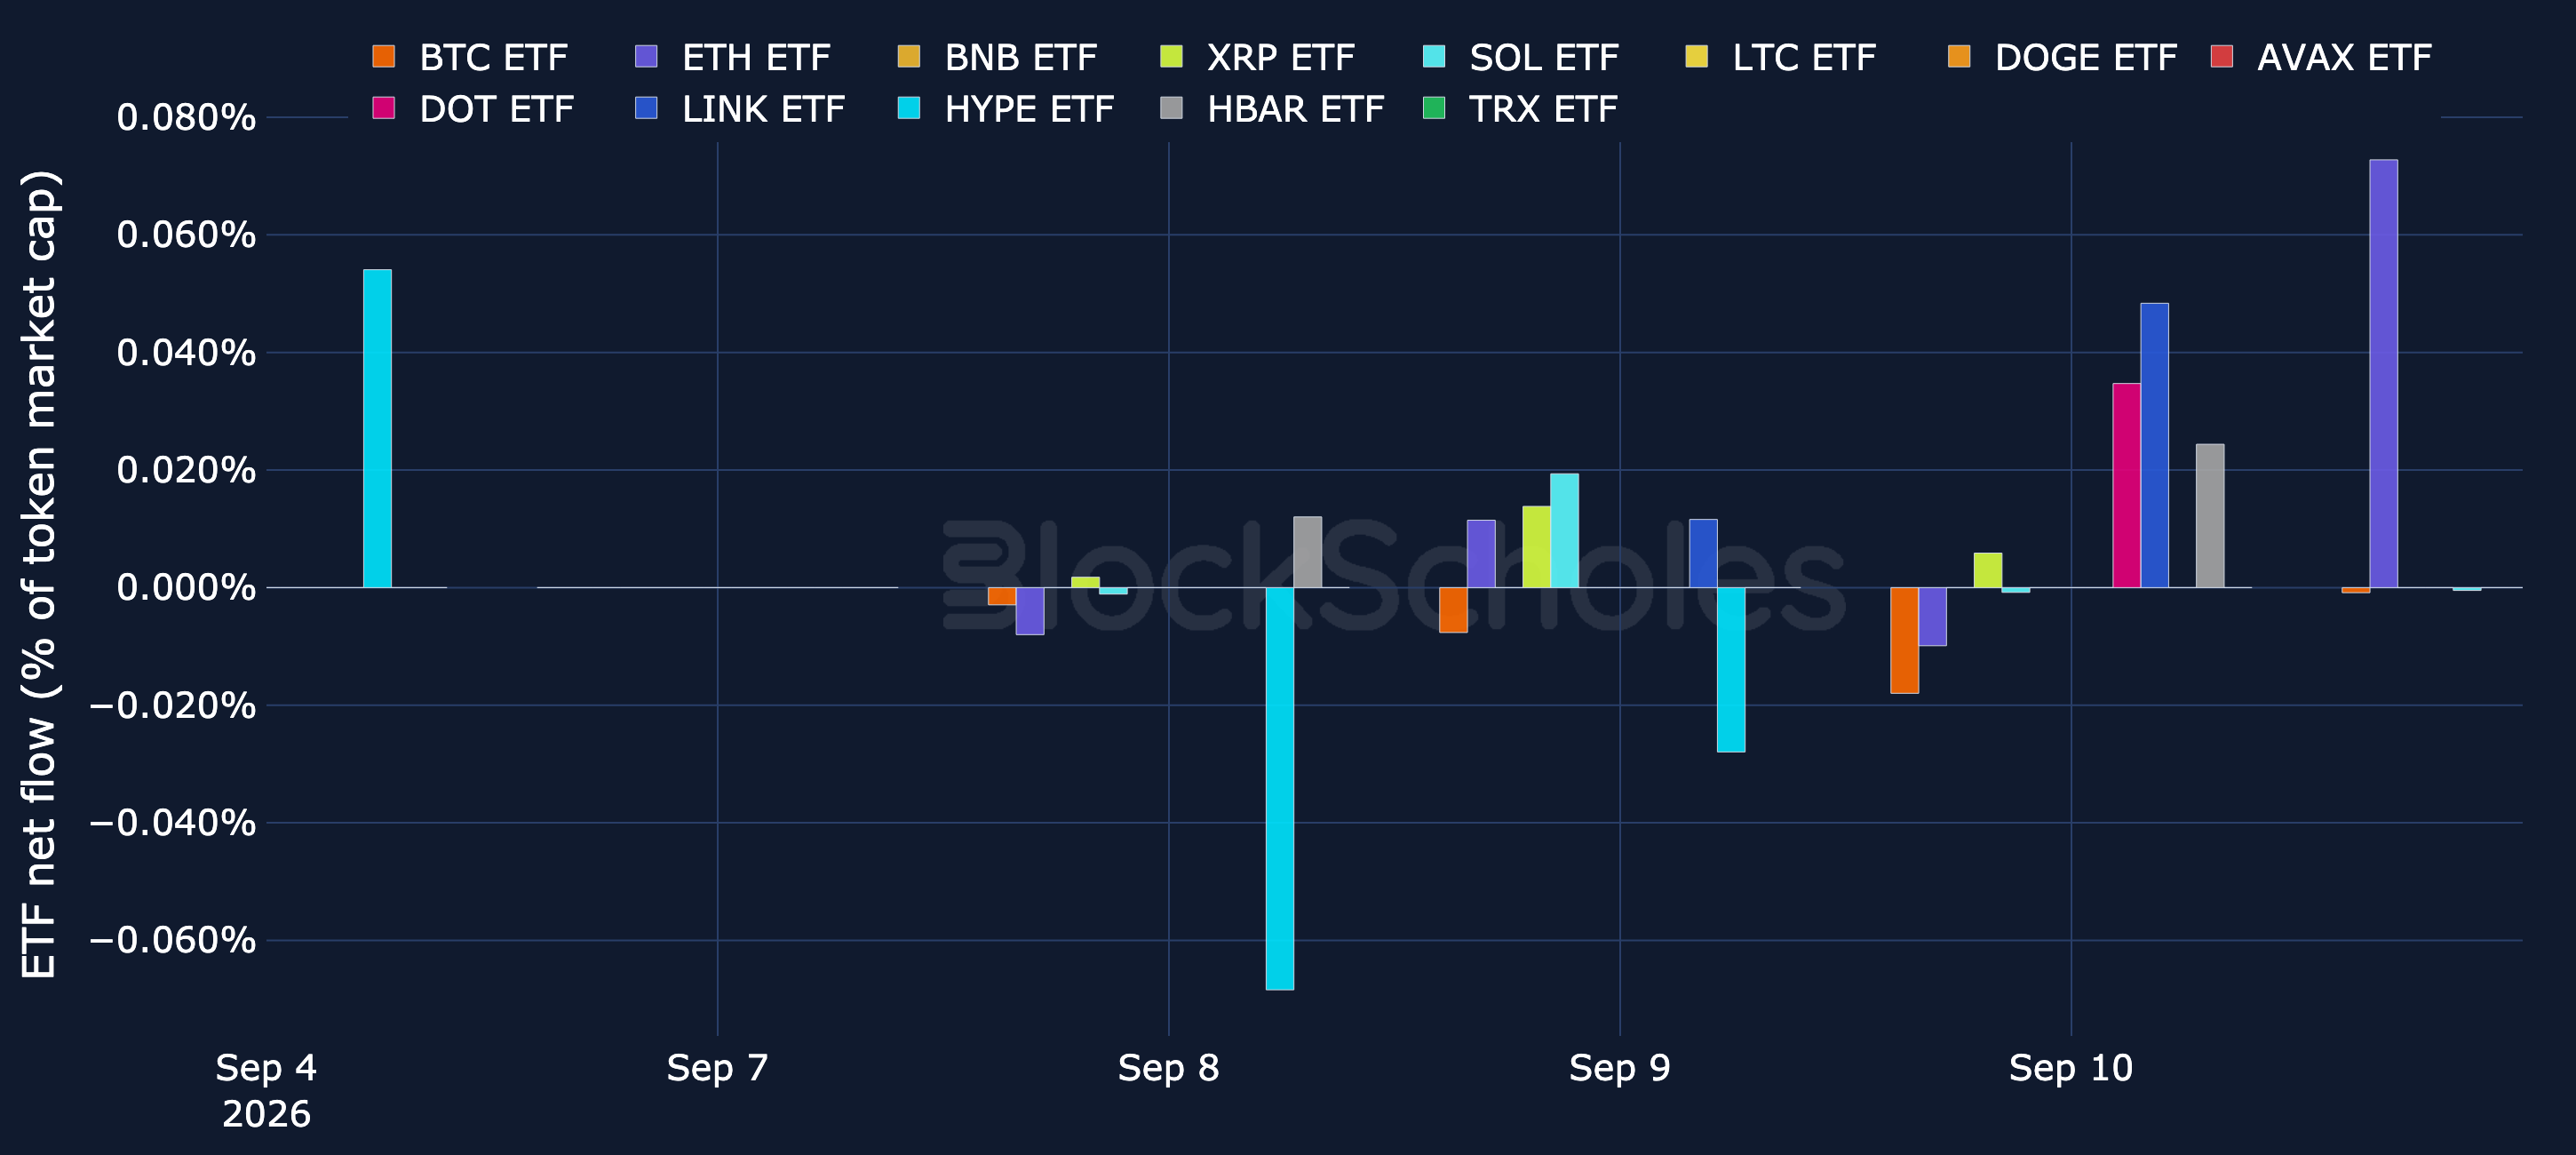
Figure 16. Net flows into spot BTC, ETH and altcoin ETFs, 20-day rolling sum as a percentage of each token's market cap. Source: SoSoValue, CoinGecko, Block Scholes.

ETF net flows: BTC, ETH & Altcoins (latest week, % of market cap)

Figure 17. Net flows into spot BTC, ETH and altcoin ETFs over the latest week, as a percentage of each token's market cap. Source: SoSoValue, CoinGecko, Block Scholes.
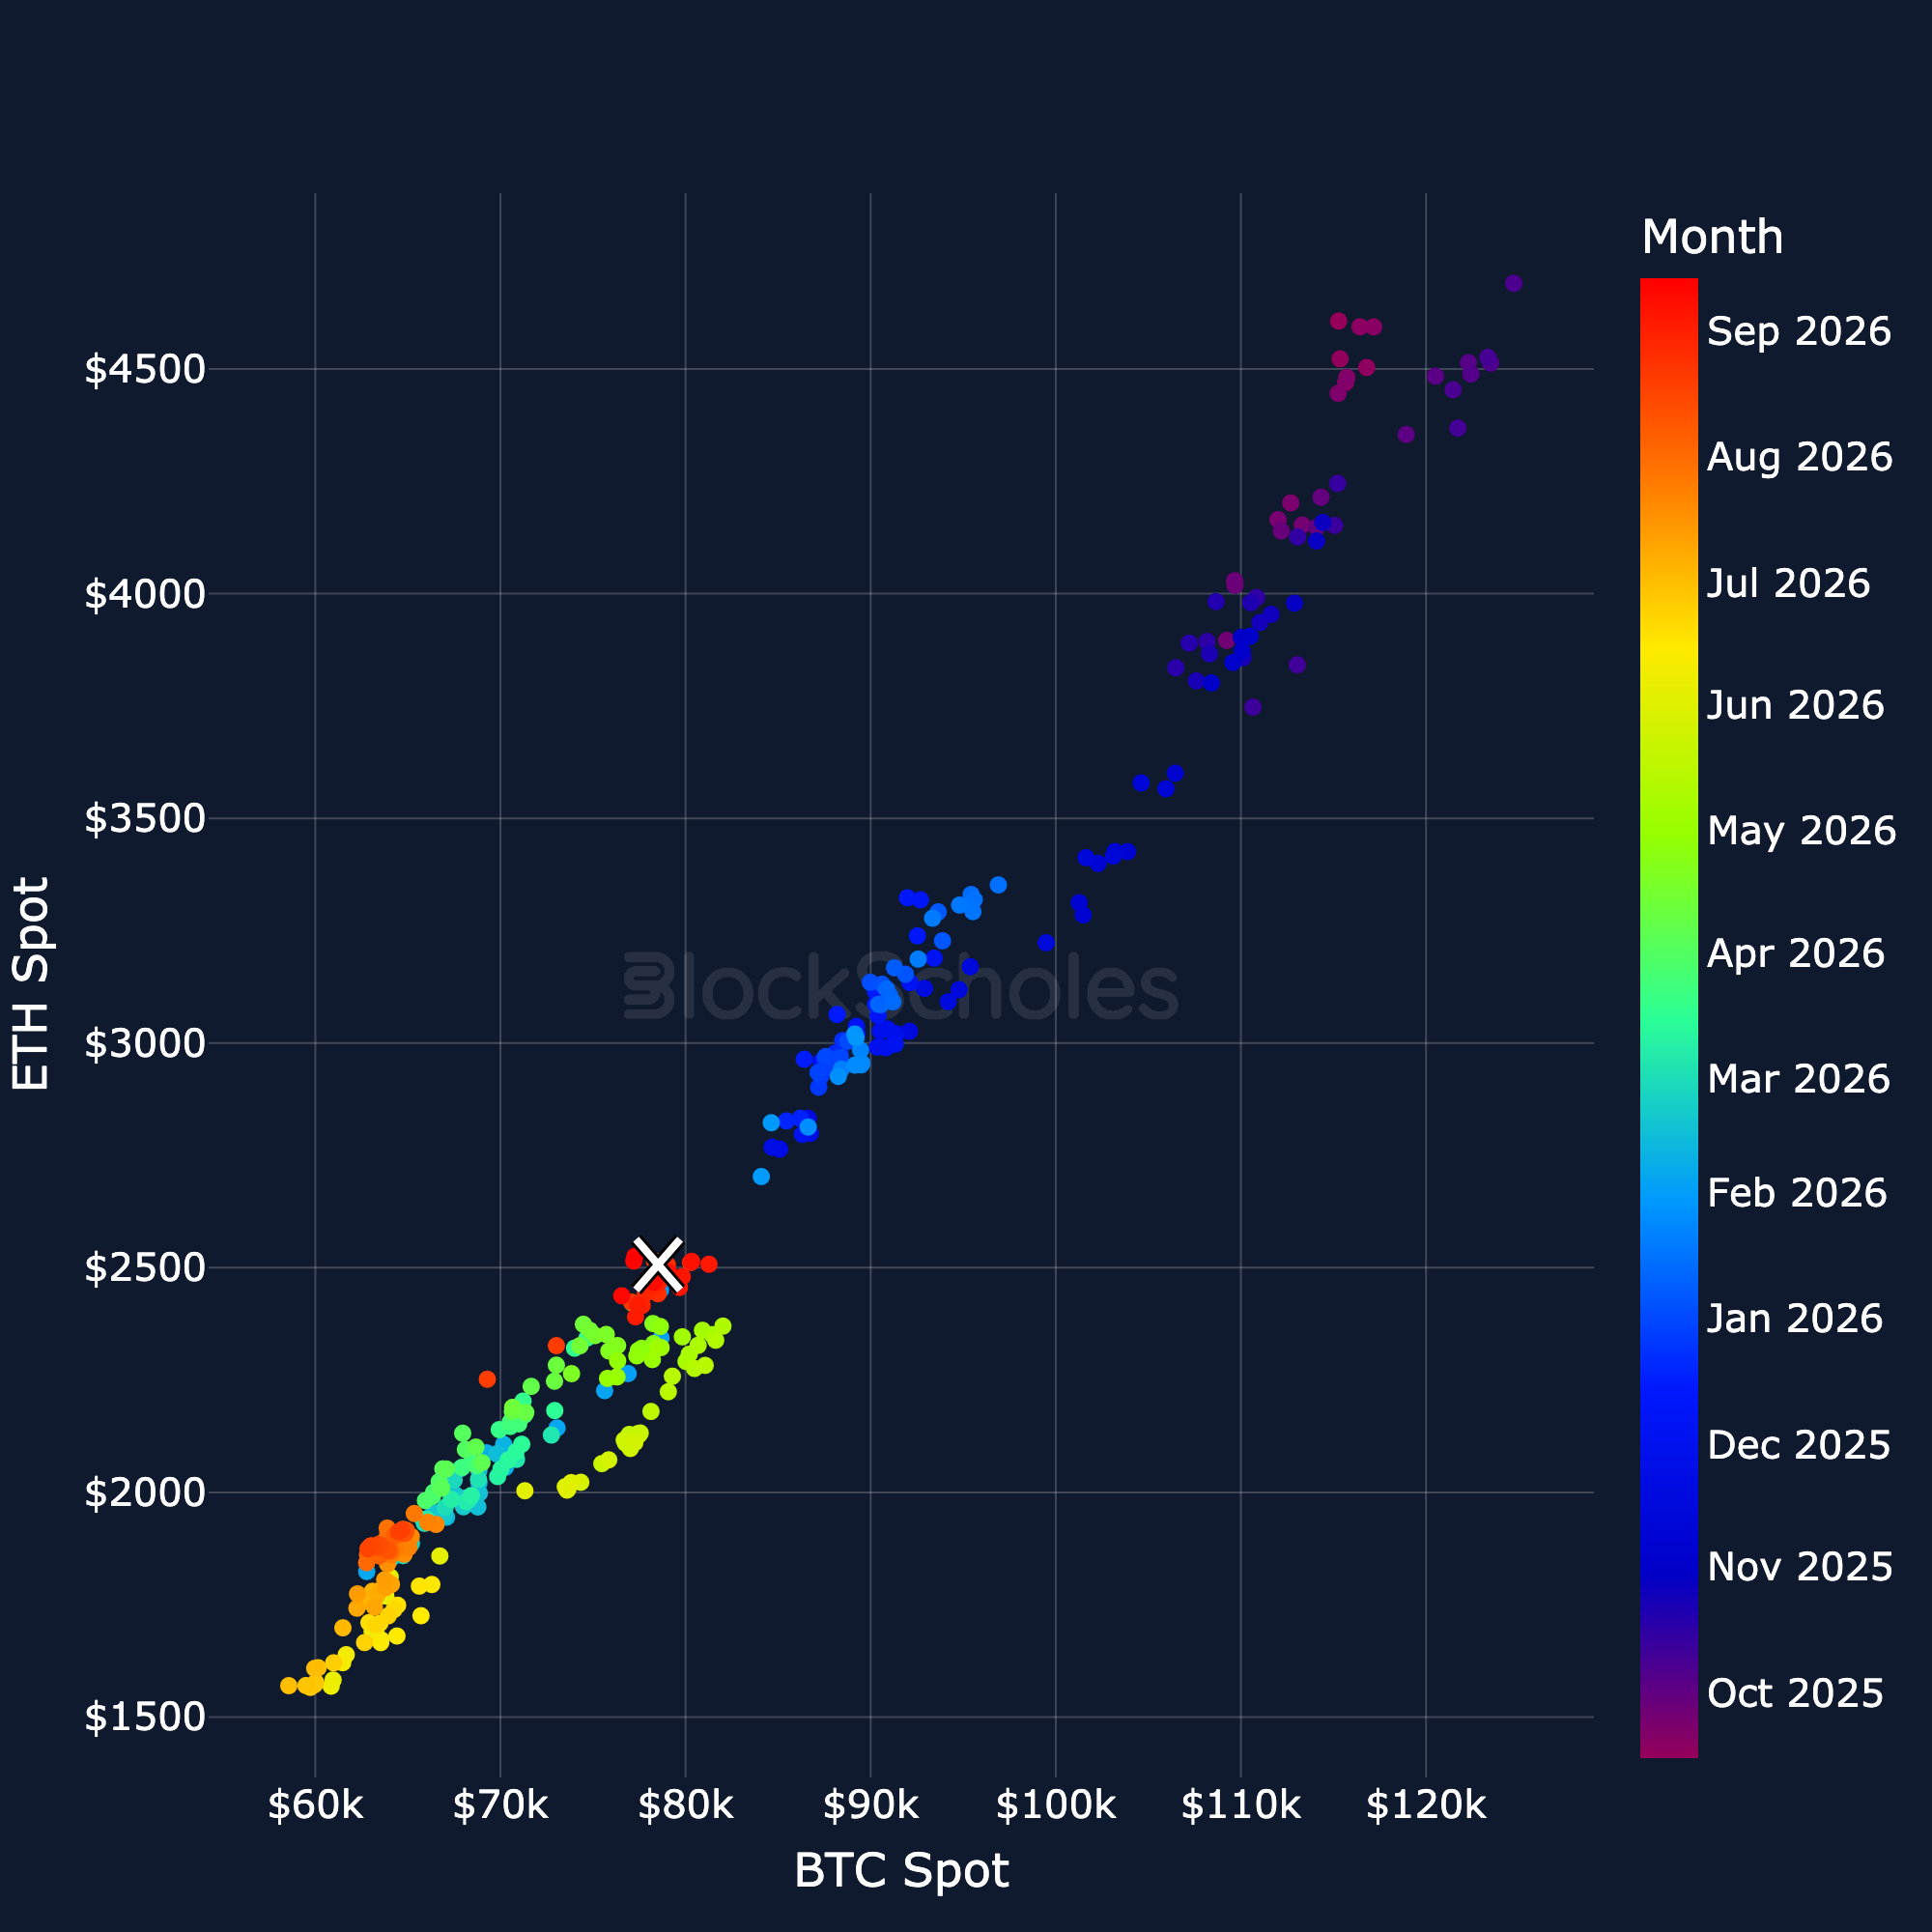
Figure 17. Net flows into spot BTC, ETH and altcoin ETFs over the latest week, as a percentage of each token's market cap. Source: SoSoValue, CoinGecko, Block Scholes.

Regression-Based Valuation vs BTC

ETH Spot vs BTC Spot regression

Figure 18. ETH spot price against BTC spot price: daily closes coloured by month, latest day marked with a cross. Source: CoinGecko, Block Scholes.
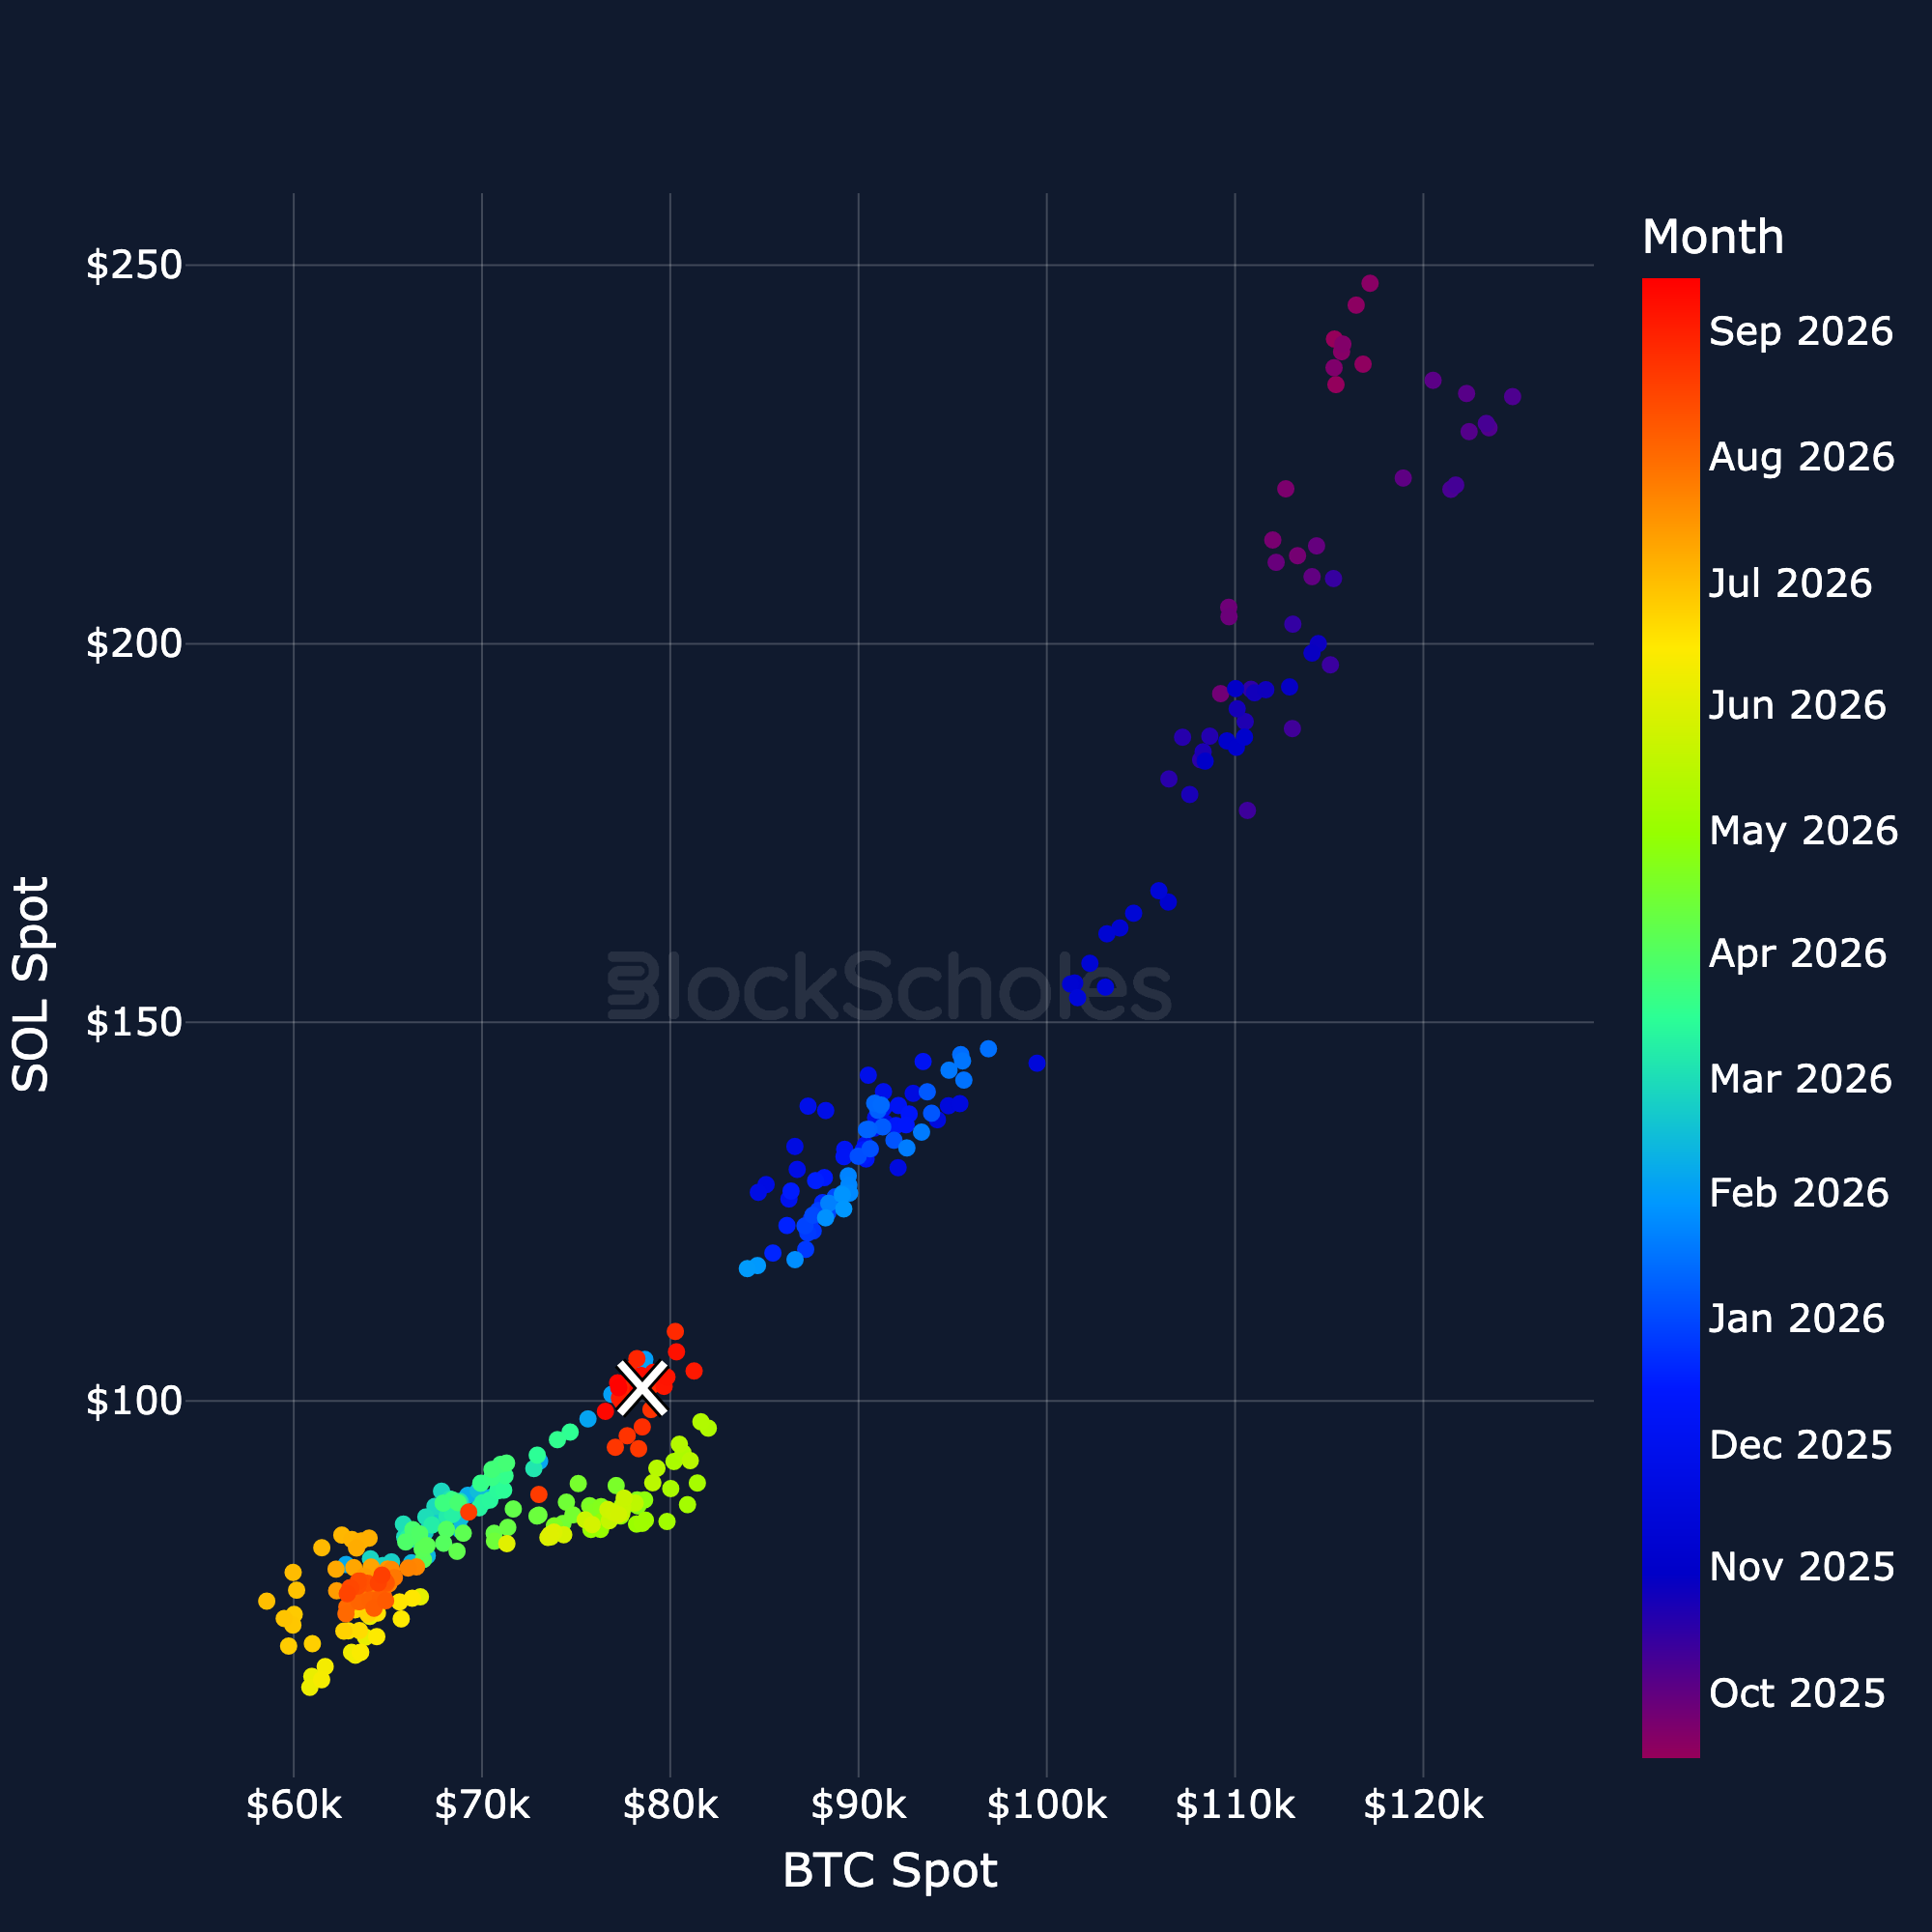
Figure 18. ETH spot price against BTC spot price: daily closes coloured by month, latest day marked with a cross. Source: CoinGecko, Block Scholes.
SOL Spot vs BTC Spot regression

Figure 19. SOL spot price against BTC spot price: daily closes coloured by month, latest day marked with a cross. Source: CoinGecko, Block Scholes.
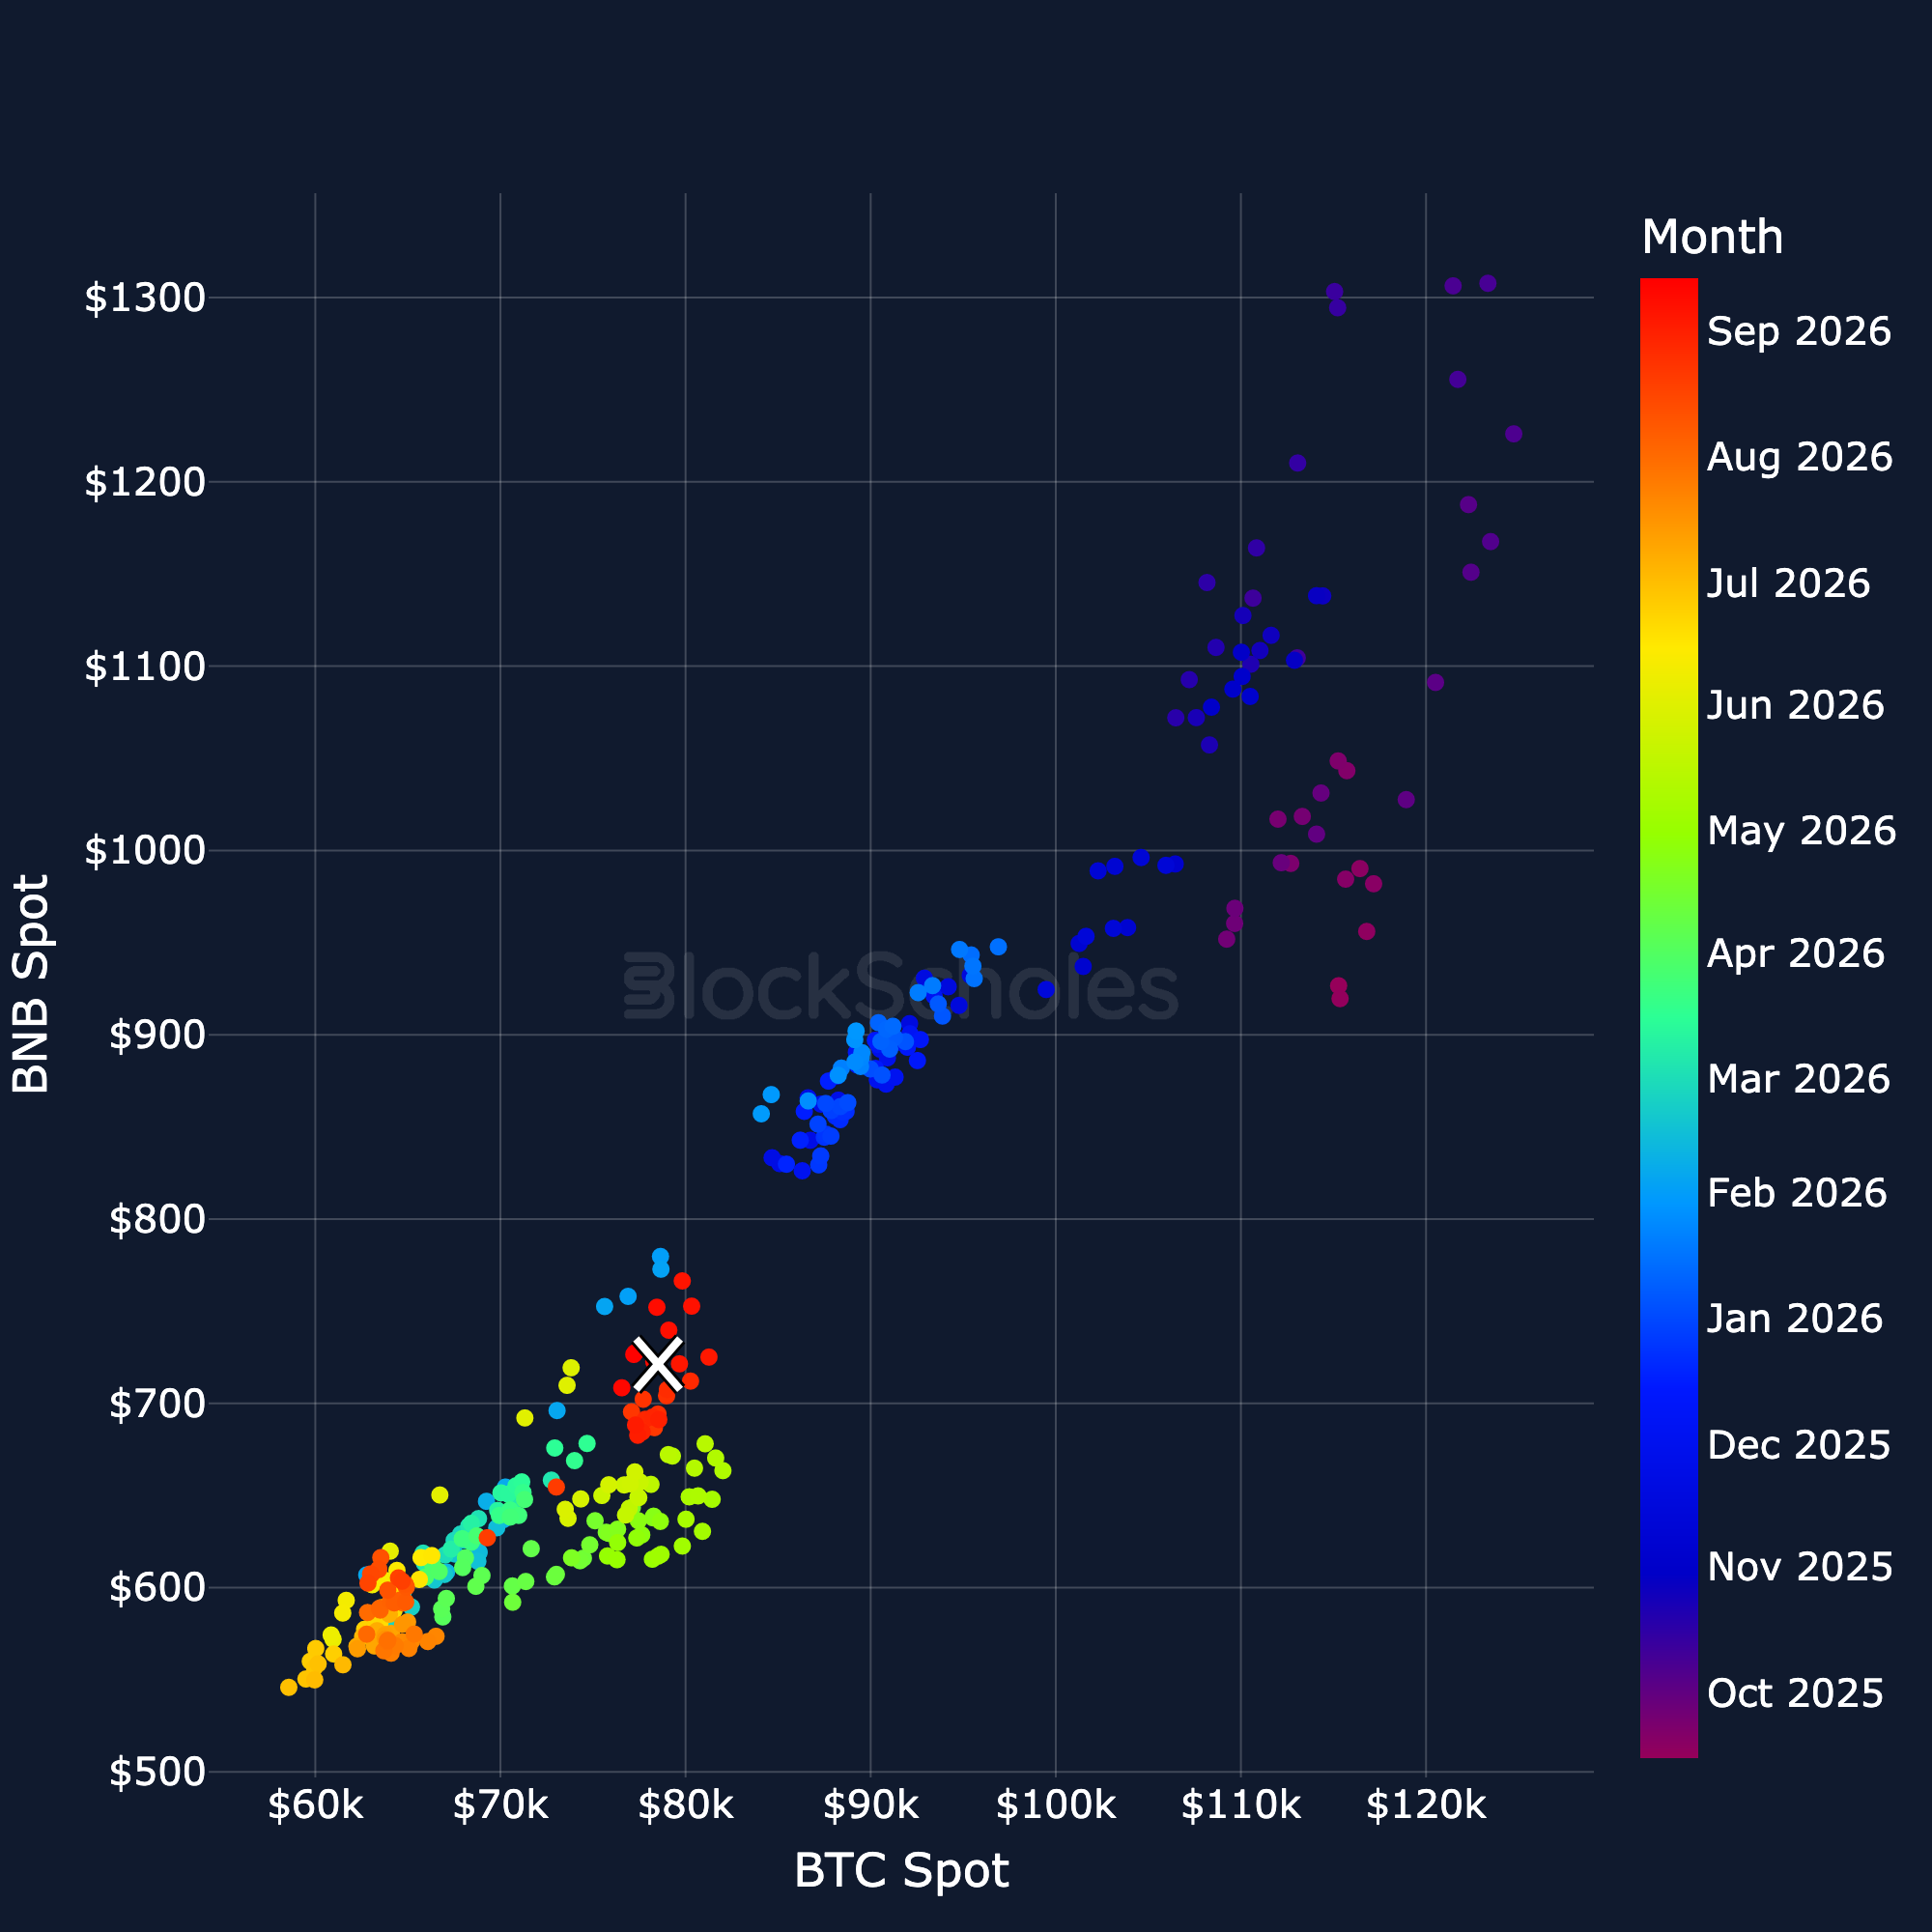
Figure 19. SOL spot price against BTC spot price: daily closes coloured by month, latest day marked with a cross. Source: CoinGecko, Block Scholes.


XRP Spot vs BTC Spot regression

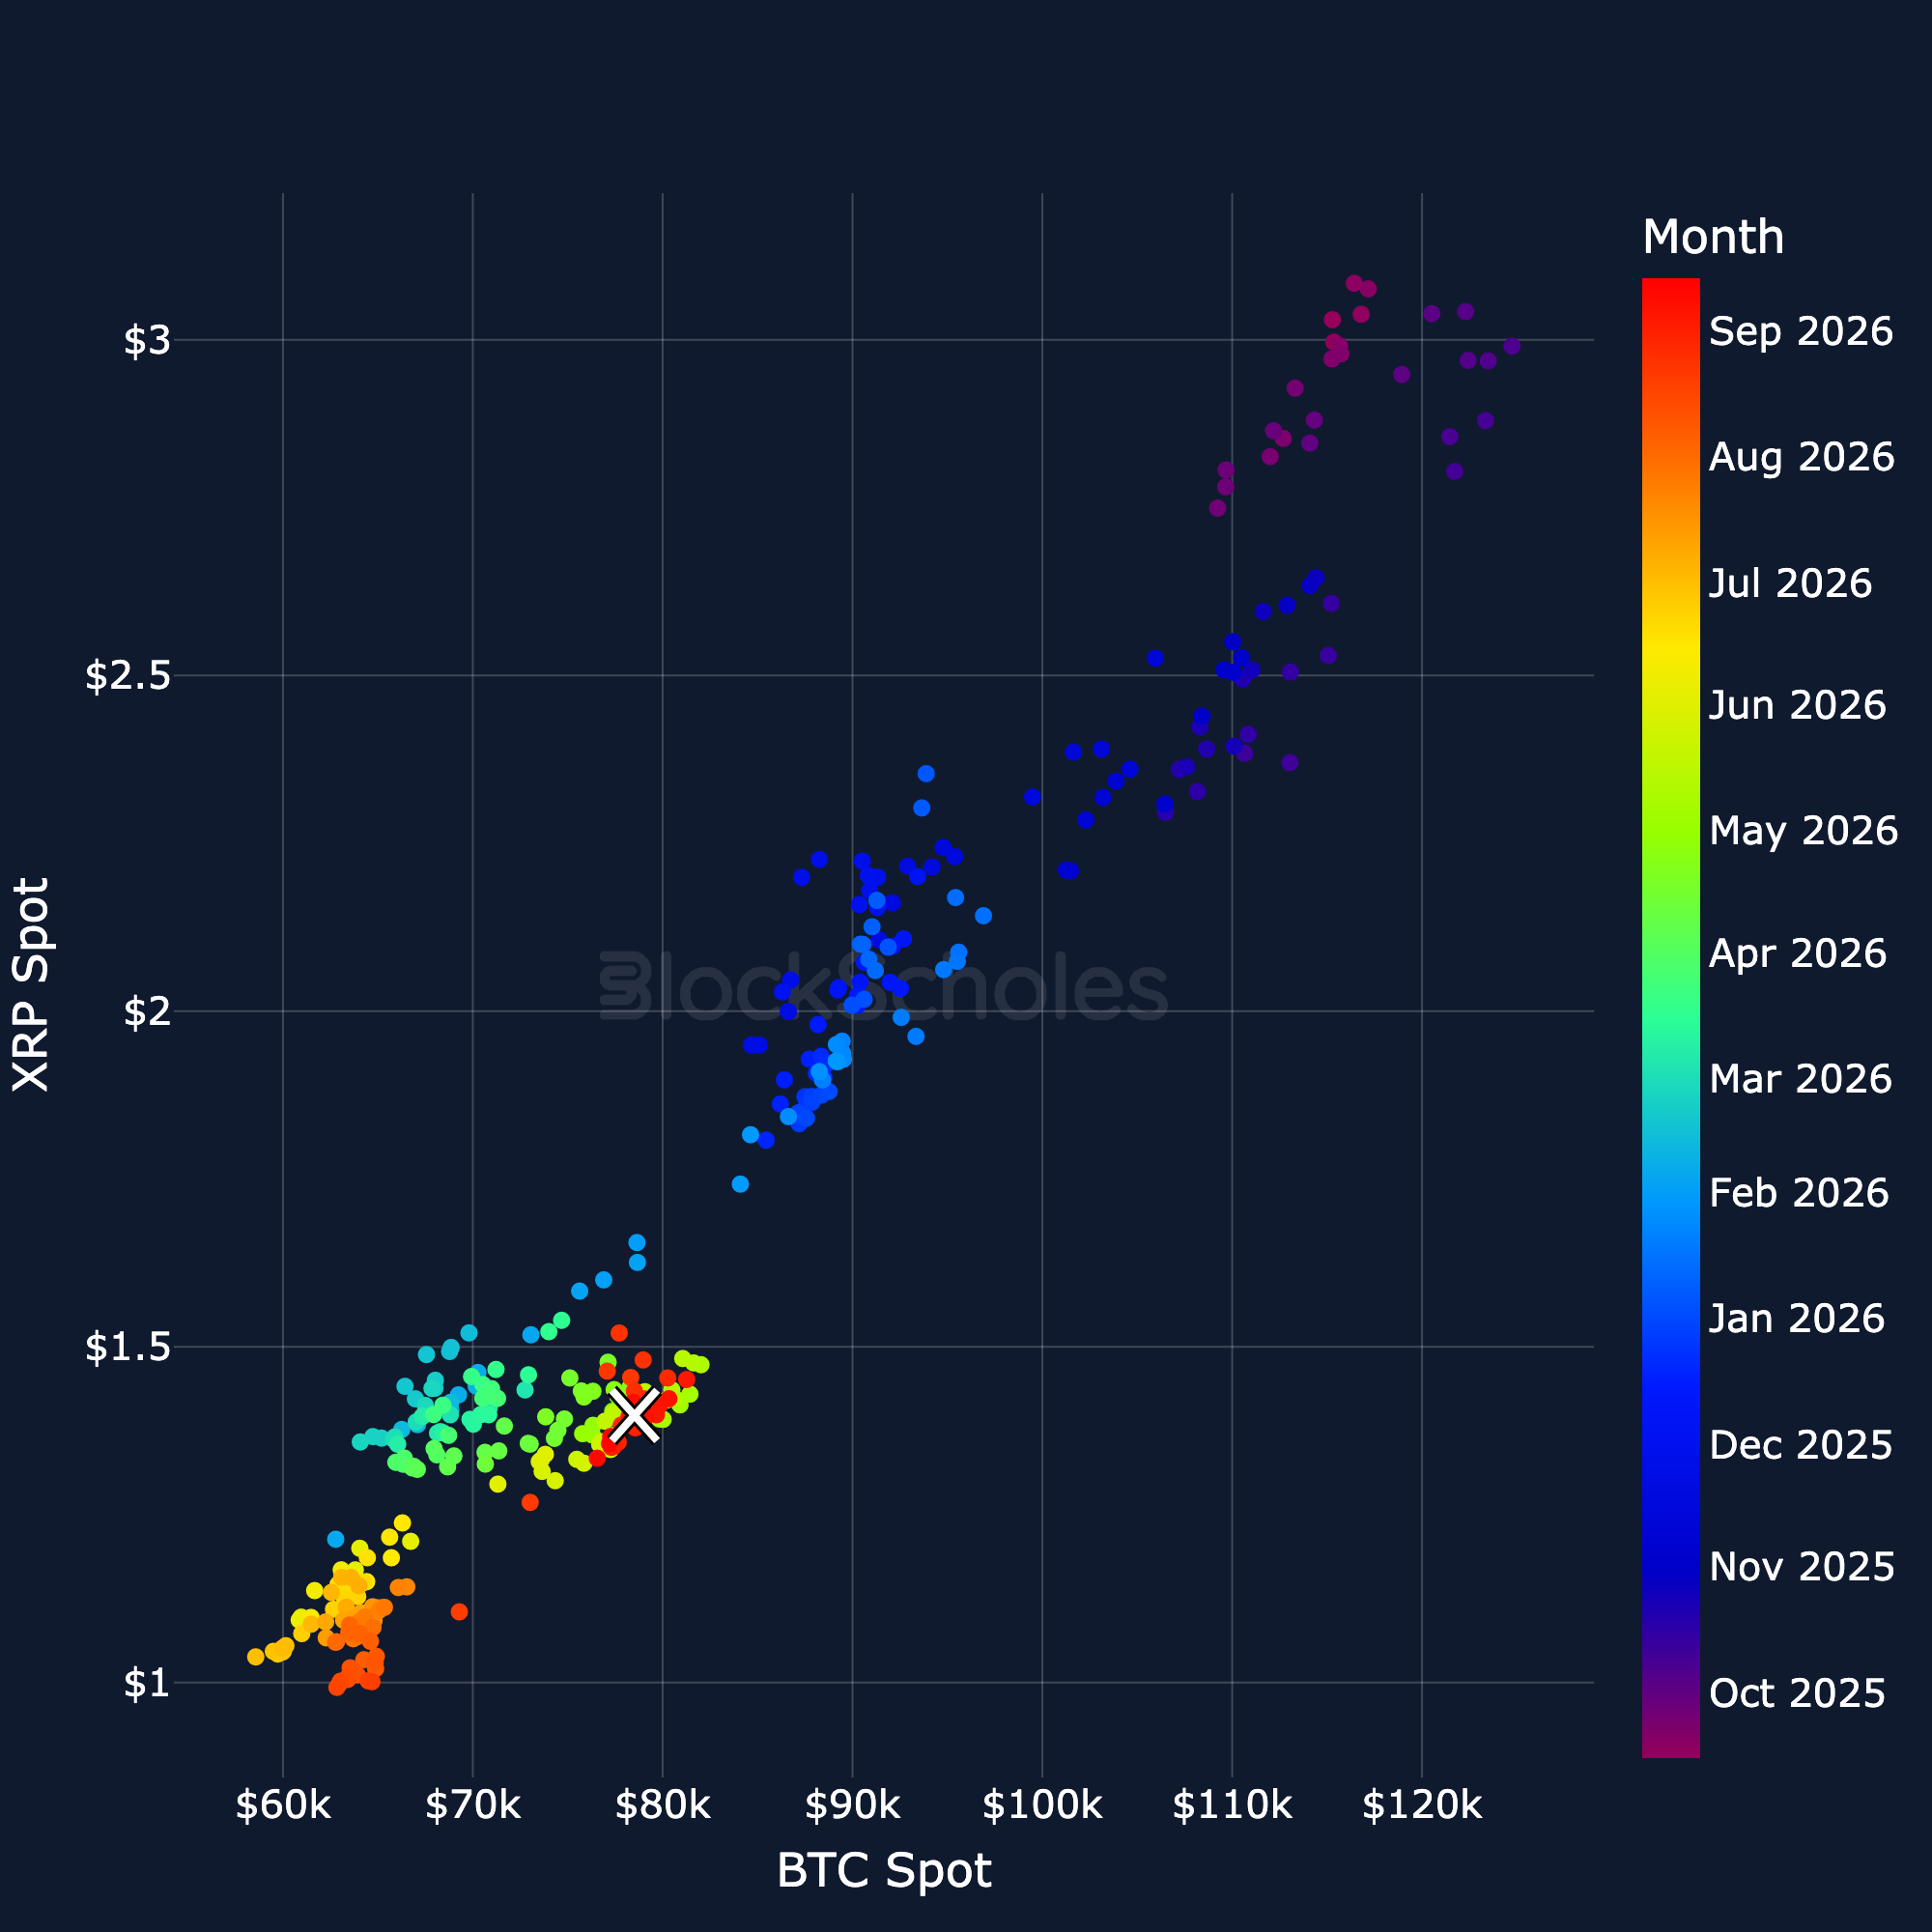
Figure 20. XRP spot price against BTC spot price: daily closes coloured by month, latest day marked with a cross. Source: CoinGecko, Block Scholes.

Figure 20. XRP spot price against BTC spot price: daily closes coloured by month, latest day marked with a cross. Source: CoinGecko, Block Scholes.

BNB Spot vs BTC Spot regression

Figure 21. BNB spot price against BTC spot price: daily closes coloured by month, latest day marked with a cross. Source: CoinGecko, Block Scholes.

Figure 21. BNB spot price against BTC spot price: daily closes coloured by month, latest day marked with a cross. Source: CoinGecko, Block Scholes.

Share this post
Copy URL
https://www.blockscholes.com/premium-research/altcoins-analytics-14th-september-2026

BTC & Altcoin Dominance

BTC Dominance

Figure 1. Bitcoin's market capitalisation as a share of the total crypto market capitalisation. Source: CoinGecko, Block Scholes.

Figure 1. Bitcoin's market capitalisation as a share of the total crypto market capitalisation. Source: CoinGecko, Block Scholes.

Altcoin Dominance

Figure 2. Market capitalisation of altcoins, excluding BTC and stablecoins, as a share of the total crypto market capitalisation. Source: CoinGecko, Block Scholes.

Figure 2. Market capitalisation of altcoins, excluding BTC and stablecoins, as a share of the total crypto market capitalisation. Source: CoinGecko, Block Scholes.

Altcoin Season Gauge (90-day lookback)

Figure 3. Share of the top-50 altcoins (current constituents) whose trailing 90-day return beats BTC's; slow-moving by construction. Source: CoinGecko, Block Scholes.

Figure 3. Share of the top-50 altcoins (current constituents) whose trailing 90-day return beats BTC's; slow-moving by construction. Source: CoinGecko, Block Scholes.

Drawdown from all-time high: BTC + top-20 altcoins by market cap

Figure 4. Percentage drawdown from each asset's all-time high for BTC and the top-20 altcoins by market cap. Source: CoinGecko, Block Scholes.

Figure 4. Percentage drawdown from each asset's all-time high for BTC and the top-20 altcoins by market cap. Source: CoinGecko, Block Scholes.

Altcoins / BTC Spot Crosses

Altcoin spot prices denominated in BTC: ETH

Figure 5. ETH spot price denominated in BTC (the ETH/BTC cross). Source: CoinGecko, Block Scholes.

Figure 5. ETH spot price denominated in BTC (the ETH/BTC cross). Source: CoinGecko, Block Scholes.

Altcoin spot prices denominated in BTC: SOL

Figure 6. SOL spot price denominated in BTC (the SOL/BTC cross). Source: CoinGecko, Block Scholes.

Figure 6. SOL spot price denominated in BTC (the SOL/BTC cross). Source: CoinGecko, Block Scholes.

Altcoin spot prices denominated in BTC: XRP

BTC & Altcoin Dominance

BTC Dominance

Figure 1. Bitcoin's market capitalisation as a share of the total crypto market capitalisation. Source: CoinGecko, Block Scholes.

Figure 1. Bitcoin's market capitalisation as a share of the total crypto market capitalisation. Source: CoinGecko, Block Scholes.

Altcoin Dominance

Figure 2. Market capitalisation of altcoins, excluding BTC and stablecoins, as a share of the total crypto market capitalisation. Source: CoinGecko, Block Scholes.

Figure 2. Market capitalisation of altcoins, excluding BTC and stablecoins, as a share of the total crypto market capitalisation. Source: CoinGecko, Block Scholes.

Altcoin Season Gauge (90-day lookback)

Figure 3. Share of the top-50 altcoins (current constituents) whose trailing 90-day return beats BTC's; slow-moving by construction. Source: CoinGecko, Block Scholes.

Figure 3. Share of the top-50 altcoins (current constituents) whose trailing 90-day return beats BTC's; slow-moving by construction. Source: CoinGecko, Block Scholes.

Drawdown from all-time high: BTC + top-20 altcoins by market cap

Figure 4. Percentage drawdown from each asset's all-time high for BTC and the top-20 altcoins by market cap. Source: CoinGecko, Block Scholes.

Figure 4. Percentage drawdown from each asset's all-time high for BTC and the top-20 altcoins by market cap. Source: CoinGecko, Block Scholes.

Altcoins / BTC Spot Crosses

Altcoin spot prices denominated in BTC: ETH

Figure 5. ETH spot price denominated in BTC (the ETH/BTC cross). Source: CoinGecko, Block Scholes.

Figure 5. ETH spot price denominated in BTC (the ETH/BTC cross). Source: CoinGecko, Block Scholes.

Altcoin spot prices denominated in BTC: SOL

Figure 6. SOL spot price denominated in BTC (the SOL/BTC cross). Source: CoinGecko, Block Scholes.

Figure 6. SOL spot price denominated in BTC (the SOL/BTC cross). Source: CoinGecko, Block Scholes.

Altcoin spot prices denominated in BTC: XRP