
Thahbib Rahman
Research Analyst
This week's edition of our Market Sentiment Report.

Our Risk Appetite Index continues to move lower and out of the region that has historically marked more bullish price action. The past week has seen BTC struggle to find a driver to break it out of the $80K range it has consolidated around, though spot Bitcoin ETFs are showing tentative signs of supporting price.

Figure 1. Block Scholes BTC Risk-Appetite Index (white, left axis) against the BTC spot price (right axis). Source: Block Scholes.
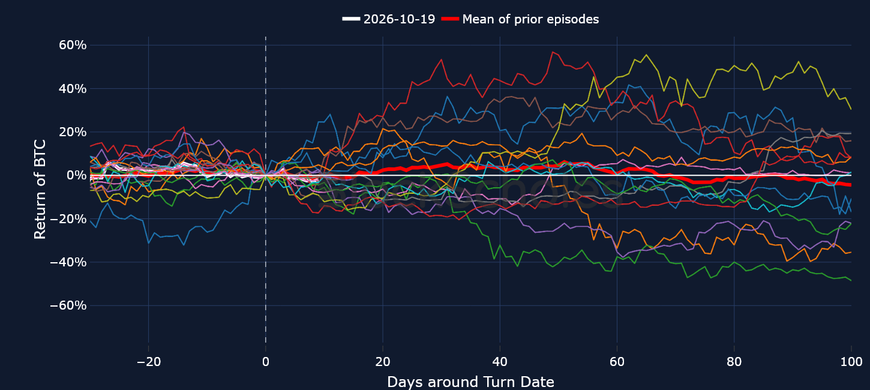
Figure 2. BTC spot returns in the days around each time the BTC Risk-Appetite Index crossed down through 1.0, with the current episode in white and the mean of prior episodes in red. Source: Block Scholes.
Sentiment has fallen far faster in ETH than it has in BTC, with our Risk Appetite Index now on its way below 0.5. ETH has struggled in October, down more than 13% over the past 30 days, with spot ETFs providing very little to cushion the blow.
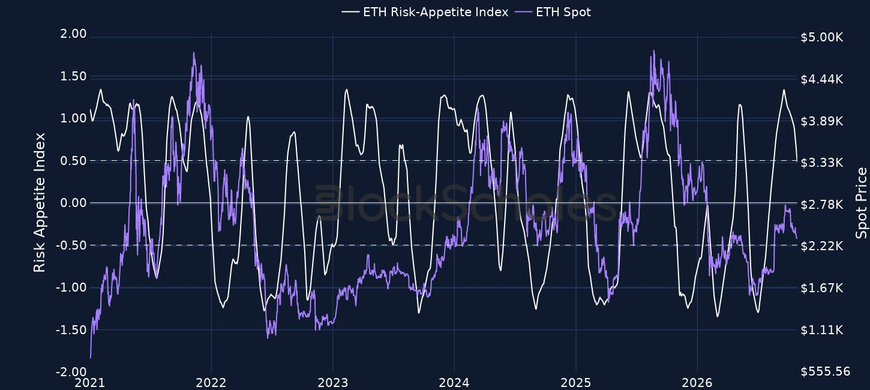
Figure 3. Block Scholes ETH Risk-Appetite Index (white, left axis) against the ETH spot price (right axis). Source: Block Scholes.

Figure 4. ETH spot returns in the days around each time the ETH Risk-Appetite Index crossed down through 1.0, with the current episode in white and the mean of prior episodes in red. Source: Block Scholes.
Data behind Risk Appetite charts: BlockScholes BTC/ETH/SOL/SUI/XRP composite spot index price. Available via the BlockScholes REST API.

Figure 5. Block Scholes Altcoin Risk-Appetite Index (white, left axis) against altcoin market capitalisation (right axis). Source: Block Scholes.

Figure 6. Block Scholes XRP Risk-Appetite Index (white, left axis) against the XRP spot price (right axis). Source: Block Scholes.
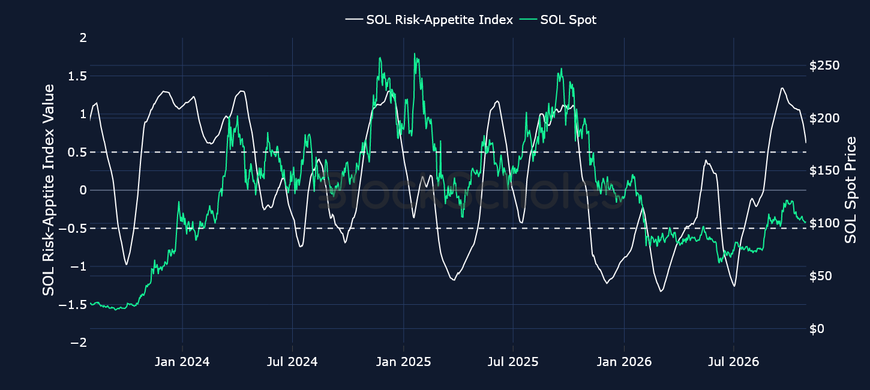
Figure 7. Block Scholes SUI Risk-Appetite Index (white, left axis) against the SUI spot price (right axis). Source: Block Scholes.

Figure 8. Block Scholes SOL Risk-Appetite Index (white, left axis) against the SOL spot price (right axis). Source: Block Scholes.