Andrew Melville
Head of Research
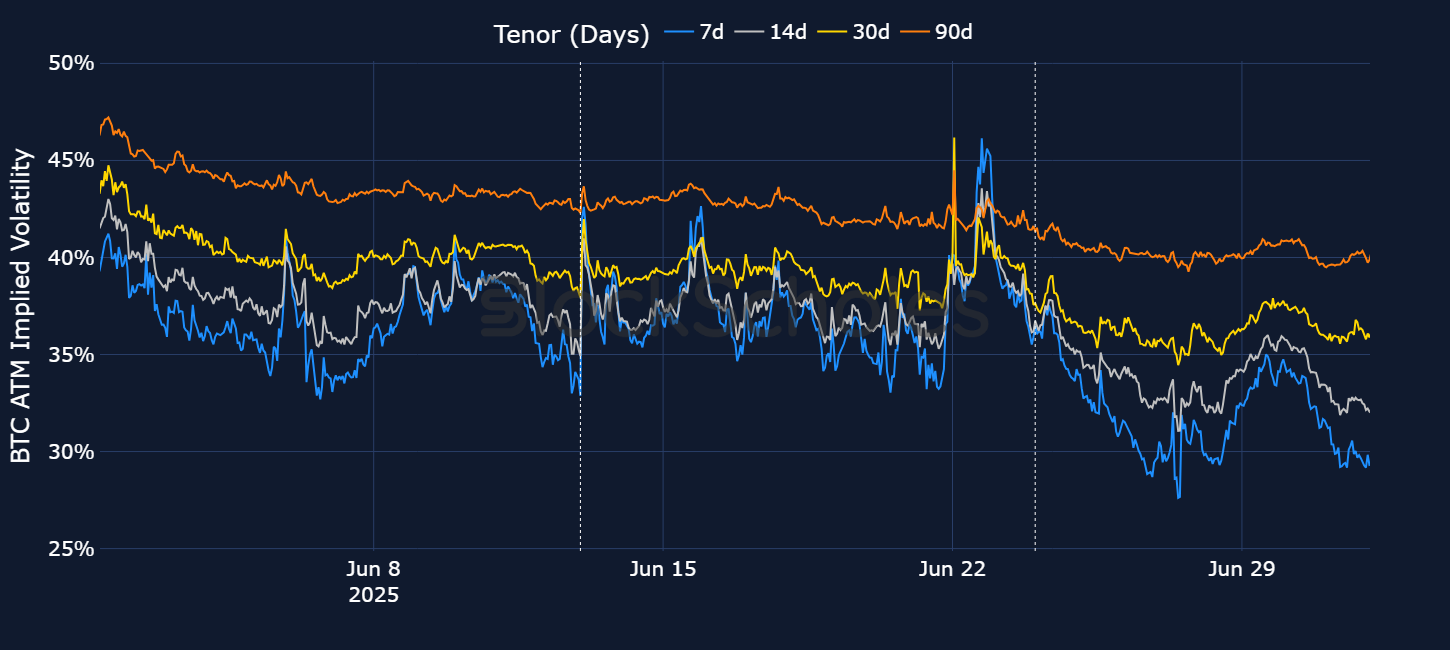
In February this year, the volatility implied by BTC options rose to the highest level since the collapse of the FTX exchange in 2022, exceeding 100% for 7-day options contracts. After reaching that high, the demand for optionality dropped significantly, with ATM implied volatility finding a floor closer to 50% across the term structure (to access implied volatility surface data by delta see here). Volatility expectations were then reignited in the tail-end of February after the US announced military airstrikes against Iran, with 7-day volatility jumping 20 percentage points to 70%.

In February this year, the volatility implied by BTC options rose to the highest level since the collapse of the FTX exchange in 2022, exceeding 100% for 7-day options contracts.
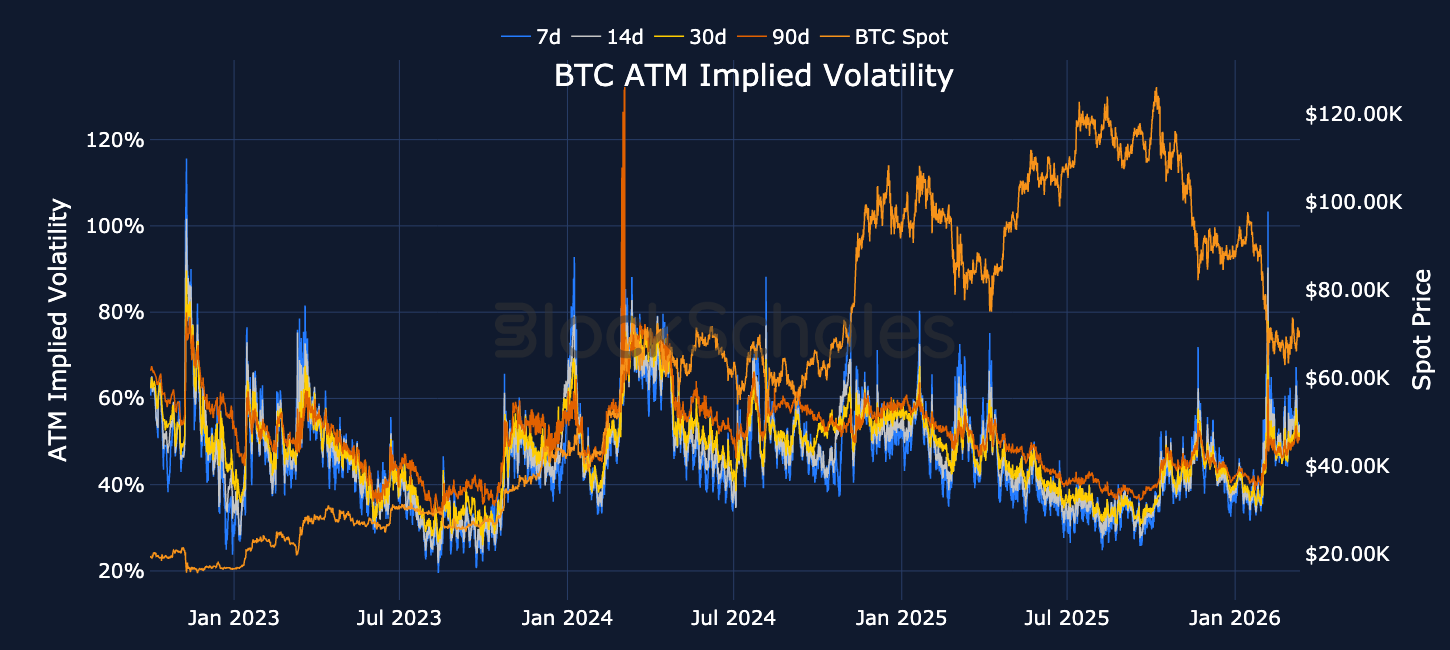
After reaching that high, the demand for optionality dropped significantly, with ATM implied volatility finding a floor closer to 50% across the term structure (to access implied volatility surface data by delta see here). Volatility expectations were then reignited in the tail-end of February after the US announced military airstrikes against Iran, with 7-day volatility jumping 20 percentage points to 70%.
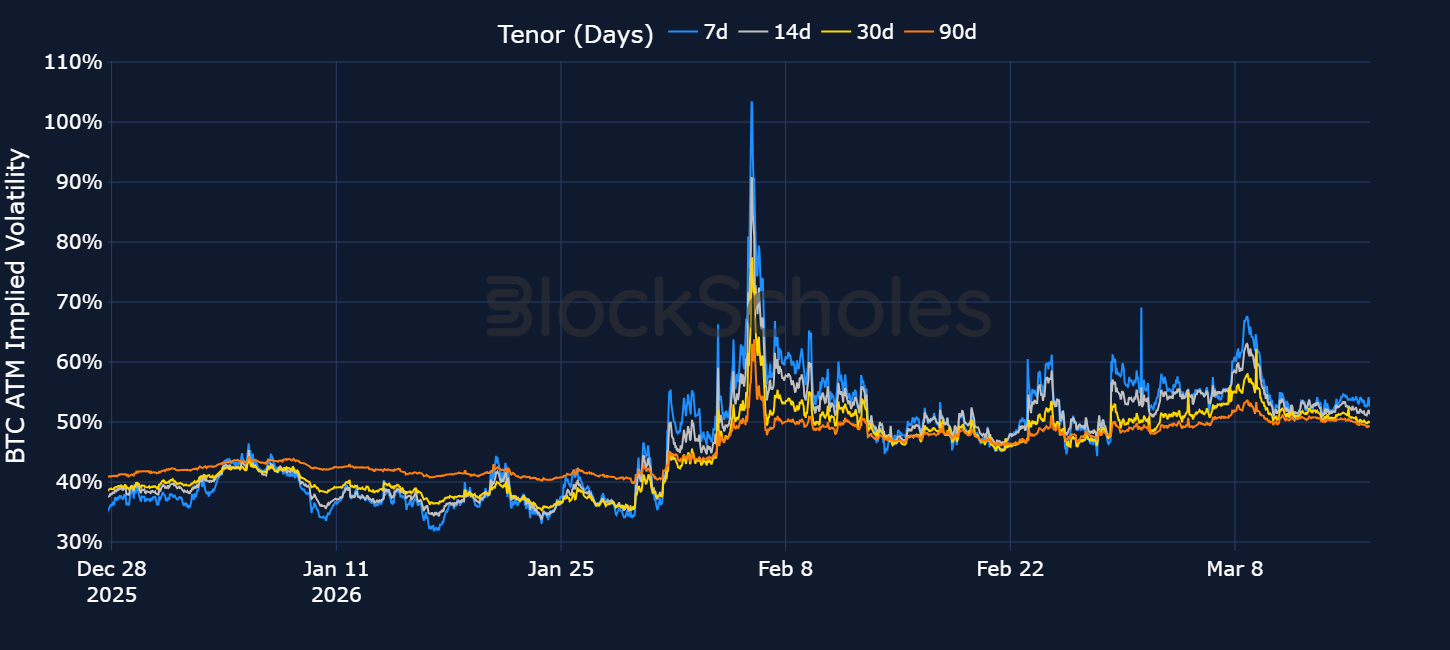
However, despite the war in the Middle East continuing into a third week, that jump in BTC implied volatility proved to be very short-lived. IV quickly snapped back down to 50% and overall, options demand has been relatively low given the nature of the geopolitical risk and relative to the early February highs.
Historical cases of geopolitical flareups between the US and Iran underscore the fact that oil markets are clearly treating the most recent escalation in the Middle East as one of higher severity relative to previous tensions between the two nations.
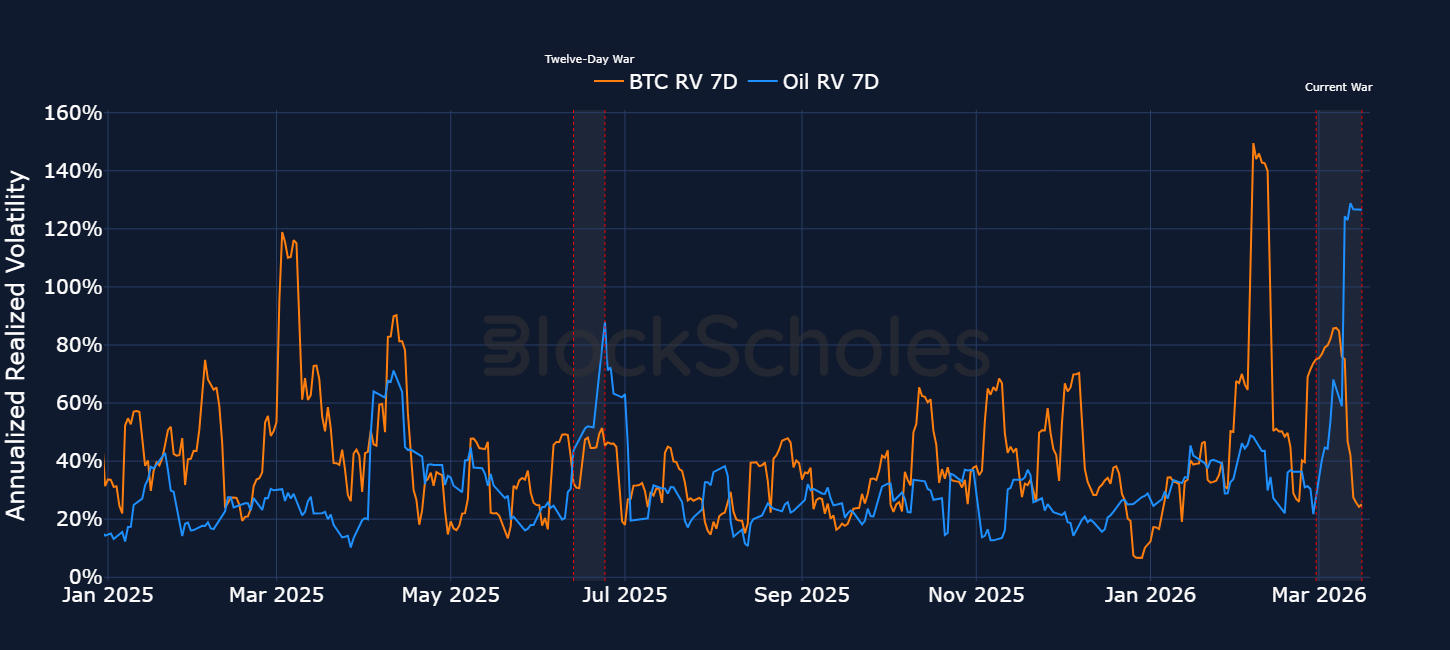
In the chart below we calculate 7-day realised volatility for WTI crude oil futures and BTC (using daily closing price data). Additionally, we overlay three other key periods of tension over the past decade between the US and Iran:
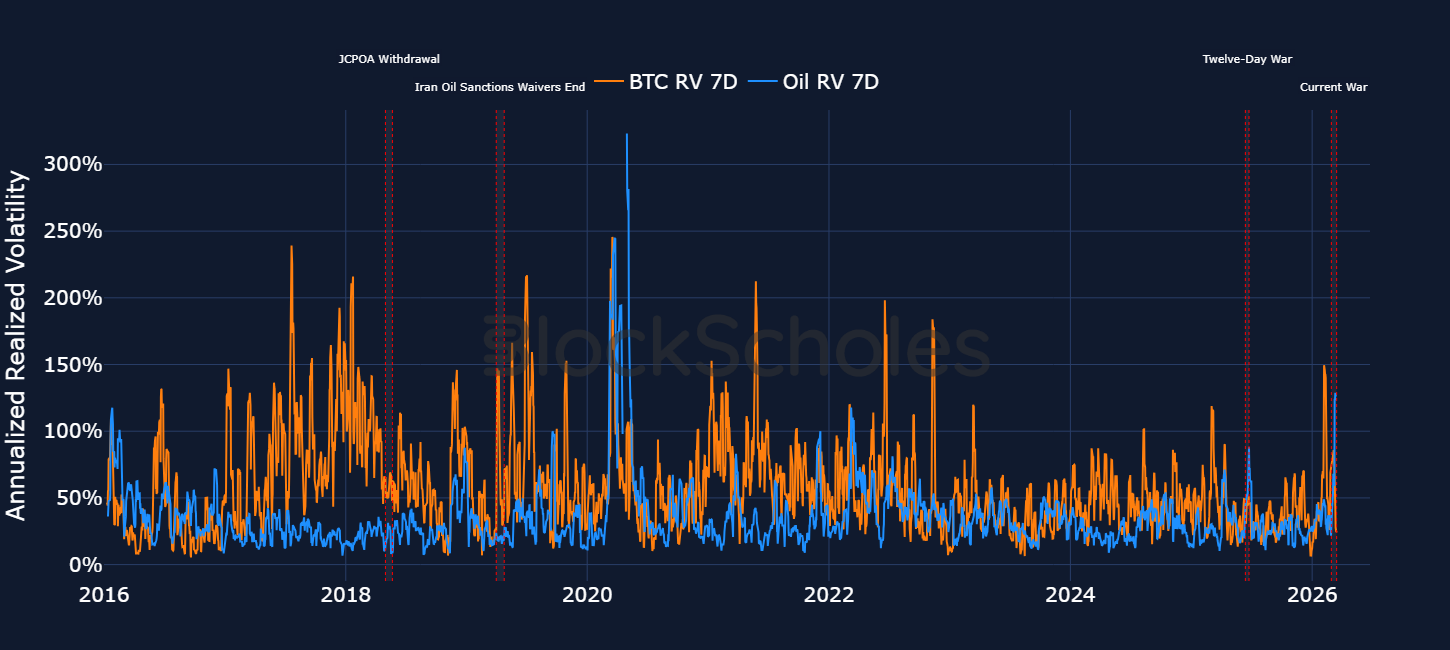
Figure 3. 7-day realized volatility (on daily returns) for BTC (orange) and WTI crude Oil futures (blue). Source: Bloomberg
In the most recent tensions flare-up, Oil’s 7-day delivered volatility in oil futures actually preceded President Trump’s first public announcement that the US had launched military airstrikes in Iran. Between Feb 26, 2026 and March 2, 2026, 7-day realised volatility increased by more than 7x from 6.1% to 47.4%. However, as the military response has continued — and perhaps more importantly for oil prices — as the passing of oil tankers through the Strait of Hormuz has come to an effective halt, realised volatility is now around 149% (a level last seen in May 2020).
By contrast, between the start of the Twelve-Day war and when the US announced it had entered the conflict by striking nuclear facilities in Iran on June 24, 2025, 7-day volatility in oil futures rose from 30% to 88%. While still a significant jump, that’s a little over half the volatility with which oil prices are currently trading with. Oil markets are clearly treating this case differently and perhaps rightly so — in the Twelve-Day war for example, Iran did not close the Strait of Hormuz.
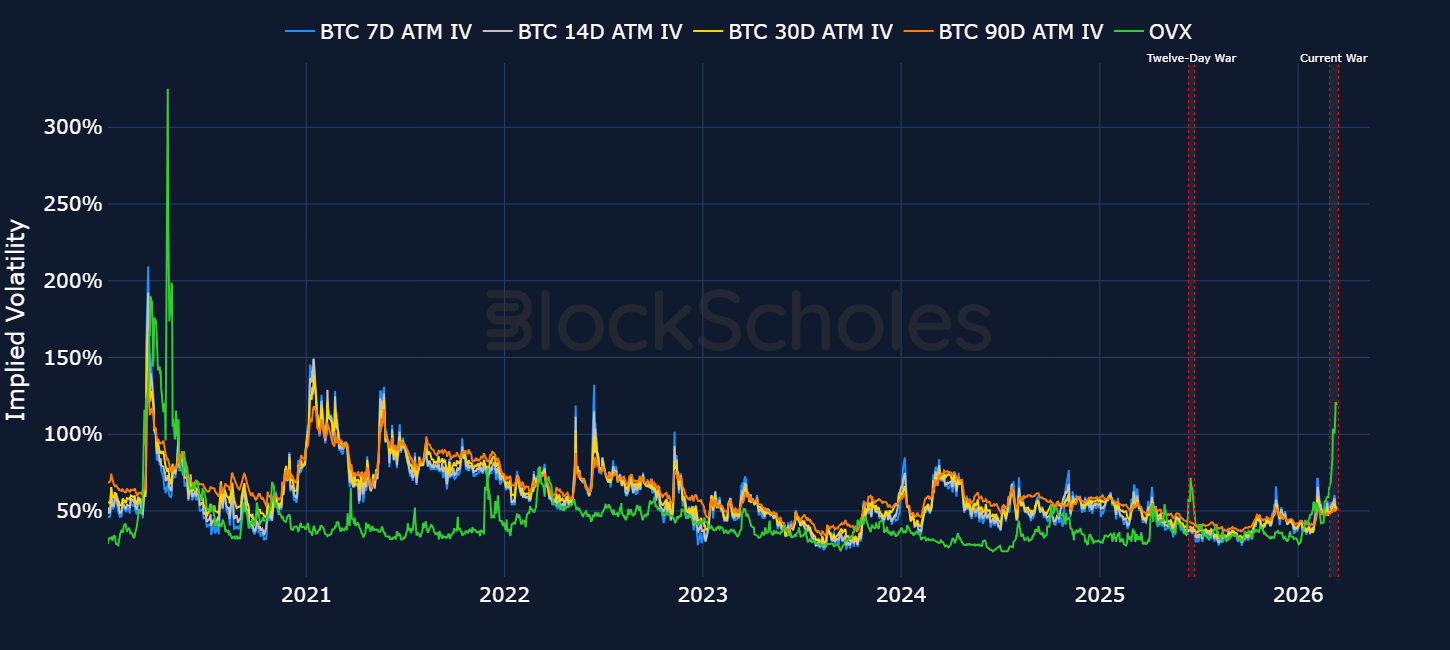
Given the multi-year high in the realised volatility of oil prices, it is unsurprising that the volatility implied by oil options contracts is also at its highest since May 2020. Below we plot daily at-the-money implied volatility for BTC options at constant tenors alongside the CBOE Crude Oil ETF Volatility Index (OVX). The OVX is a measure of the market's expectation of 30-day volatility for oil prices, derived from options contracts on the United States Oil Fund, an ETF which tracks the price of WTI crude oil futures. The implied volatility in oil options contracts is currently around 108%, relative to the 66% peak during the Twelve-Day war.
The multi-year highs in delivered and implied volatility in oil contrasts the more mellow response in BTC. However, looking back at previous escalations between the US and Iran, BTC’s lack of a reaction function to the current war is to be somewhat expected. During the Twelve-Day war, delivered volatility (calculated on daily closing price) rose by around 20 percentage points from the start of the conflict to 50%. That was far below the volatility delivered by spot price earlier in the year during other geopolitical tensions, for example during the tariff escalation between the US and China in February 2025, or the Liberation Day tariffs of April 2025.
BTC options traders also mostly looked through tensions during the Twelve-Day war. Implied volatility jumped around 10 points to 46% when the US struck Iranian nuclear sites, though that is far below the implied volatility priced in by options markets in historic periods of crisis.
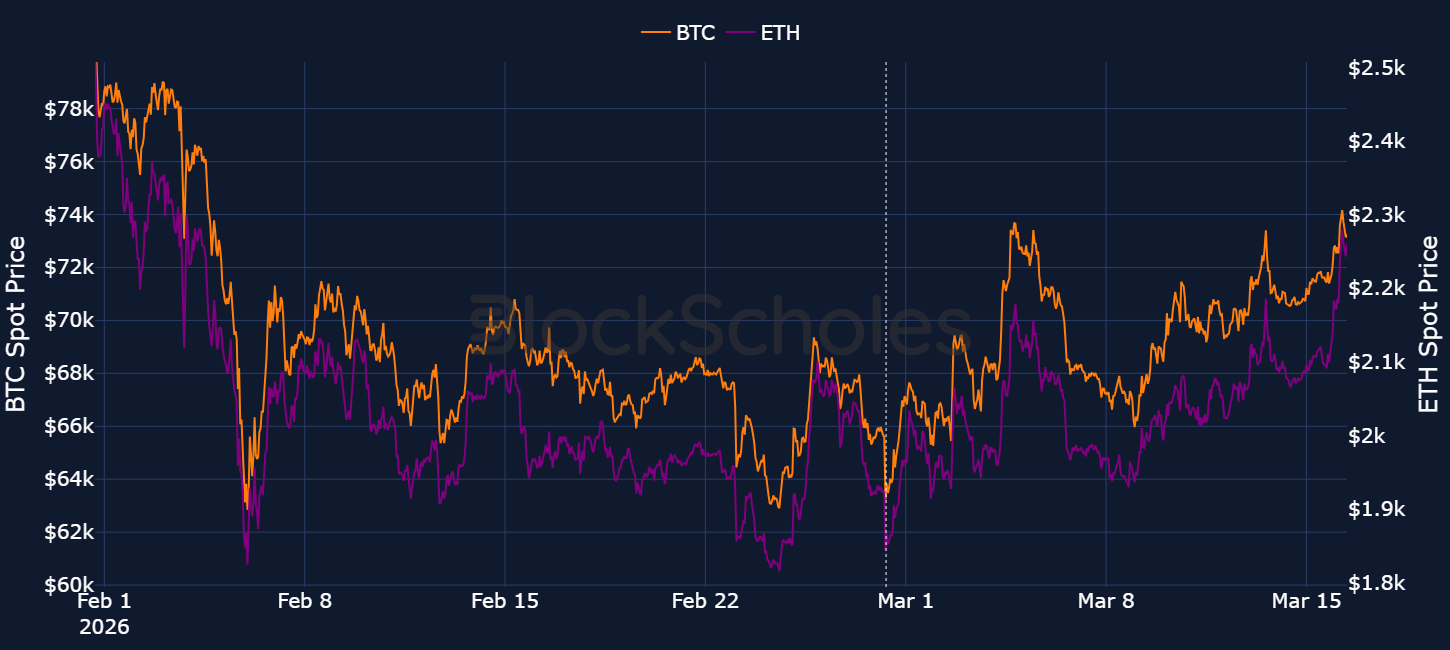
This time around, since Trump’s first announcement that the US had launched preliminary airstrikes in Iran, realised volatility has jumped by a lesser 10 vol points from 75% to 85%. In fact, for BTC, much of the move higher in realised volatility took place prior to the commencement of the airstrikes. Between Feb 22 and Feb 27, 2026 7-day volatility nearly tripled as BTC spot price plunged from $69K to $62K before recovering back to $70K within the space of a few days.
We can zoom in on this particular period using more granular data also. Below we again plot 7-day realised volatility, but this time on hourly data (from Block Scholes’ composite spot data aggregated from different exchanges) and hourly prices on CL-USDC — a perpetual futures contract that tracks the value of 1 barrel of West Texas Intermediate (WTI) Light Sweet Crude Oil, deployed by the XYZ protocol on Hyperliquid.
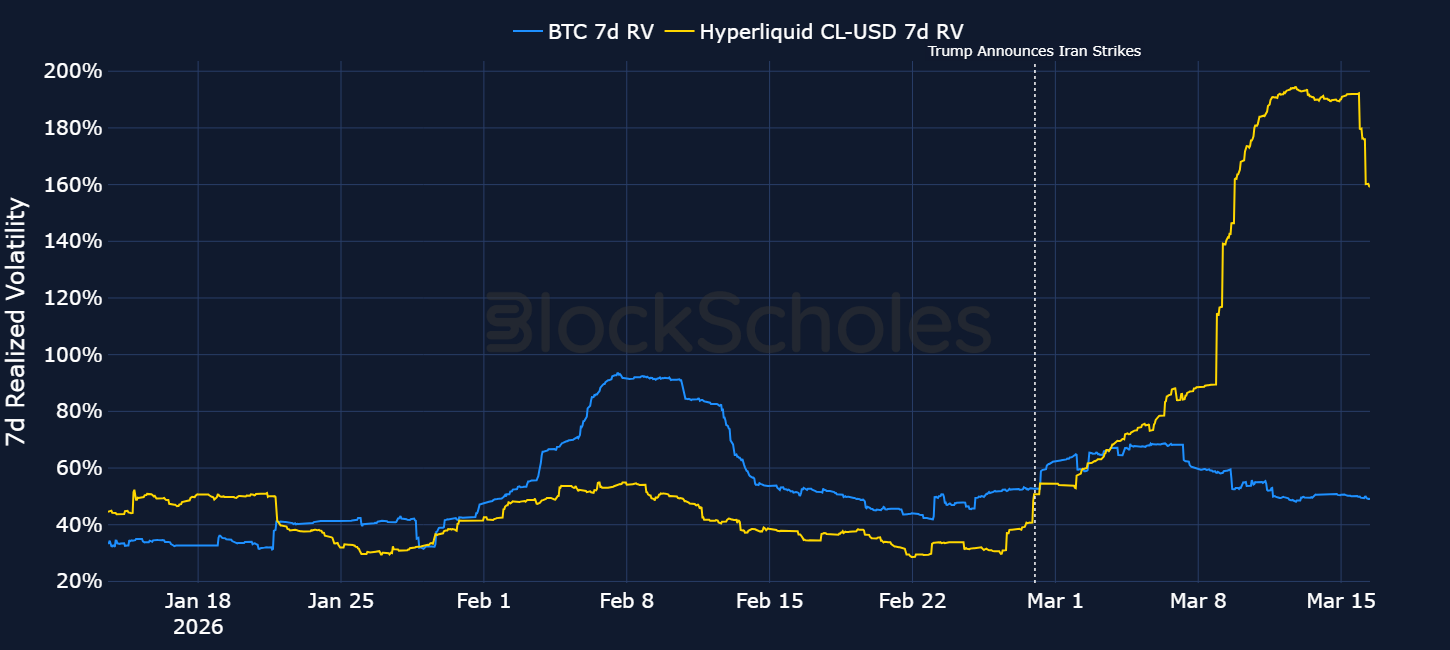
Between Feb 22 and Feb 27, realised volatility (on hourly spot log returns) rose from 42% to 53%, while over the weekend of the strike announcements, delivered vol jumped by a slightly larger amount of 53% to 65%. Still, that move was short-lived, and 7-day vol quickly fell back to pre-strike levels.
Despite still being down more than 40% from its all-time high, BTC has shown significant strength in the face of the geopolitical shock. Since the first weekend airstrikes, spot price has slowly moved higher from $63K to $73K. We’ve also shown that the premium in short-dated BTC options, or how much traders are willing to pay for optionality, has been easing over the same period of time.
The recovery in spot price has occurred alongside a rebound in the 25-delta risk reversal (put-call skew ratio). This can be accessed here and is defined as the IV of a 25-delta call minus the IV of a 25-delta put.
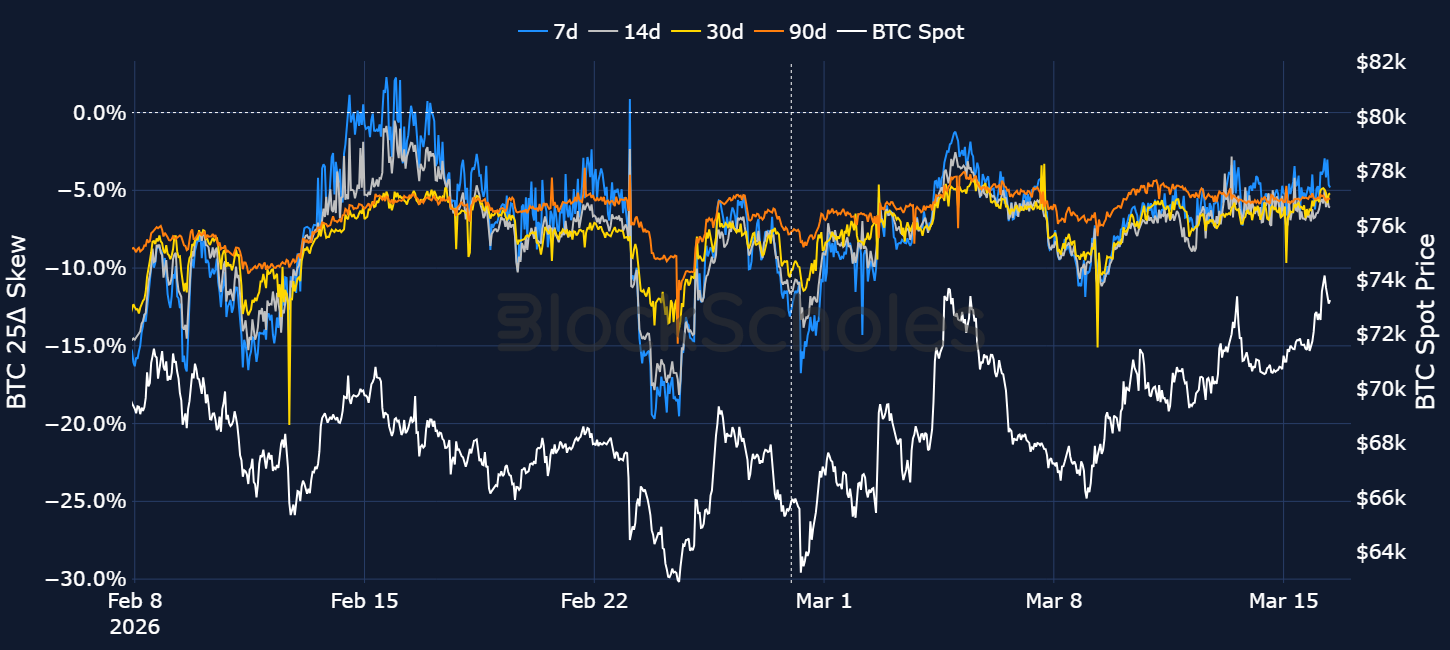
While the 25-delta put-call skew ratio is still negative (put options trading at a volatility premium to call options), we note two things:
Taken together, the slow recovery in spot price, the easing in short-tenor volatility and the normalisation in skew all suggest the crypto market is showing signs of being in a stabilisation and modest recovery period despite ongoing geopolitical tensions.
With BTC’s spot price now trading around $73K, what are options markets pricing-in for over the upcoming months. Has that changed since the onset of the US’s war in Iran?
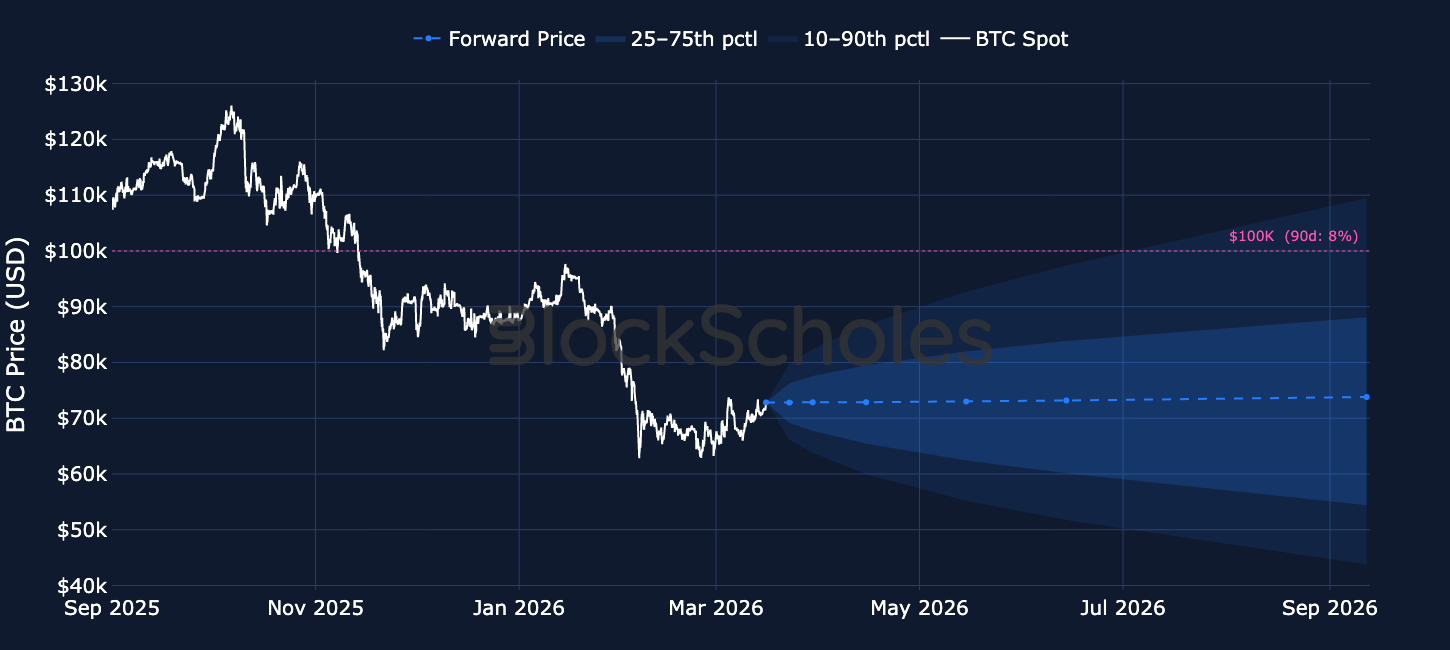
Note that in the above charts we show the forward price, which is distinct from the median path of the options price-implied price levels.
In the fan chart above, we show BTC’s realised price path to today (in white) before the distribution of prices implied by market options prices (the shaded regions) over the next six months – the shaded regions highlight (in light and dark blue respectively) the 25th percentile and 10th percentile rally and sell off regions respectively. While the forward curve implies that traders are expecting a continuation of the sideways slogs we’ve seen interspersed by volatile selloffs in early 2026, it is the spread of the fan that is more interesting. The market now implies an 8% probability of BTC reclaiming $100K over the next 90 days.
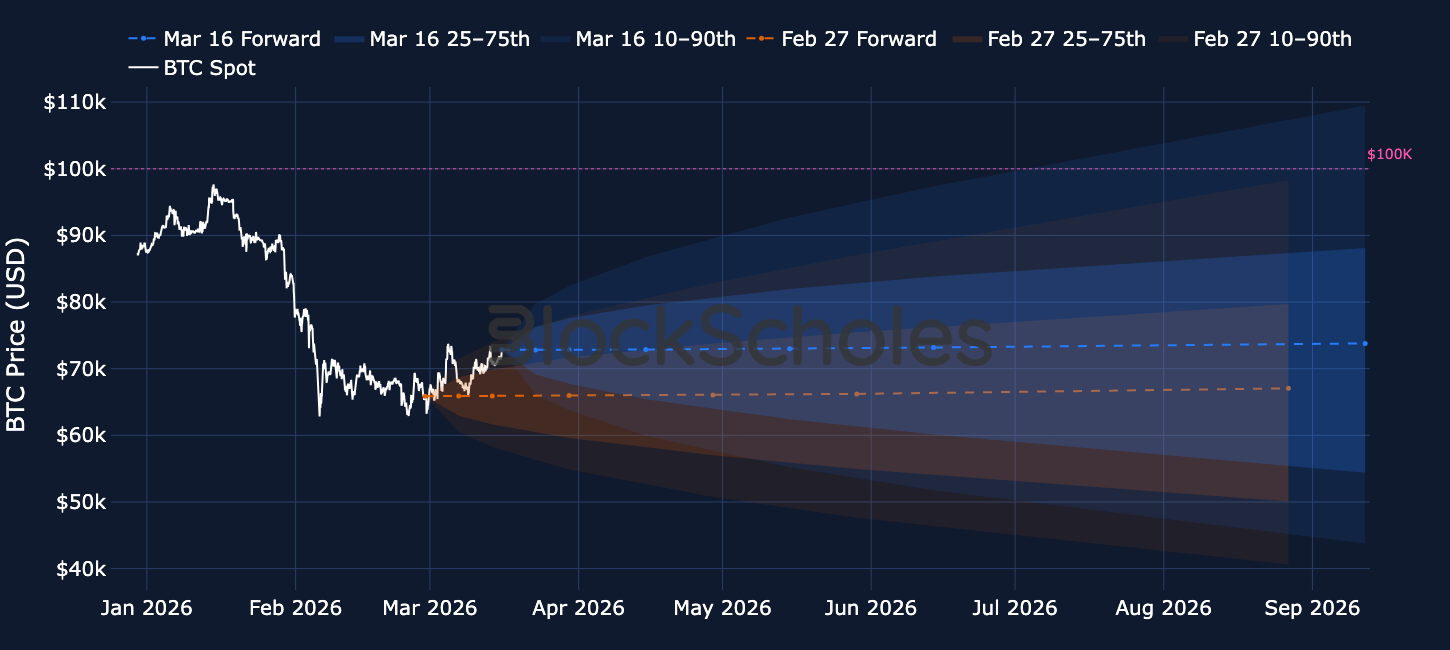
That is a marked improvement on the market’s implied distribution for spot price on Feb 27, 2026, a day prior to the US’s strikes in Iran. As spot price has trended higher since the onset of the war, the distribution of future prices has shifted up with traders slightly lifting their future expectations for spot price since before the attacks. In addition, the spread of the distribution has increased as markets have priced-up the level of volatility expected in the near future.
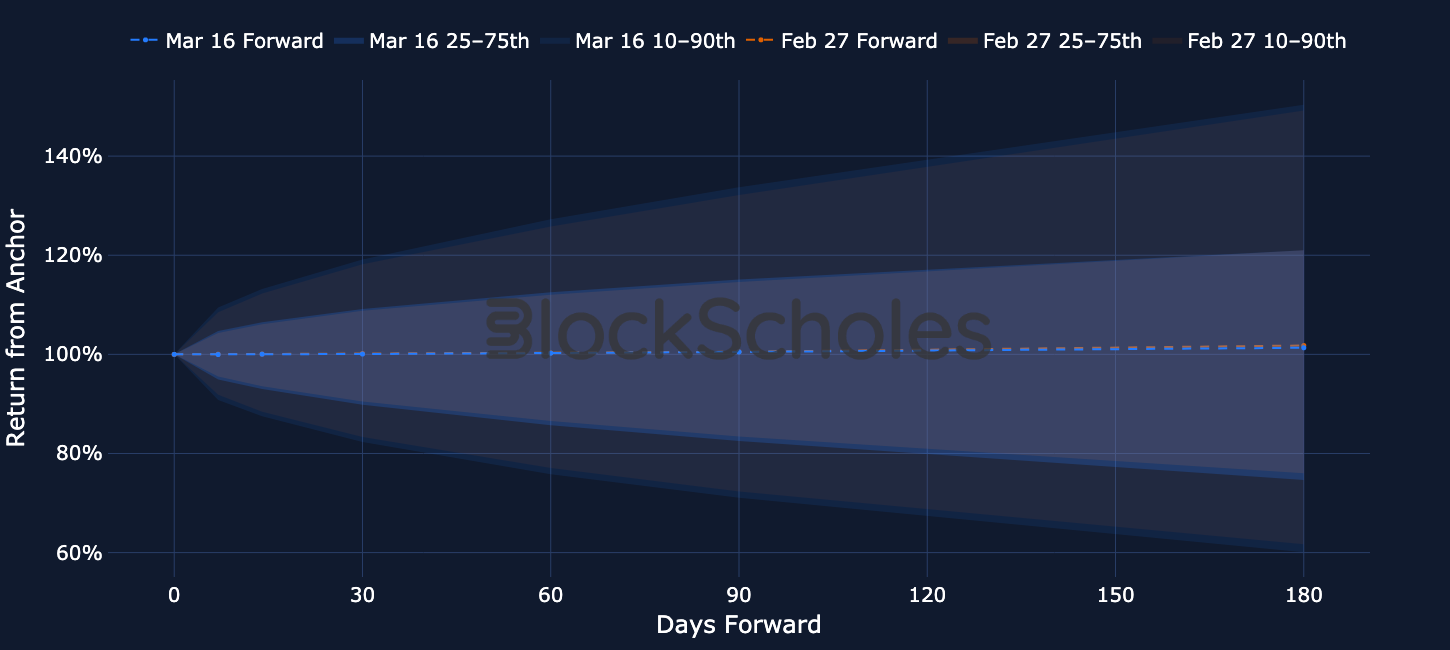
See that in the chart above, which compares the two distributions for BTC spot price over the next 180 days. Before the attack on Iran (when BTC spot traded lower, at ~$65K), the forward curve was slightly shallower but the distribution tighter. Now, a larger level of implied volatility has widened the distribution.