Thahbib Rahman
Research Analyst
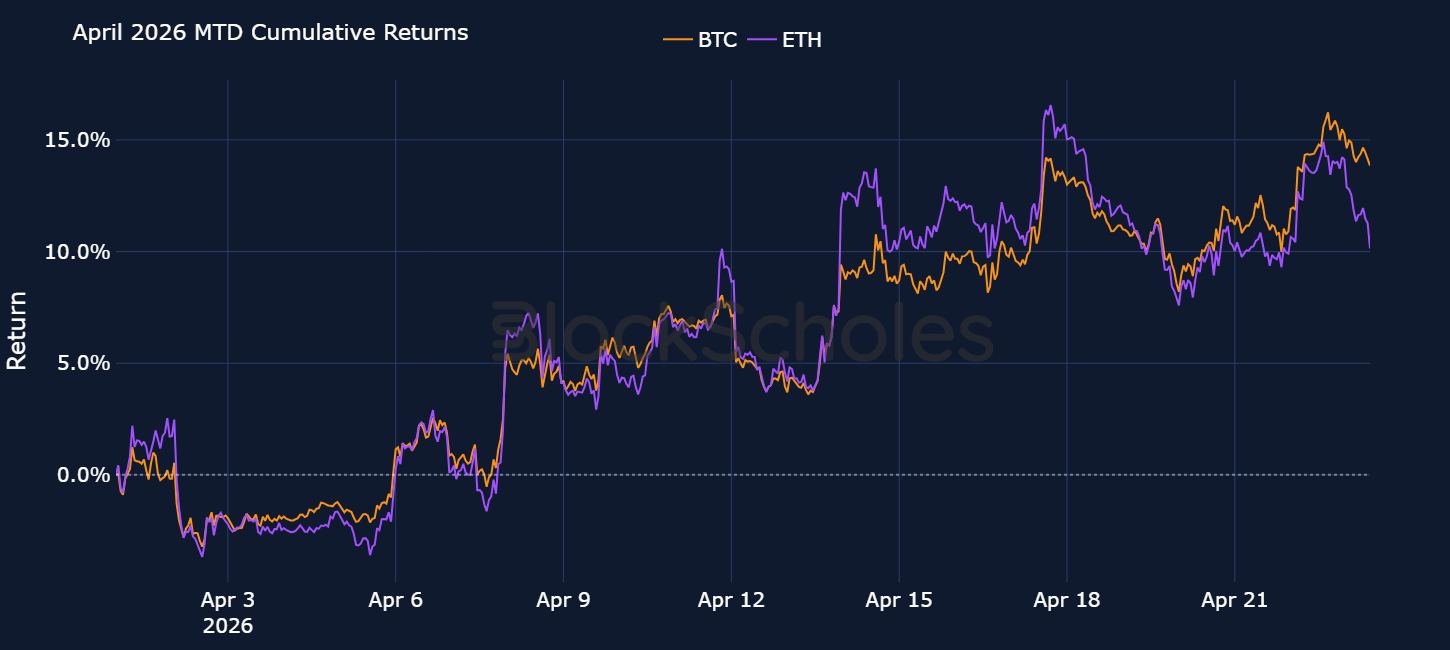
Through April, BTC and ETH have both rallied to a peak of ~16% month-to-date. After President Trump’s indefinite extension of the US-Iran ceasefire, BTC rose to $79,500 — a price it last traded hands at on Jan 31, 2026, nearly three months ago. Crypto’s primary measure of risk premium — implied volatility — reacted significantly to President Trump’s late February address to the world that the US had launched "major combat operations" against Iran. Short-dated volatility immediately jumped 10 percentage points to 60% and later to 70%. While that was a small reaction relative to the Feb 5, 2026 selloff when BTC experienced its largest single-day drop since the collapse of the FTX exchange, 7-day vol trading between 60-70% marked a dramatic step up from the past 12 months of sub-40% volatility.

Through April, BTC and ETH have both rallied to a peak of ~16% month-to-date. After President Trump’s indefinite extension of the US-Iran ceasefire, BTC rose to $79,500 — a price it last traded hands at on Jan 31, 2026, nearly three months ago.
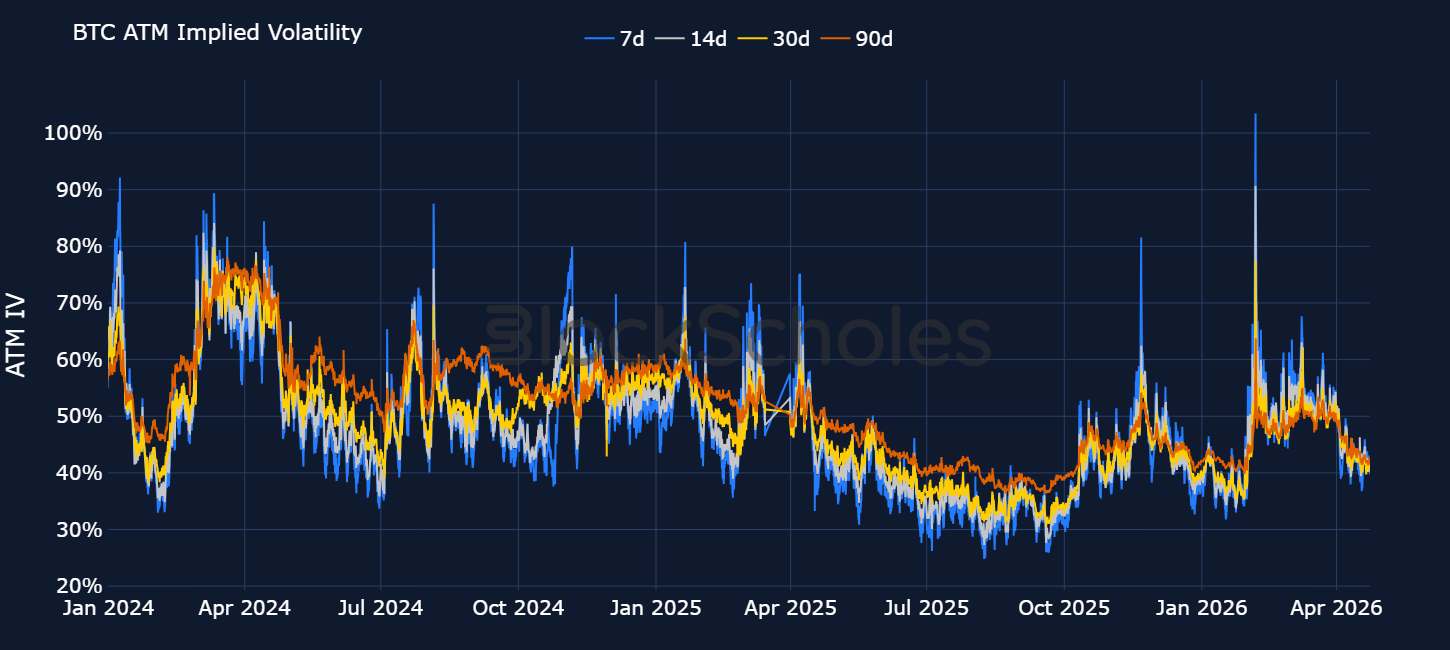
Crypto’s primary measure of risk premium — implied volatility — reacted significantly to President Trump’s late February address to the world that the US had launched "major combat operations" against Iran. Short-dated volatility immediately jumped 10 percentage points to 60% and later to 70%. While that was a small reaction relative to the Feb 5, 2026 selloff when BTC experienced its largest single-day drop since the collapse of the FTX exchange, 7-day vol trading between 60-70% marked a dramatic step up from the past 12 months of sub-40% volatility.
As the US-Iran war progressed, crypto spot prices remained reactive to the headline-driven macro environment, rallying on optimistic signs of diplomacy and falling on further threats of escalation. Implied volatility on the other hand, has slowly responded far less to the geopolitical turbulence.
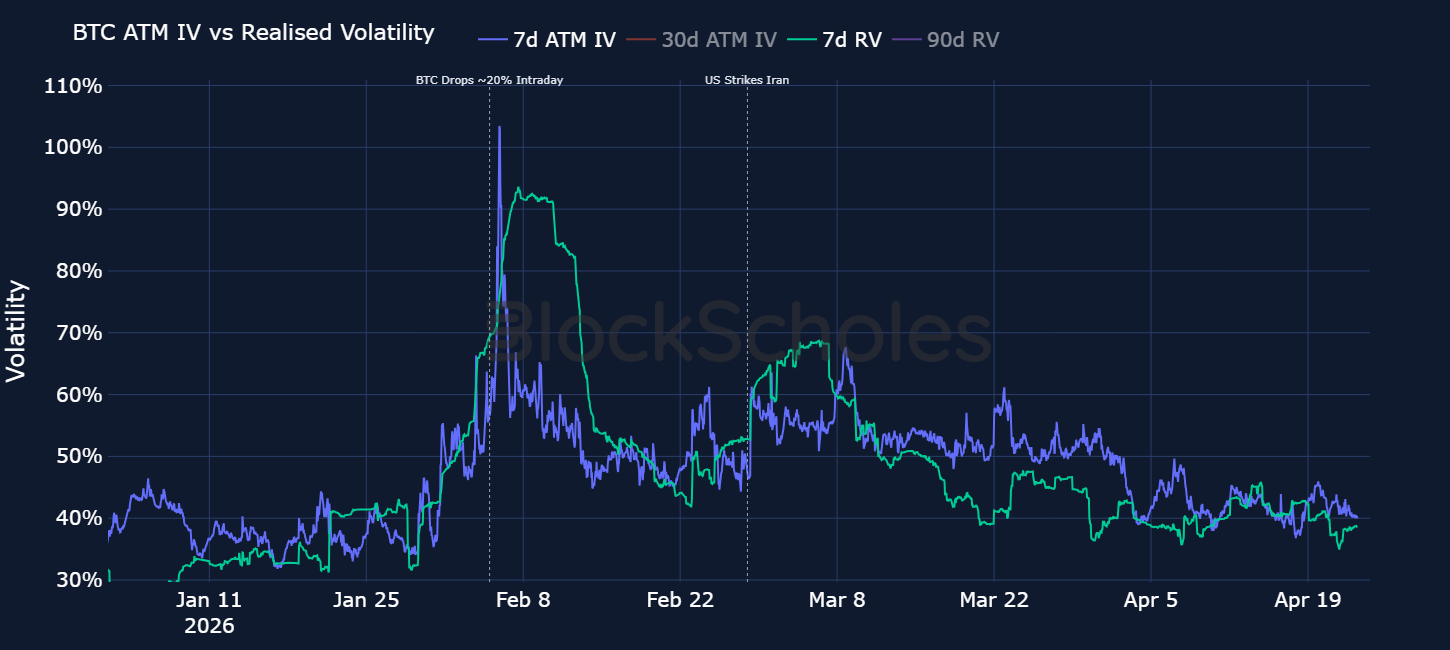
7-day BTC implied vol and realised vol rose to 61% and 68% at the onset of the war. Those values are now 43% and 41% respectively — both below pre-war levels. Part of the decline in implied volatility can be attributed to the fall in delivered volatility over the same period of time, however, the ratio of BTC IV to RV reveals that the former has been dropping at a much faster rate than realised vol.
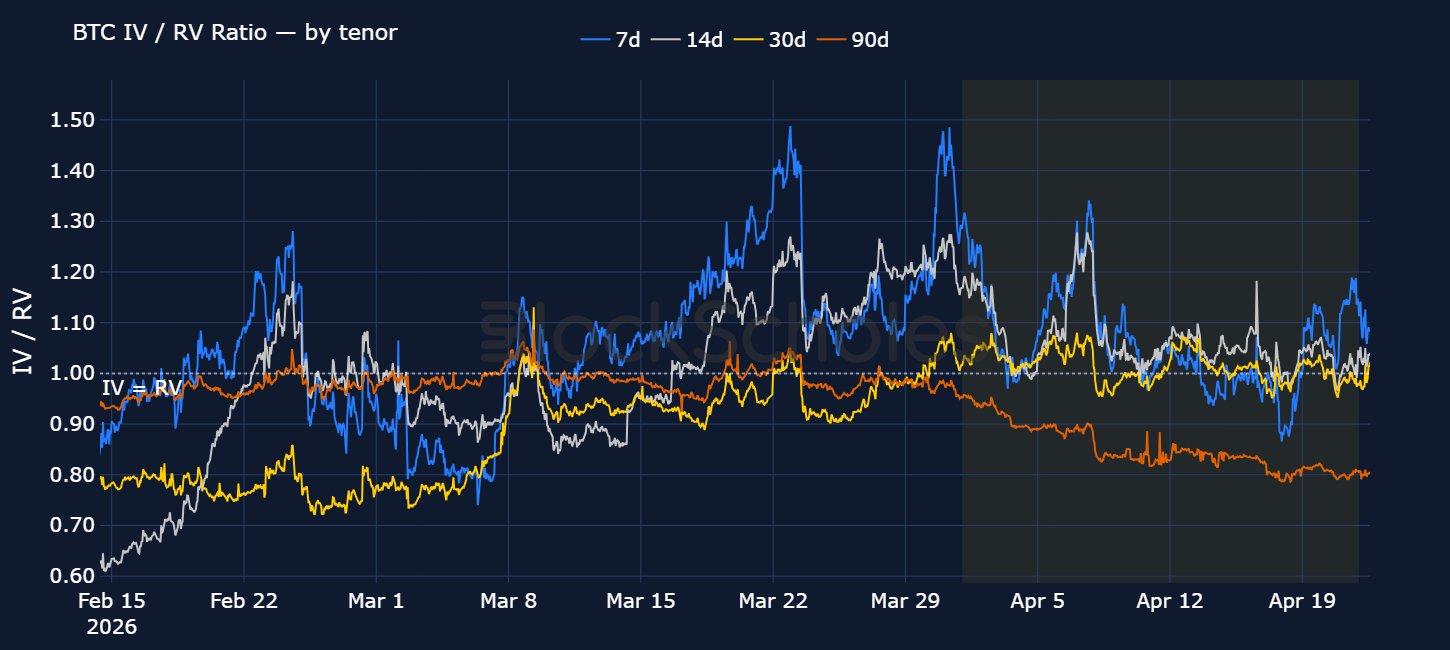
Between early to mid-March, the ratio rose significantly. Trump’s Feb 28 announcement prompted options traders to price in a meaningful tail-risk premium. Implied volatility climbed on the expectation that the escalation could drive a step-change in spot volatility, well in excess of what had been realised in the pre-war calm. As such, 7-day options traded 20 vol points (or 49%) higher than delivered volatility.
March 23, 2026, marked a turning point however — President Trump said the US was negotiating a “total resolution of our hostilities in the Middle East” and he suspended strikes against Iranian power plants and energy infrastructure for five days, a move which would have marked a significant escalation in the conflict at the time. The IV premium in short-dated options subsequently collapsed. With further fighting currently on hold and an albeit fragile ceasefire, the IV/ RV ratio has fallen back towards pre-war levels. The fat tail vol traders had expected to occur had failed to materialise, resulting in options traders slowly pricing their volatility expectations lower.
Further along the curve, longer-dated options have also repriced to the downside significantly. 90d ATM IV has dropped 13 vol points from its March 22 intra-wartime high: potential signs from the options market that war headlines are less and less likely to be catalysts for longer-term volatility. That resulted in a surprisingly flat term structure of volatility through much of April (see a snapshot comparison of the term structure on Feb 28 vs April 23).
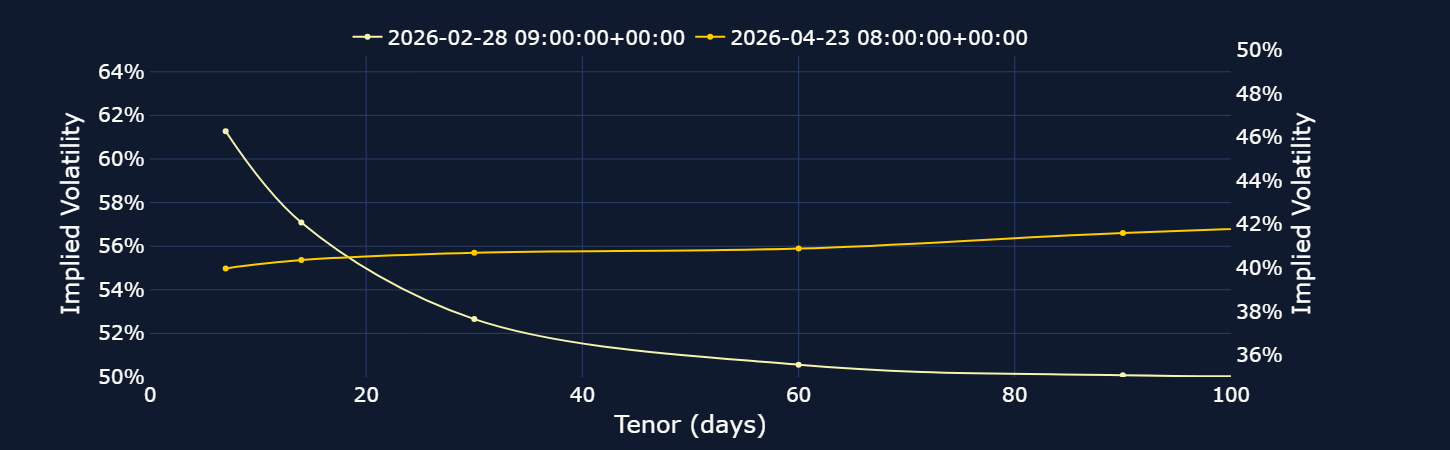
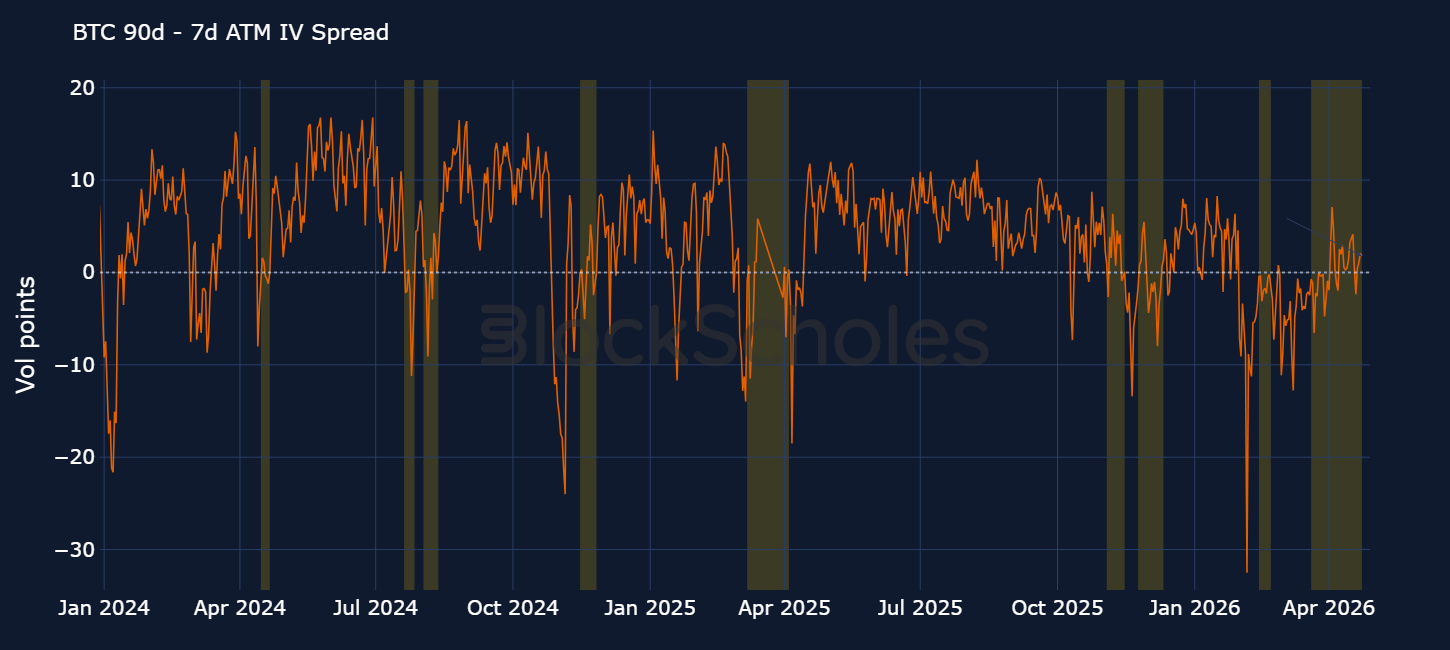
While in theory a flat shape suggests traders are not expecting a regime change in volatility over the next three months, empirically, such a flat curve has not lasted long. Below we plot the spread between the ATM implied volatility at a constant 90-day maturity vs a constant 7-day maturity on a daily basis. For this analysis, we define a flat term structure of volatility as the case when the absolute spread between the 90D and 7D IV is below 2 vol points. On April 23 that absolute spread was 1.79 vol points, landing it in the 13.4th percentile — that is, only 13.4% of days since 2020 have had a flatter curve, in either direction.
The orange shaded boxes mark flat term-structure regimes — contiguous stretches of at least 7 days where the spread stayed inside the ±2 vp band (allowing up to 3 noisy days within each episode to prevent one-off daily spikes breaking the regime).
Since 2020, we count 22 such episodes. The median regime lasted just 11 days, and the longest ran for 35 days before the curve resolved.
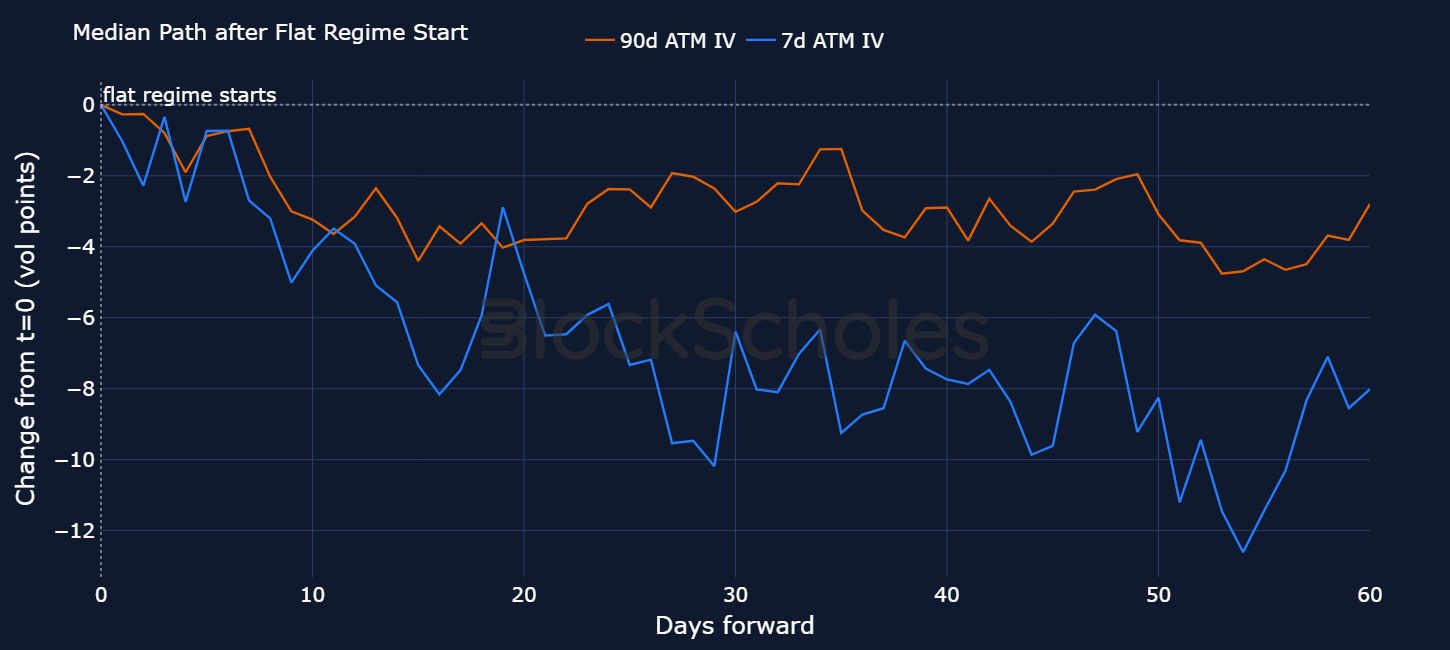
To understand in which direction the flat vol curve typically resolves, we plot the median path of 90d ATM IV, 7d ATM IV and 30d realised volatility across the 22 episodes from the start of a flat regime to 60 days after.
The median path suggests the curve re-steepens primarily through the front end falling, rather than a rise in the back end. Over the 60 days following a flat-regime start, 7d ATM IV drops by a median of −8 vol points, while 90d ATM IV drifts down only −3 vol points, causing the curve to normalise.
With volatility drifting lower and spot price marching higher, 25-delta risk reversals for BTC and ETH have mostly recovered from their deeply negative put premium. For the first time in two months, on April 17, 2026, 7-day risk-reversals temporarily tilted towards calls.
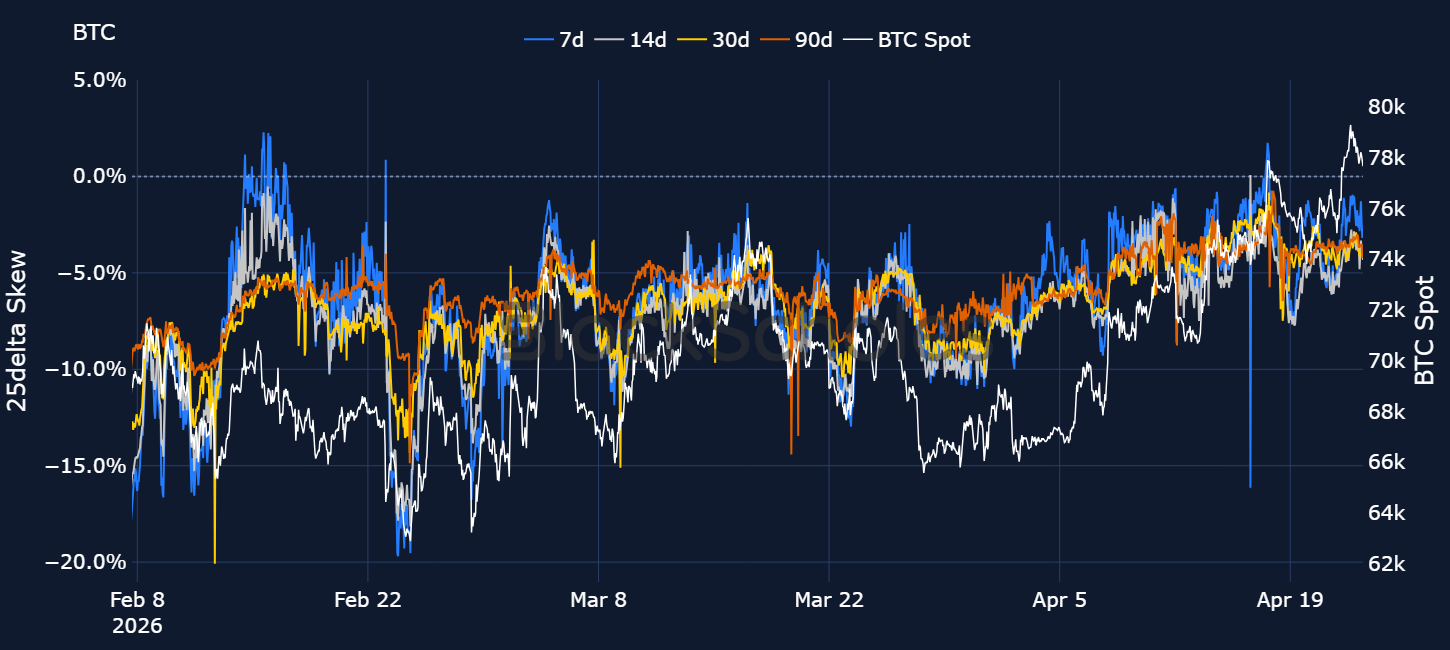
Decomposing the 25-delta skew into its two component wings can help explain why skew briefly flipped positive on April 17. For each tenor (7d and 30d), the chart below plots:
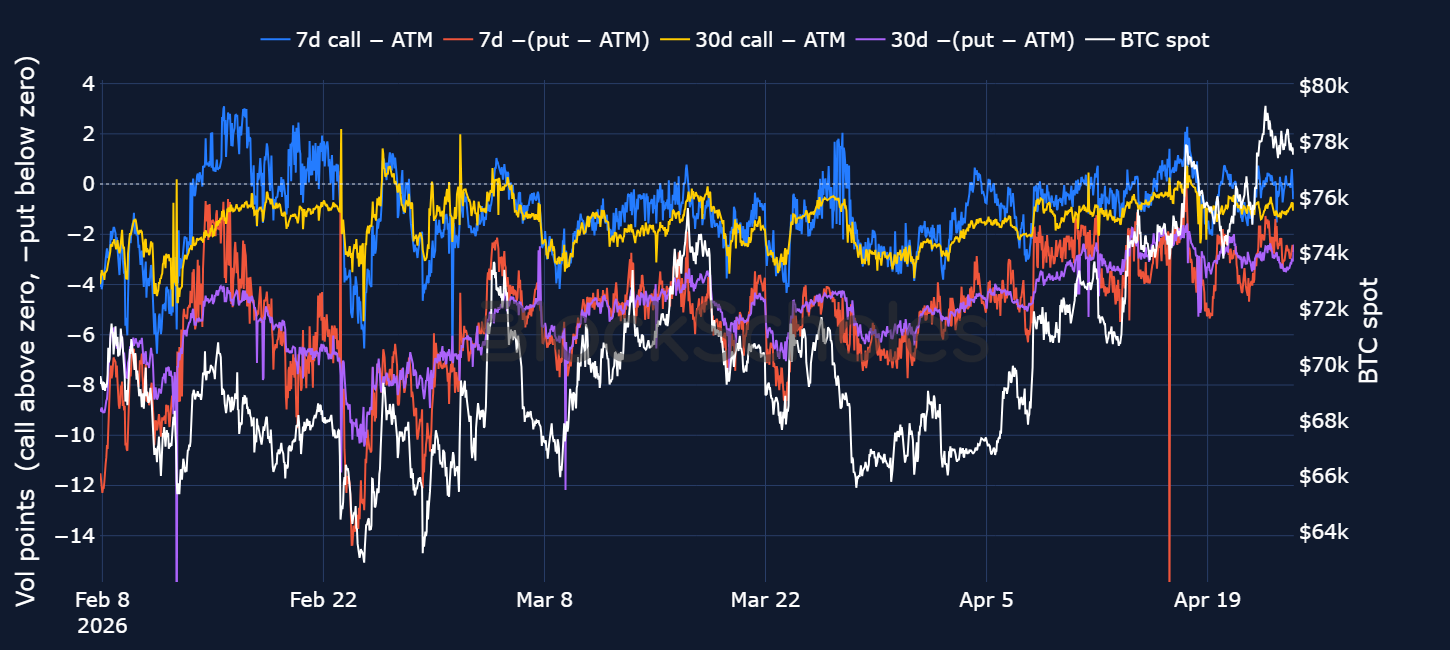
On April 17, not only did the call wing rise by 2 vol points (OTM calls traded with a higher vol than ATM options), the put wing compressed towards 0 (downside premium in puts disappeared).
Still that positive skew did not last long, and was specific only to the 7-day constant maturity. Options markets sharply reverted back to the structural preference for downside protection that we’ve seen through most of the year — the put-wing premium quickly expanded to 5 vol points. Even the most recent spot price rally past $78K, the level spot traded at on April 17 when skew did briefly trade positively, has not been able to drive a meaningful call premium. That suggests the current relief rally in spot might be enough to encourage traders to unwind some of their downside hedges, but has not yet been enough to fully commit traders into bidding upside calls.
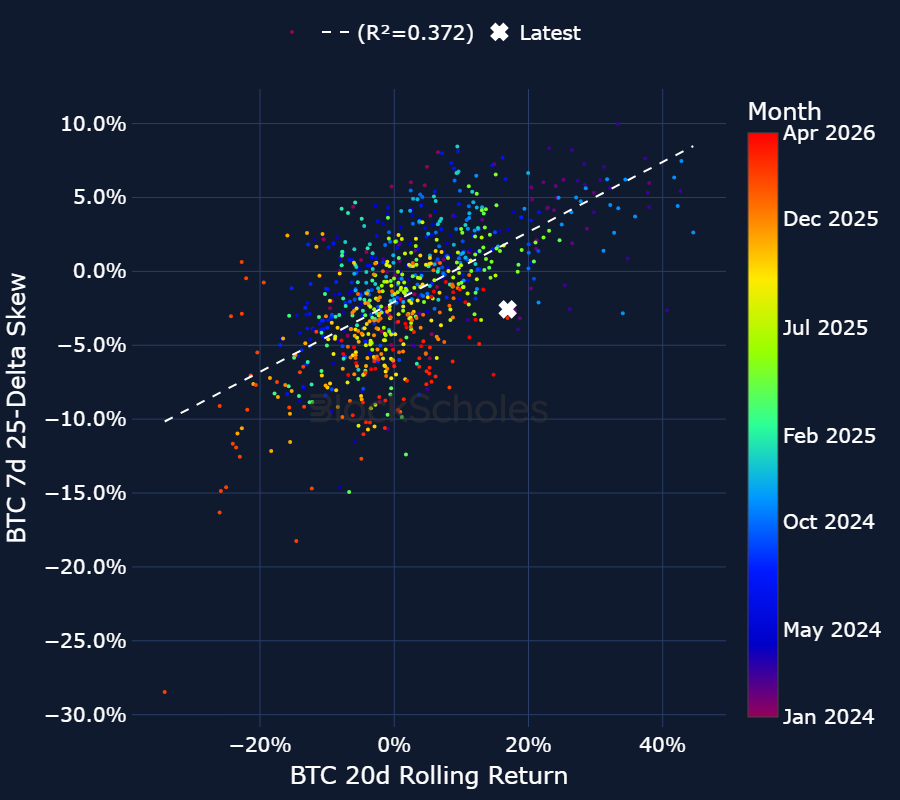
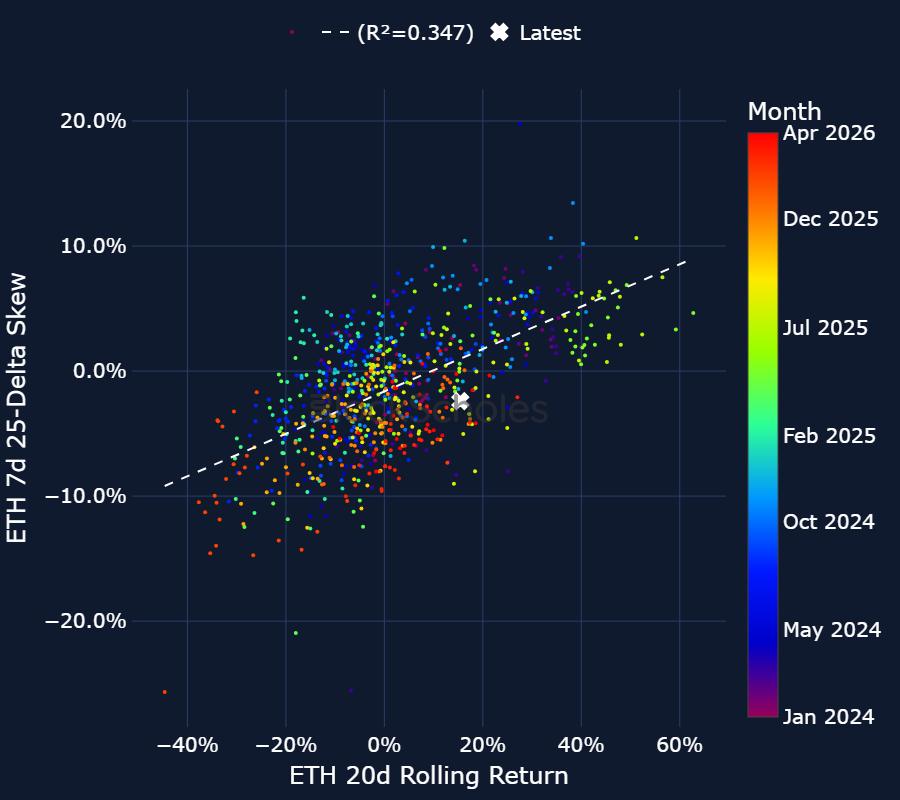
A linear regression between rolling 20-day BTC returns and 7-day 25-delta skew reveals just how skeptical options markets are of the current rally. With BTC currently up 16% over the past 20-days, the historical relationship between rolling returns and skew would imply a positive skew of 2%. Instead, out-the-money puts trade with a 2.57 vol point premium over calls. The same skepticism can be seen in ETH options too — historically, a spot price rally of 15% in the last 20 days has seen a call-skew above 1%. Instead, the 25-delta skew trades at -2.4%.
Despite their skepticism, there are a number of catalysts that may suggest derivatives markets could be underpricing the probability of a continued rally, beyond just an end to the US-Iran conflict. Strategy recently announced a purchase of $2.5B worth of bitcoin on April 20 — the digital asset treasury’s largest purchase since November 2024.
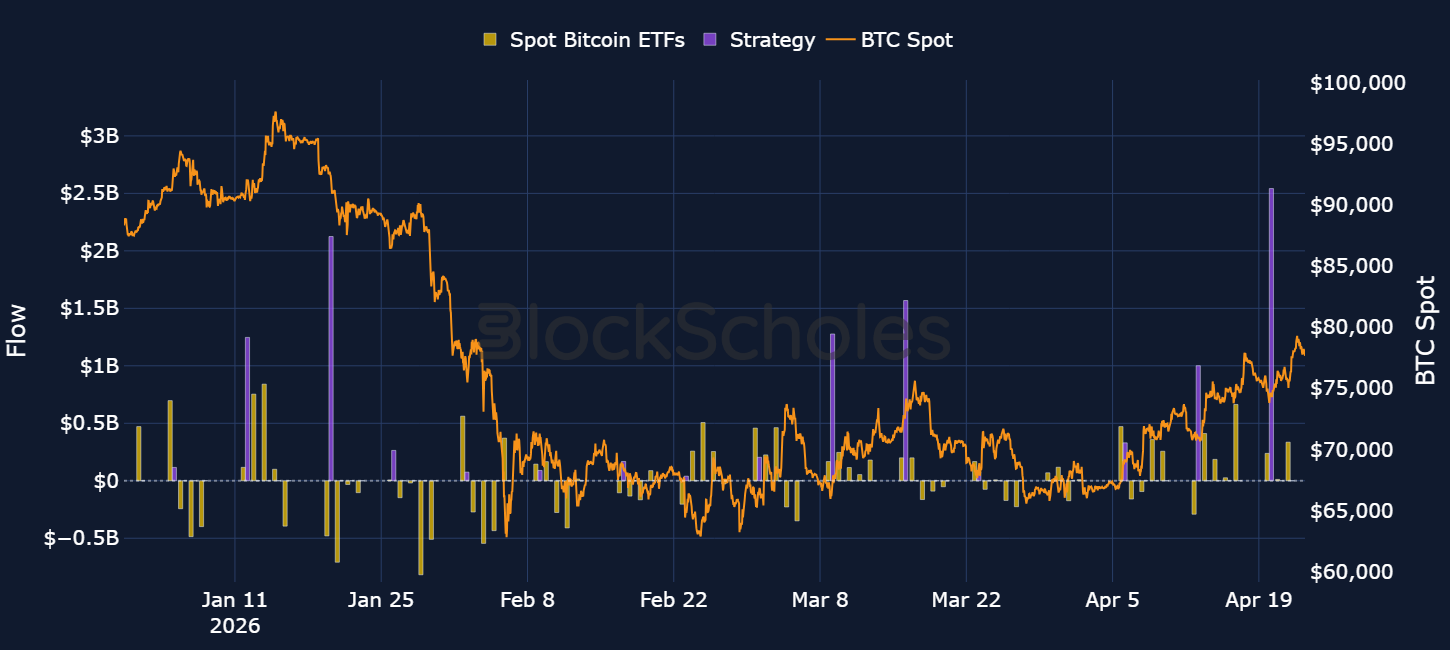
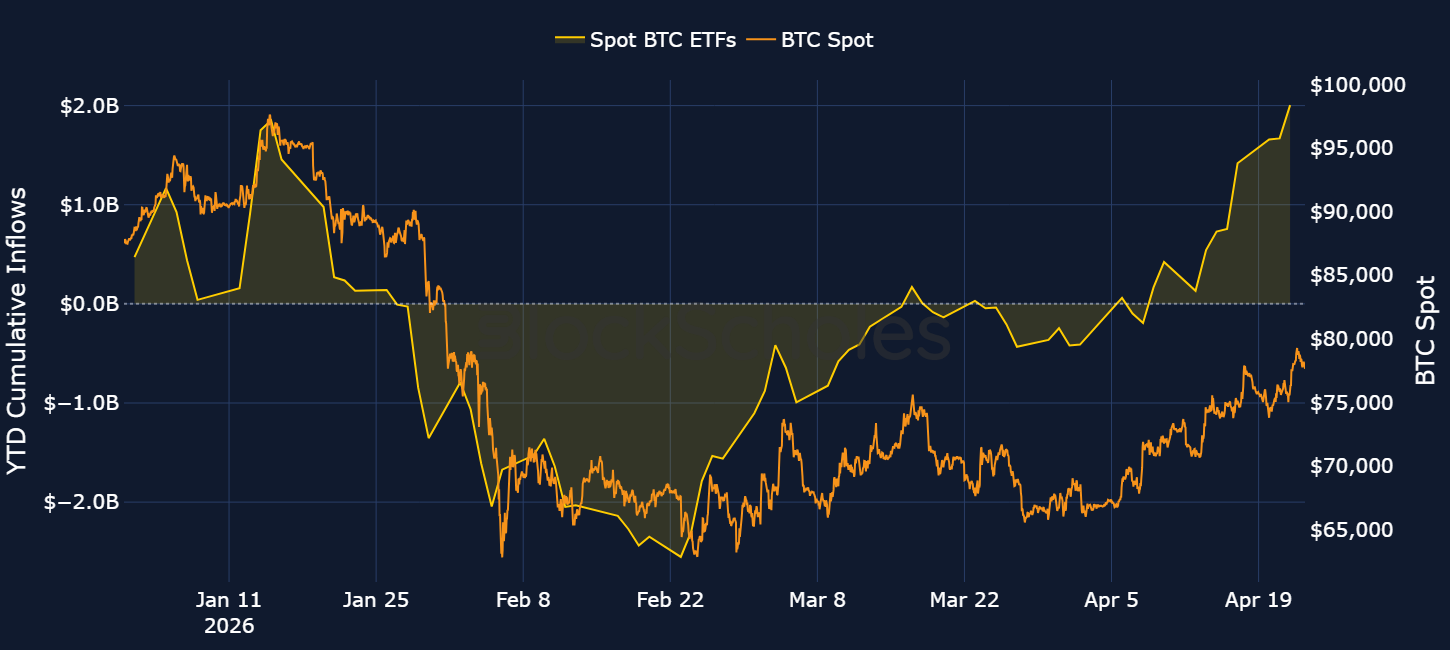
It’s also not a surprise that spot price has been rallying at the same time that Spot Bitcoin ETFs have resumed their buying. Seven straight days of net inflows have resulted in the Spot products purchasing more than $1.8B of bitcoin, while year-to-date product inflows turned positive again in early April after cumulative outflows reached as much as $2.6B by mid-February.
Finally, it is not just existing institutional interest that has been underpinning the market either — Charles Schwab recently announced plans to launch their own spot crypto trading platform in the upcoming weeks, even suggesting an aggressive 8.8% portfolio allocation to Bitcoin for clients. Goldman Sachs filed for its own Bitcoin ETF, while Morgan Stanley became the first major bank to launch a Spot ETF on Bitcoin two weeks ago.