Thahbib Rahman
Research Analyst
After months of turbulent price action that followed the October 2025 liquidation event, and a brief capitulation below $60K, BTC’s spot price has been stuck in a narrow range of $65K and $70K over the past two weeks. That sideways consolidation around what appears to now be a key corridor for price reflects the current lack of catalysts and conviction in crypto markets.
After months of turbulent price action that followed the October 2025 liquidation event, and a brief capitulation below $60K, BTC’s spot price has been stuck in a narrow range of $65K and $70K over the past two weeks. That sideways consolidation around what appears to now be a key corridor for price reflects the current lack of catalysts and conviction in crypto markets.
Given this period of sideways price action, how then are traders currently positioned in options markets?
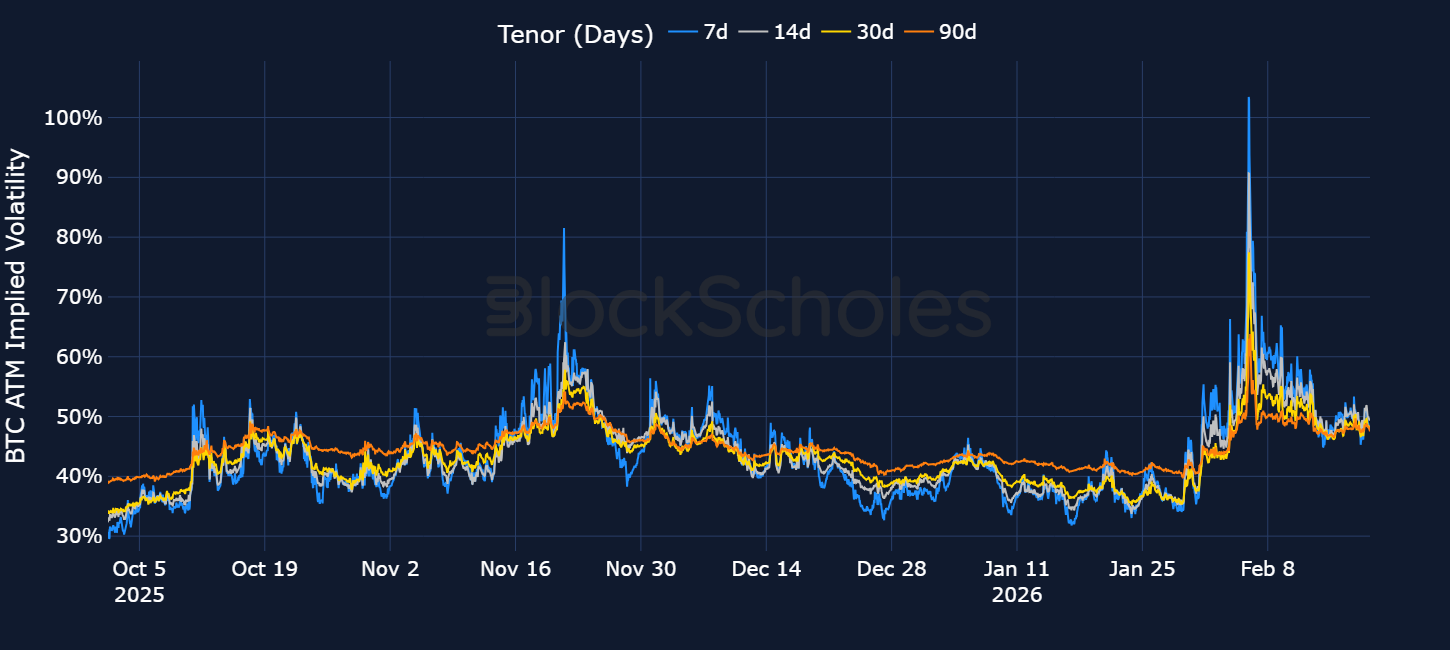
To provide some context first, short-dated at-the-money implied volatility for BTC options surged to their highest since the collapse of the FTX exchange in November 2022 as BTC flash-crashed below $60K on Feb 5, 2026.
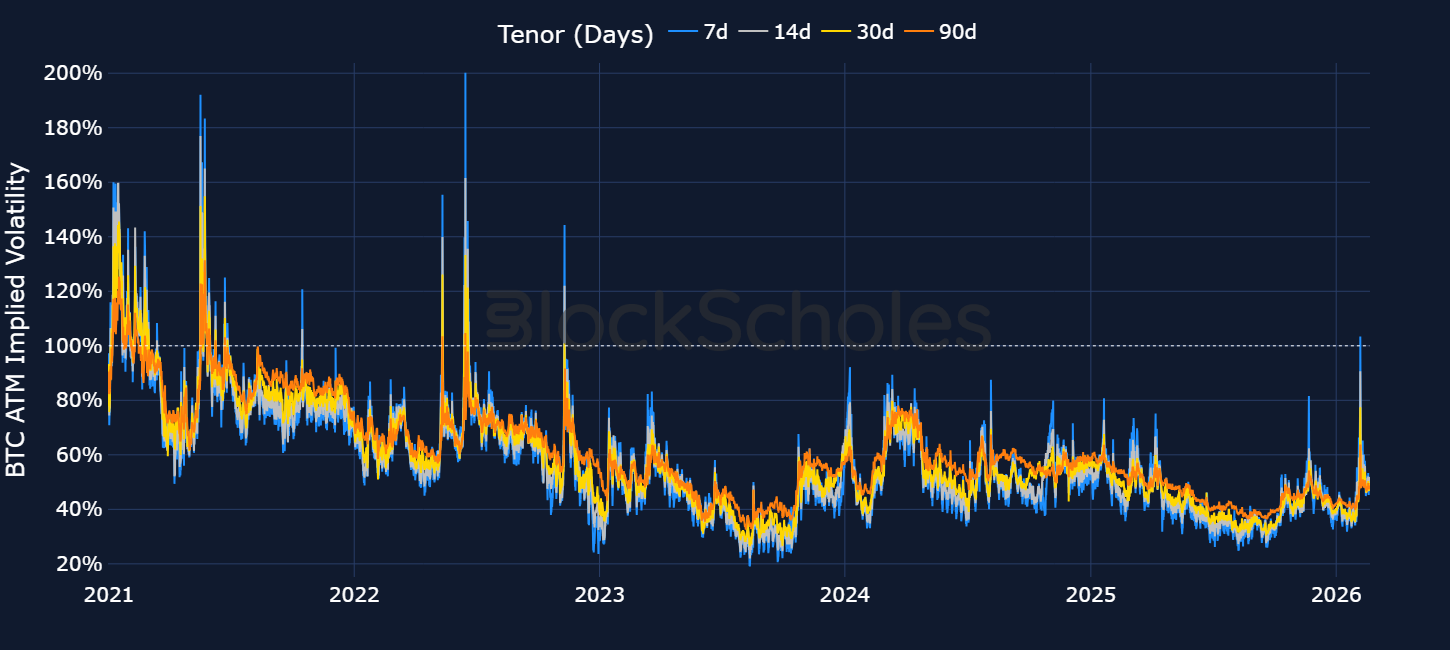
Since then, 7-day implied volatility has more than halved from 103% down to 49%, with forward looking volatility expectations lingering around 50% for all option expiries; not just short-dated options. However, what’s surprising is the speed and extent of the collapse in volatility, given that spot price remains close to 50% below its all-time high.
In the chart below, we use hourly implied volatility data to detect all of the occasions since 2020 when 7-day BTC ATM vol had doubled versus its own 5-day low (i.e., a 100% increase in IV from the local trough of the past 5 days). A 30-day cooldown period is then applied to avoid repeat triggers from the same volatility episode. What remains is a set of 12 distinct historical spike events and the path implied volatility took over the 100 days following each trigger.
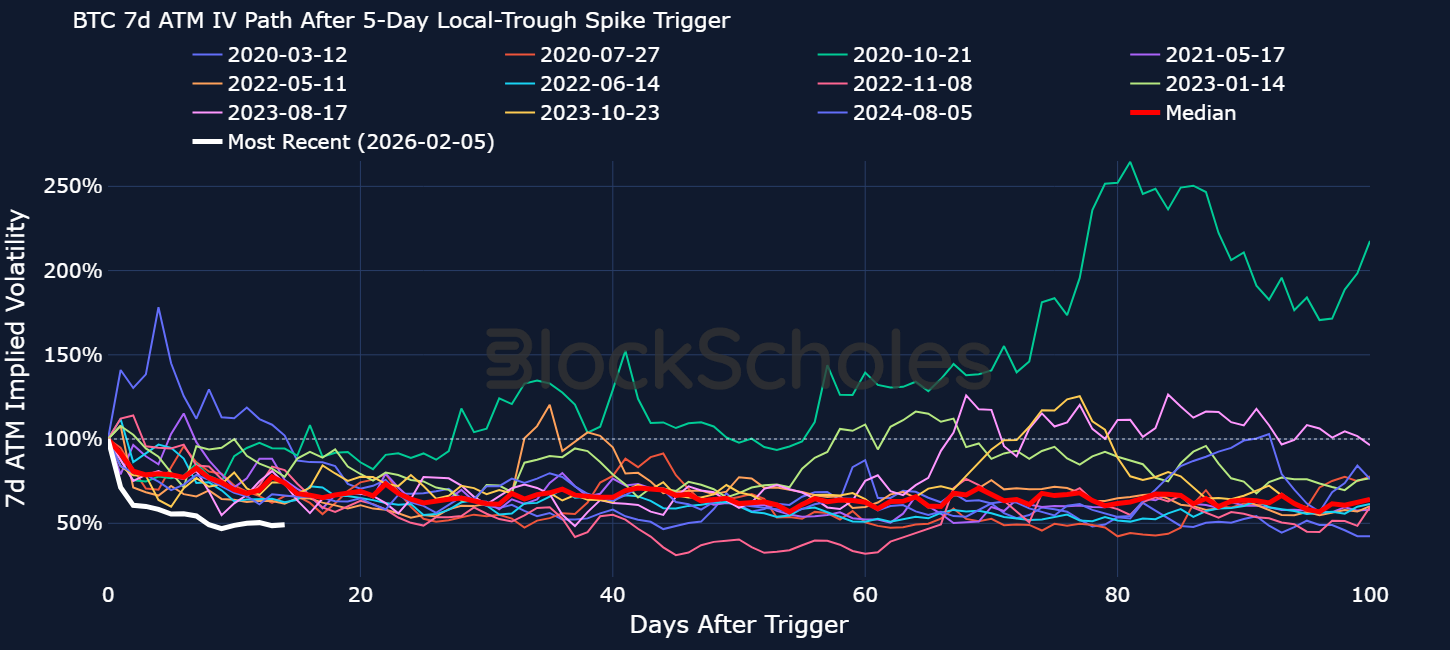
The median path over the next 100 days after a major IV spike shows a clear post-shock normalisation in volatility. This is broadly what we would expect with event-driven vol: a news or market event triggers a sharp bout of volatility before being followed by an immediate collapse in volatility once the event passes; implied vol then slowly reverts back towards the pre-event mean.
In February we saw the same post-spike pattern, but in a more extreme form than prior episodes. Not only did traders revise near-term volatility expectations lower more aggressively than in any other case, but normalised 7-day IV is now sitting at the lowest level this early after a doubling in IV from the 5-day low relative to the full historical sample.
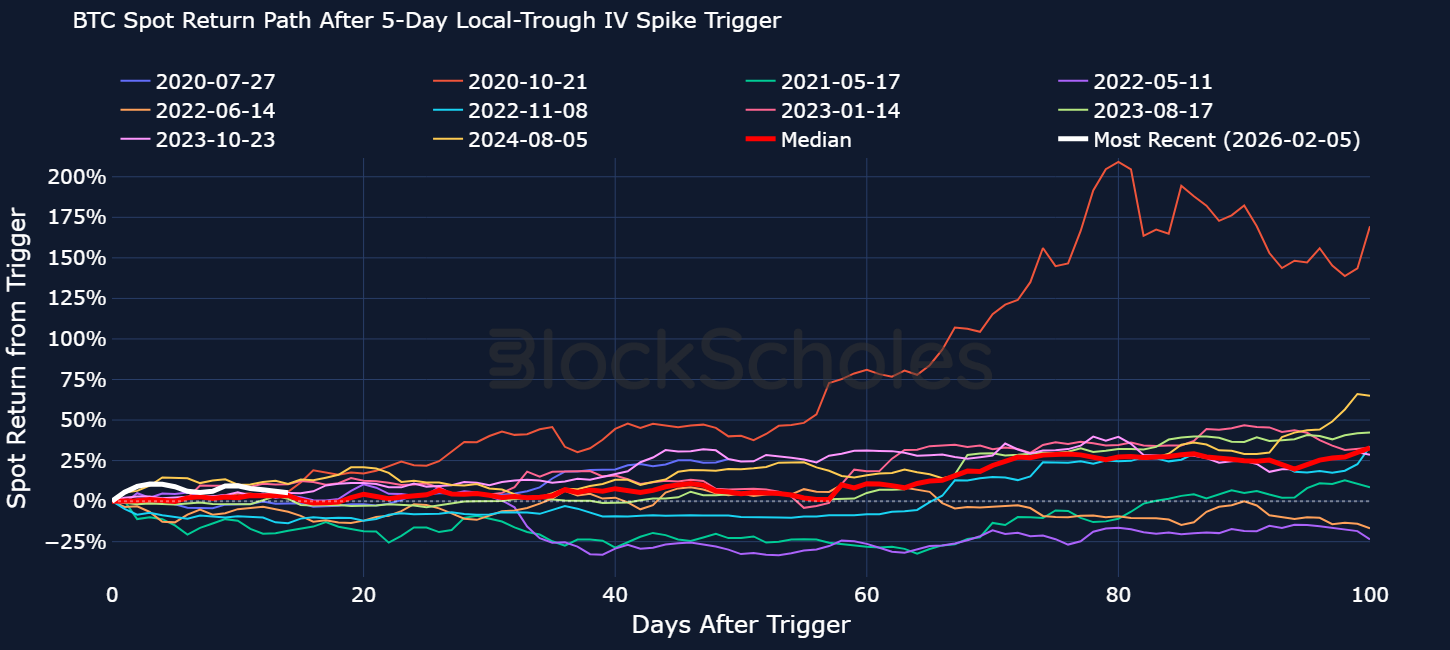
These extreme jumps in IV have also historically proven to precede rallies in spot price. The chart below plots BTC’s spot price up to 100 days after the trigger of 7-day vol doubling from its 5-day low. Excluding two cases in 2022 (Luna/UST de-peg and the Celsius collapse), post-trigger spot performance has generally been strong, with a median 100-day return of roughly 33%. So far, spot price return is just above the historical median.
Decomposing the volatility smile into its individual wings can help explain why at-the-money implied volatility has compressed from its highs. Below we plot the ratio ratio of implied volatility at the 25-delta level to the ATM level for both puts and calls at a 30-day constant tenor.
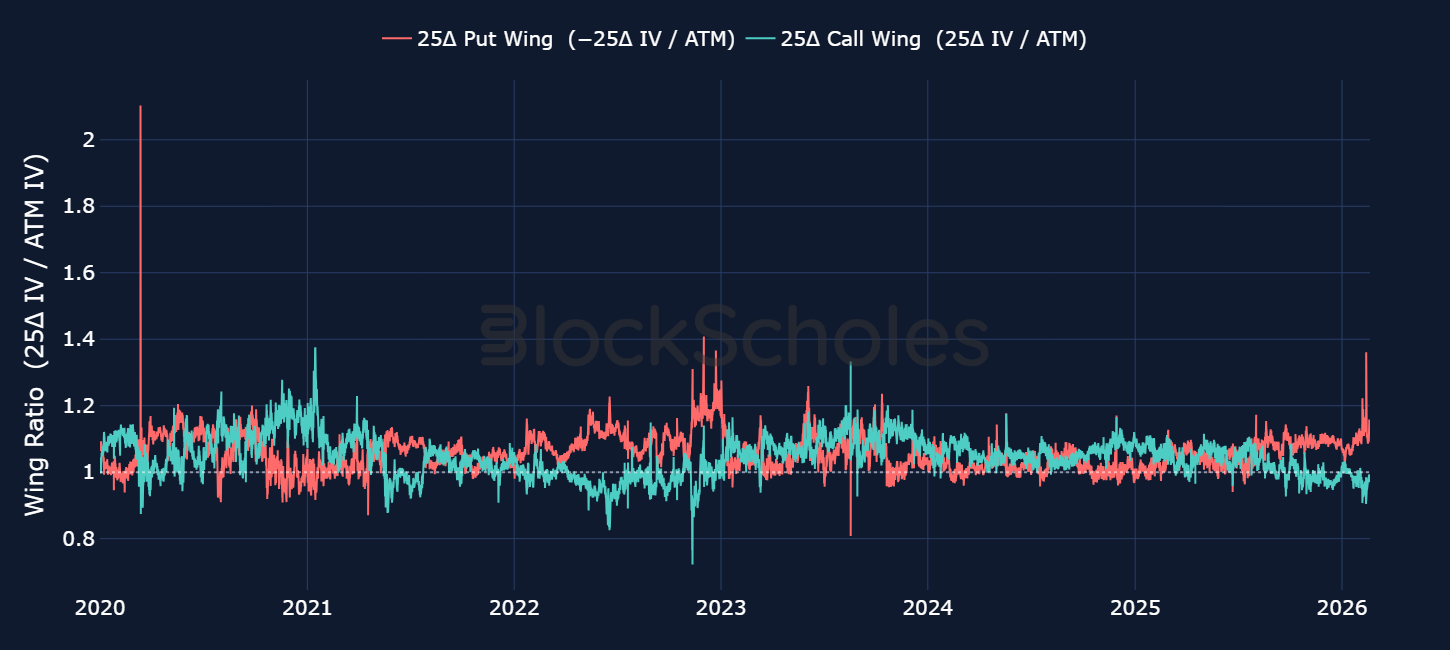
A put wing ratio above 1 indicates traders pricing OTM puts at a premium to ATM — i.e., a willingness to pay for downside protection. Consistent with a drawdown of the size we saw earlier this month, the put wing ratio spiked sharply as traders urgently rushed to hedge against a further selloff in spot. The last time options traders showed a willingness to pay such high premiums for puts was also back in 2022, though unlike back then, it has not held up as long.
The market is no longer pricing in the same panic levels as it was earlier in the month with traders largely unwinding the most extreme of their downside hedges (put wing is declining back towards 1). The volatility smile is still skewed towards put options, but current positioning reflects an expectation of further spot price consolidation (as we have been seeing over the past two weeks) and less so of another violent downside crash. The call wing was also subdued for most of the selloff indicating muted appetite for call options throughout and a lack of meaningful bullish conviction.
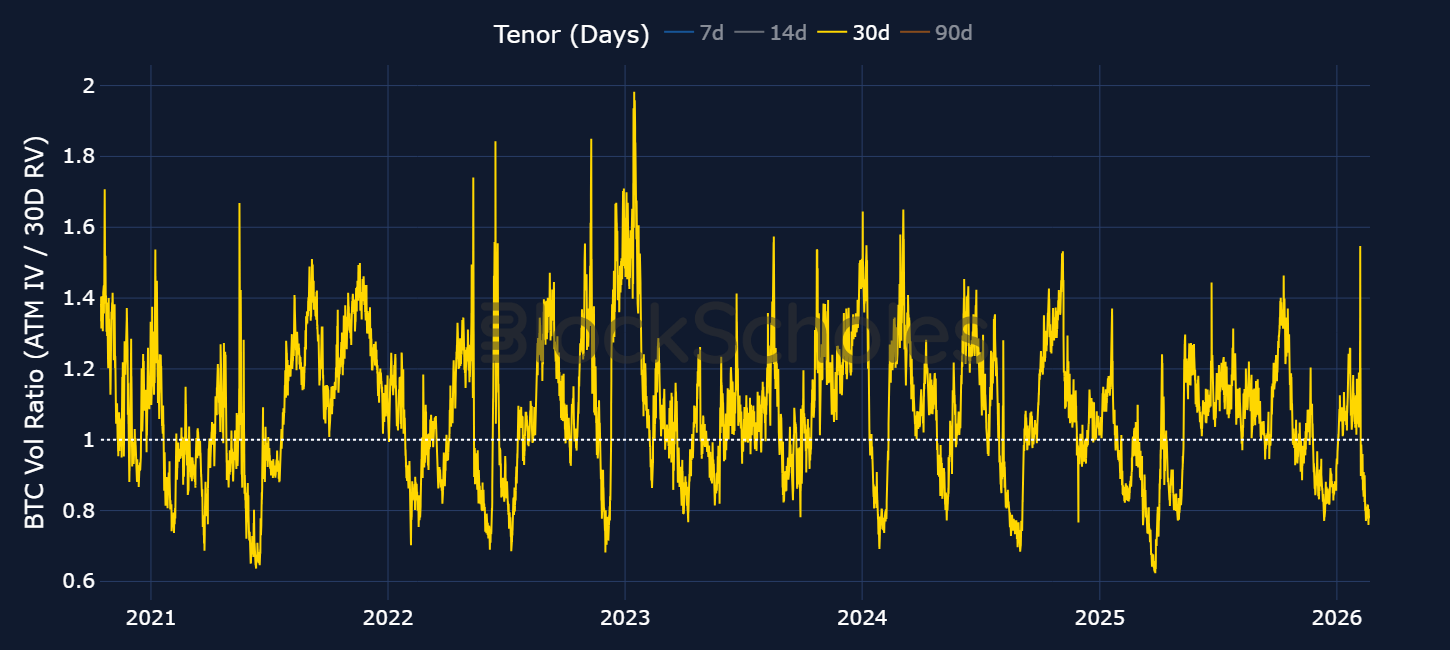
Additionally, we’re also seeing a divergence in realised and implied volatility. During the extreme of the selloff earlier this month, delivered volatility rose to its highest since March 2025. On the other hand, 7-day implied volatility rose to its highest since 2022 and 30-day IV reached similar levels to November 2022 and March 2024. With 30-day ATM IV exceeding the volatility delivered over the last 30 days, options traders had been pricing in more volatility in spot price than what was materialised.
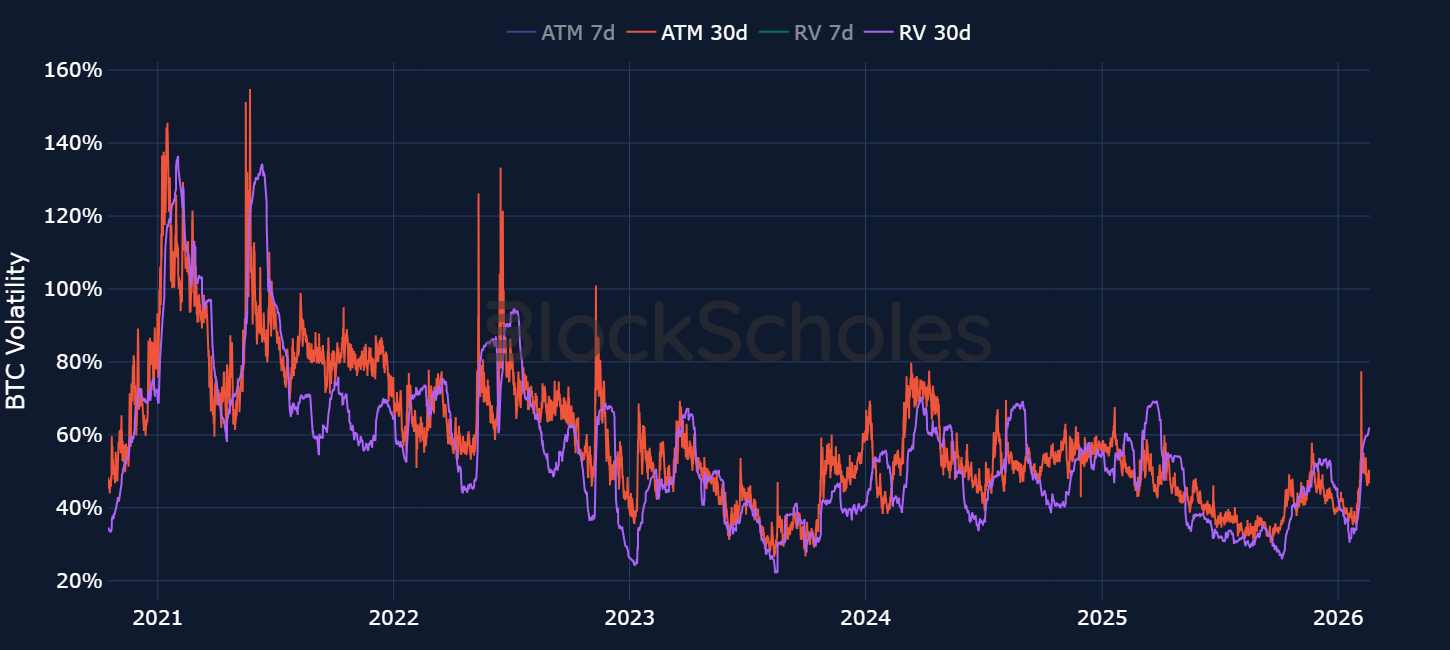
However, with implied volatility now retracing back towards 50% across the term structure (driven by reduced put demand) and realised volatility continuing to hold up above 60%, the ratio of ATM IV to delivered vol is back below 1. That divergence has typically played out towards the tail-end of stress-driven events, as IV falls faster after the shock, while it takes longer for the event to pass out the window for delivered volatility.