

Catherine Fomenkova
Last Updated:
October 2, 2026
•
7 Minutes
DeFi Analytics 2nd October 2026
This week's edition of our Crypto DeFi Analytics.

Chain Fee Generation
Daily Fees Generated by Chain
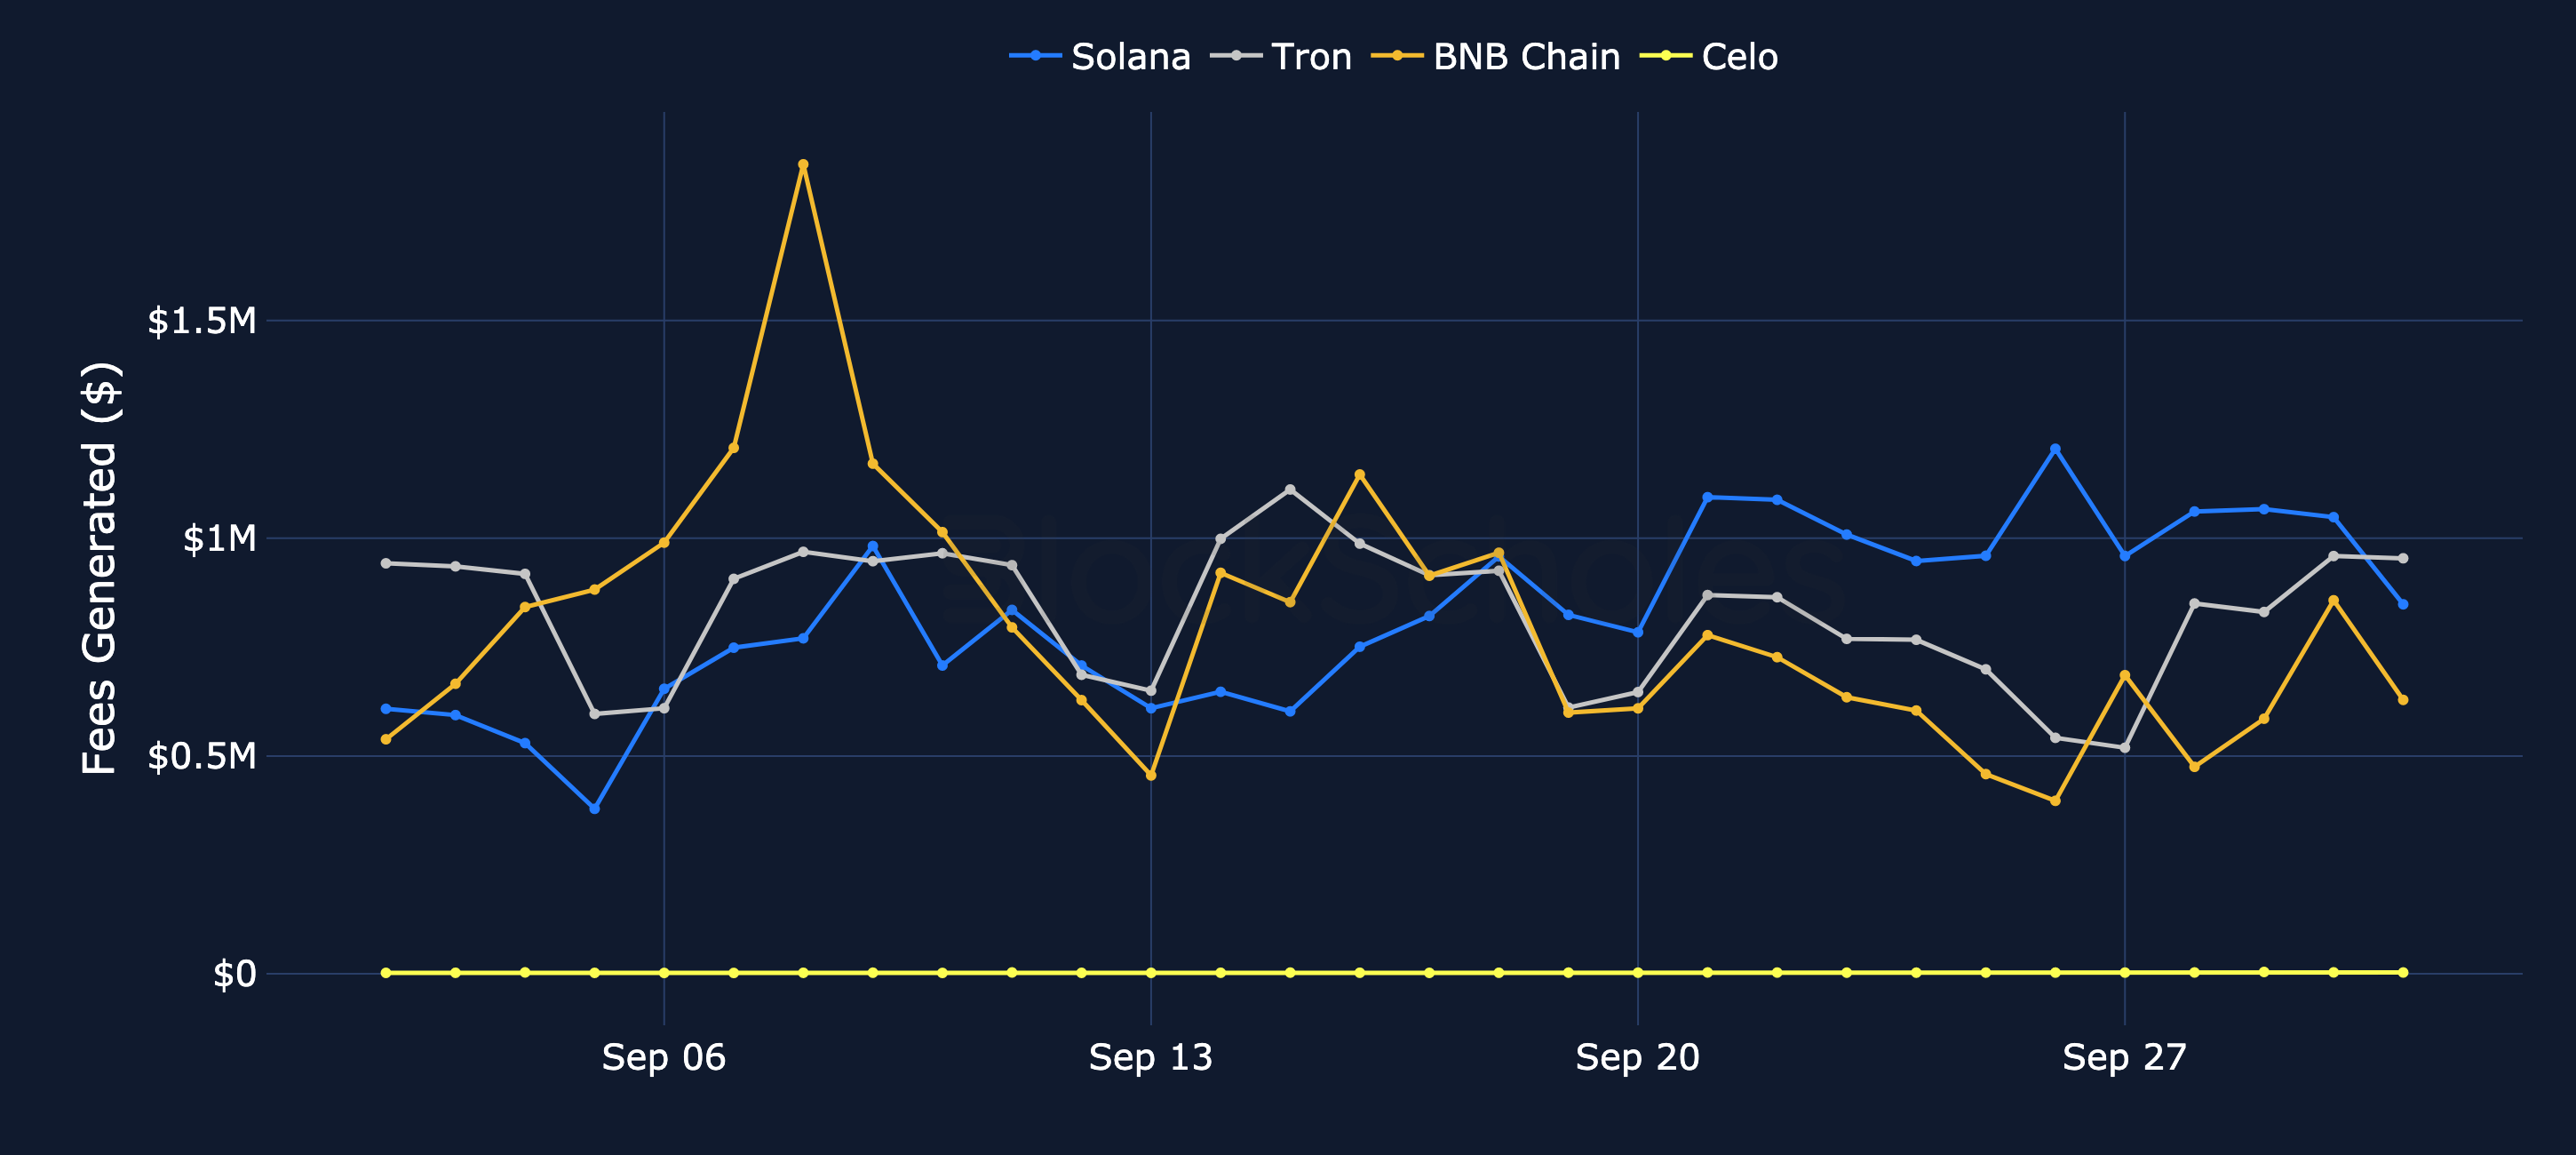
Figure 1. Daily fees generated on each chain, USD. Source: Artemis, Block Scholes.
Stablecoins
Stablecoin Supply by Chain
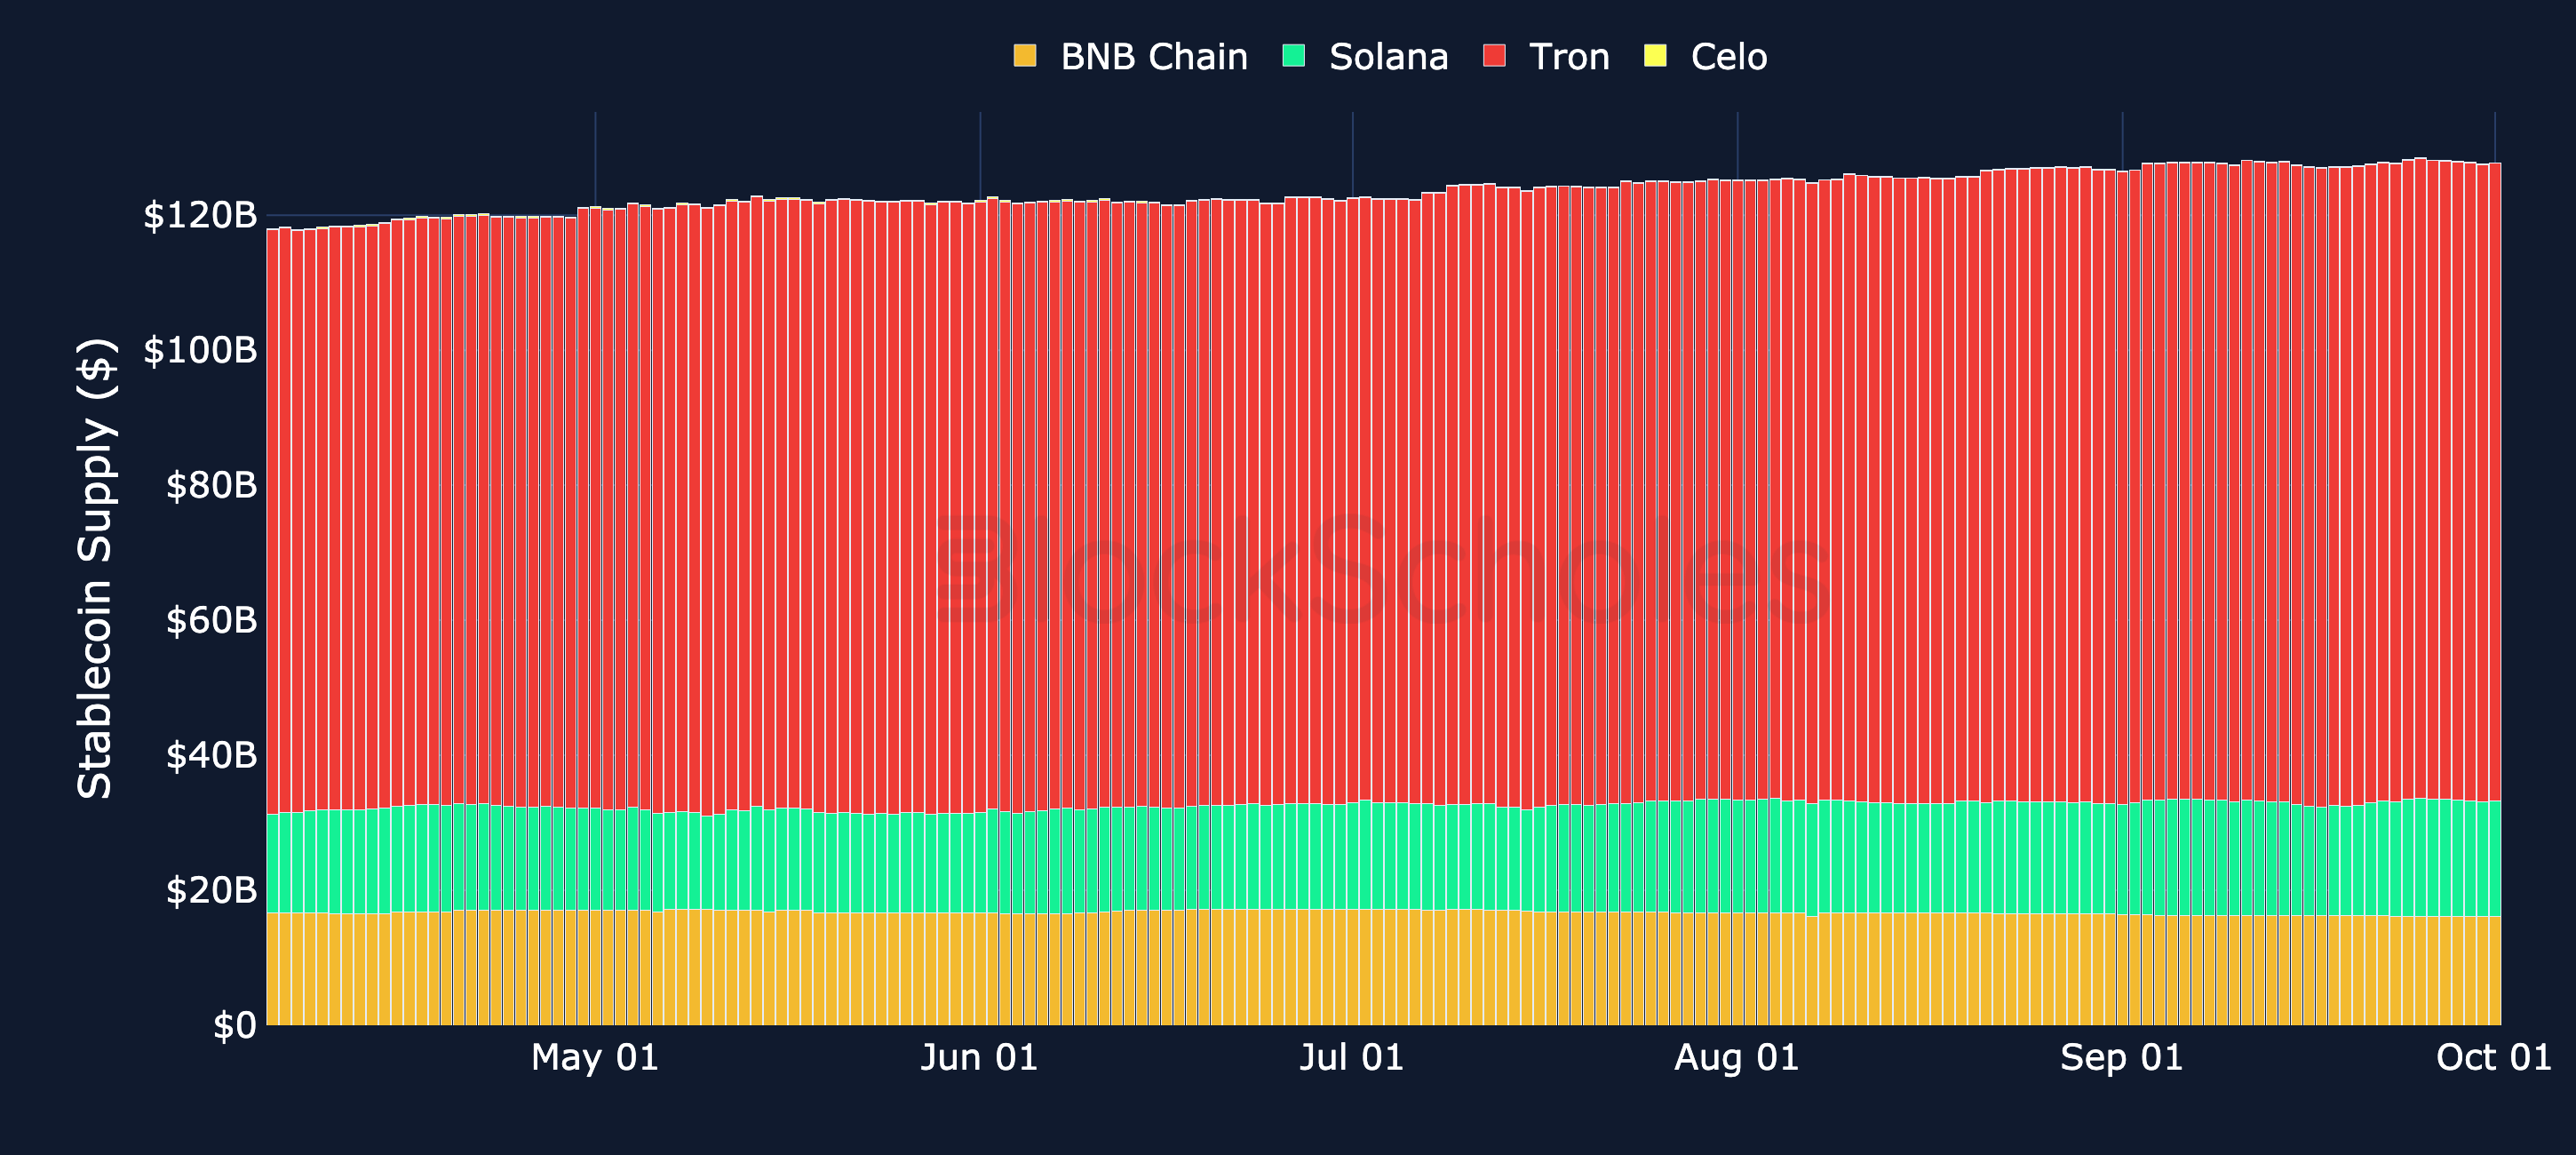
Figure 2. Stablecoin supply on Ethereum, Tron, Solana and BNB Chain, USD. Source: Artemis, Block Scholes.
Stablecoin Volume by Chain
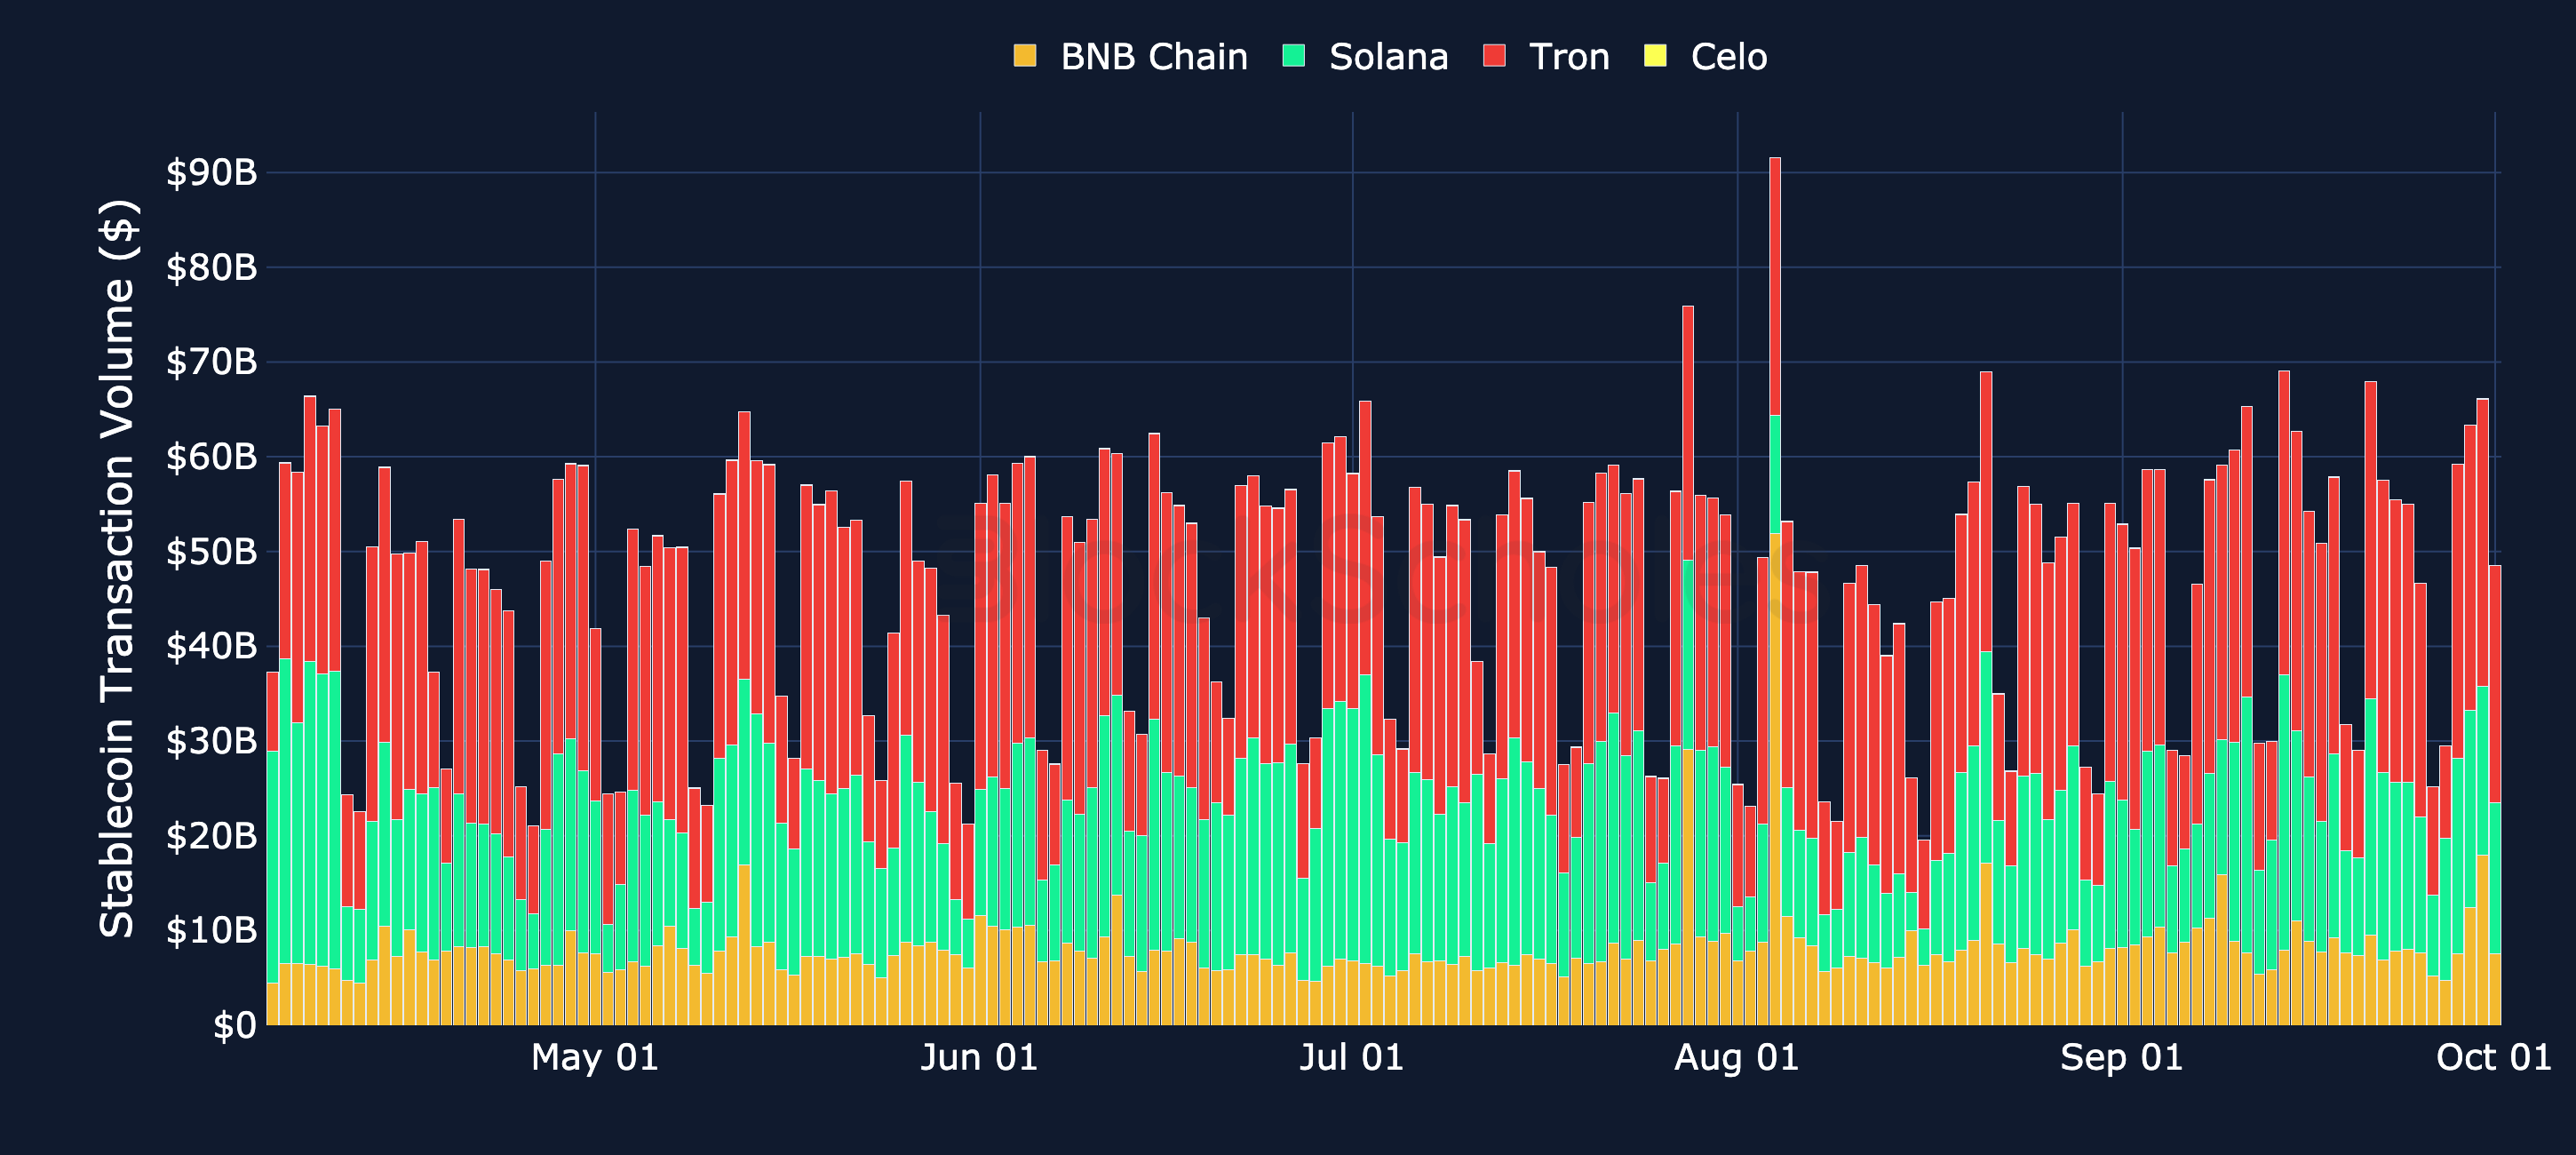
Figure 3. Stablecoin transaction volume by chain, USD. Source: Artemis, Block Scholes.
Real World Assets
RWA Perpetual Volume
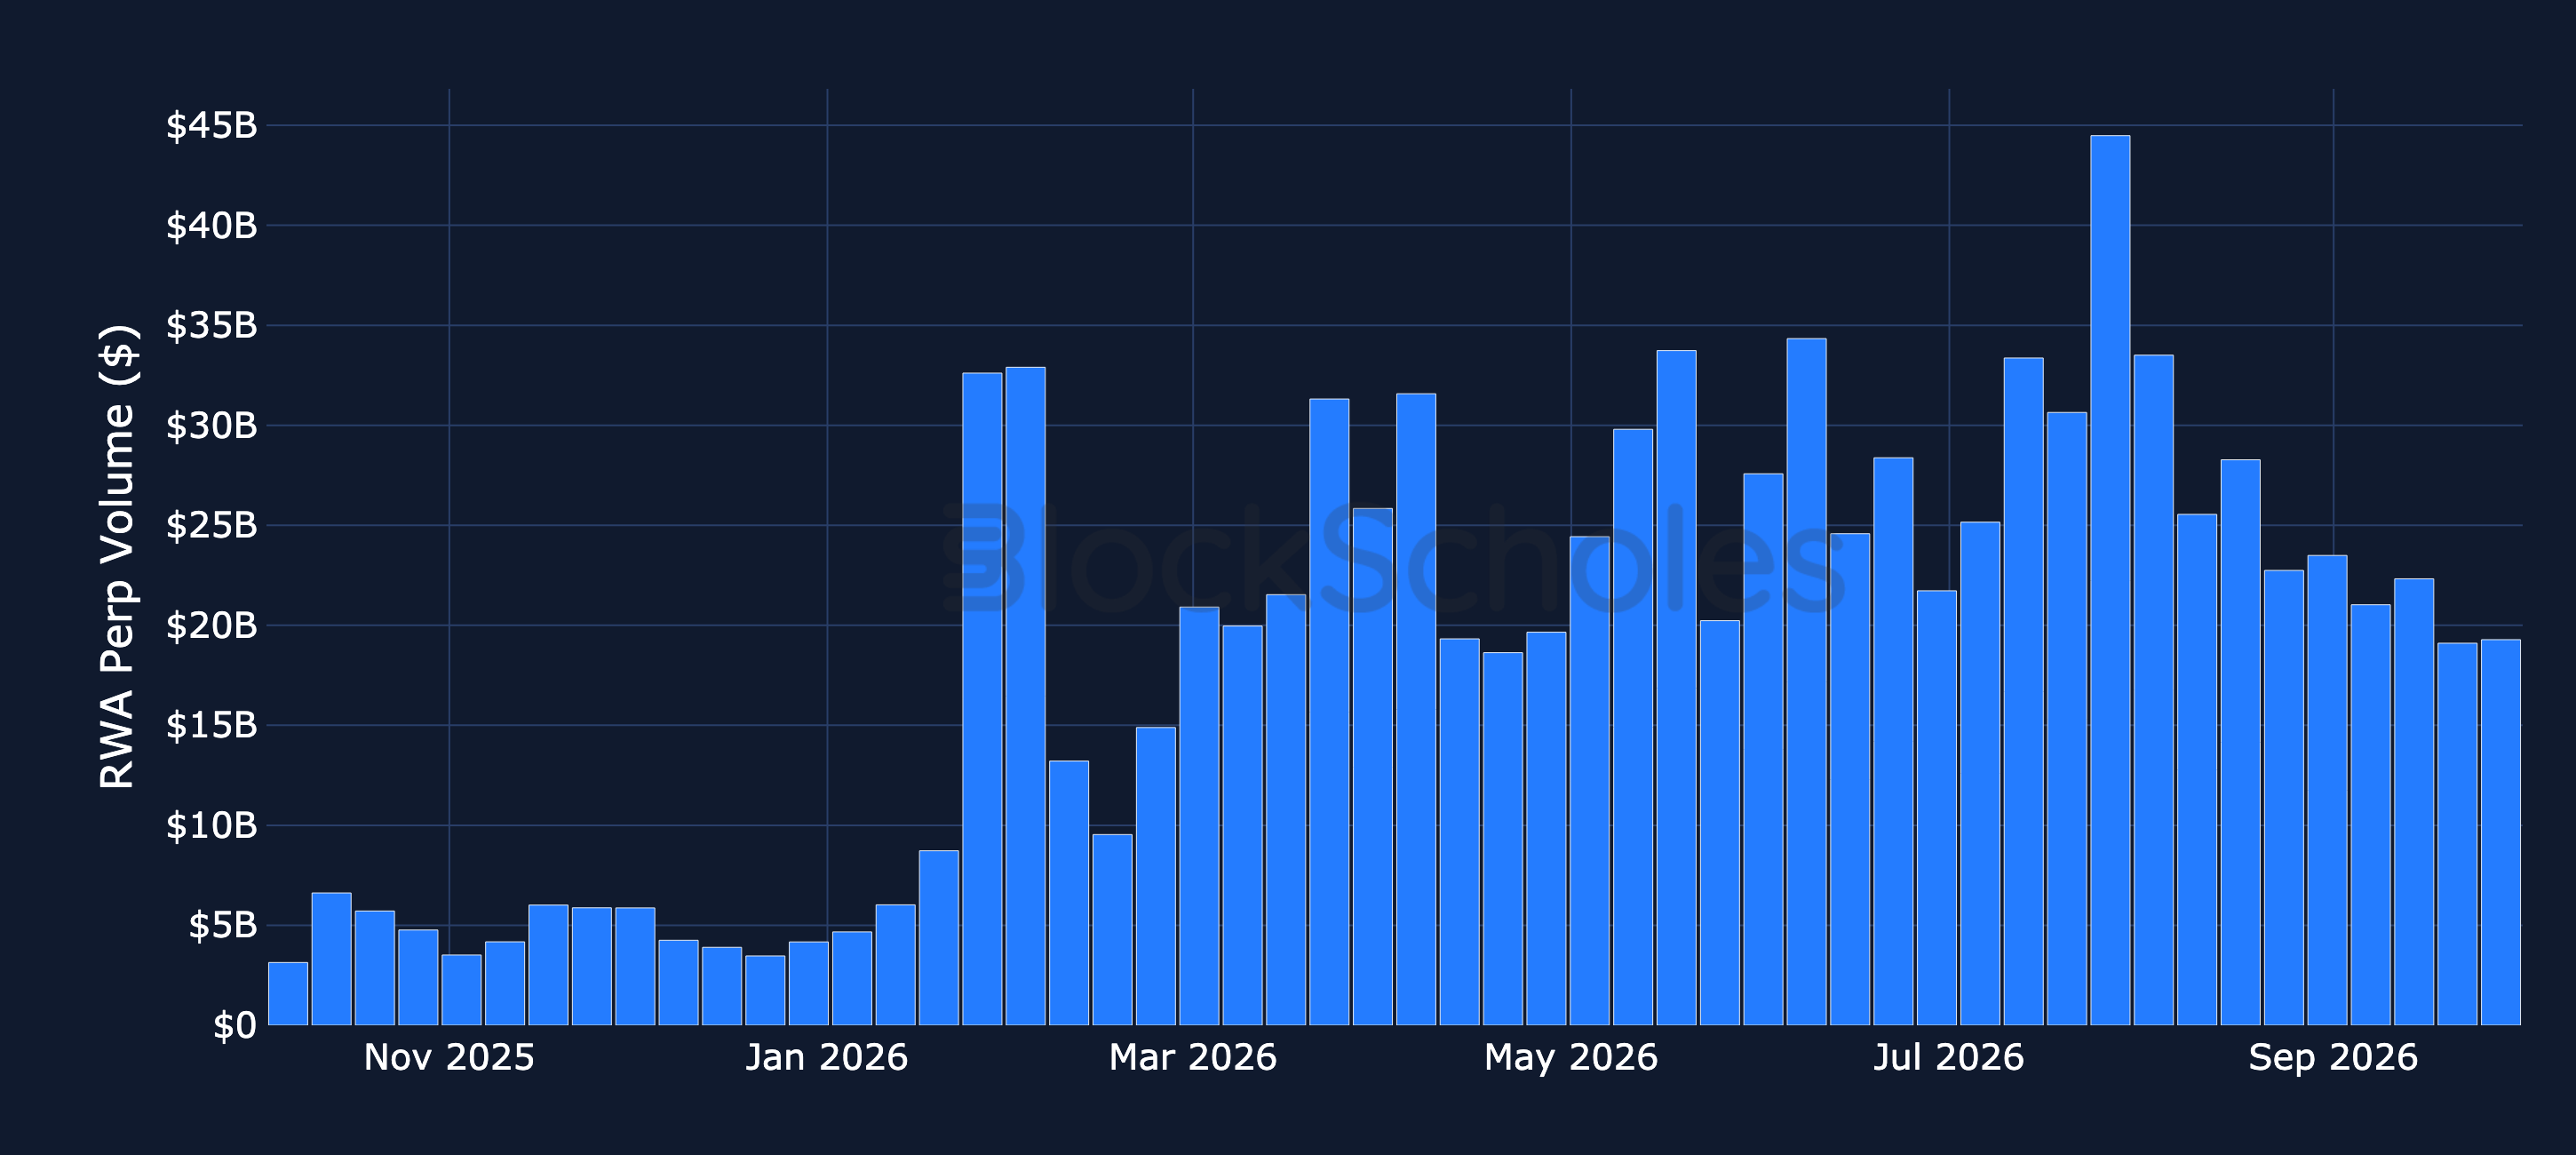
Figure 4. Weekly trading volume in real-world-asset perpetual futures, USD. Source: Artemis, Block Scholes.
RWA Open Interest
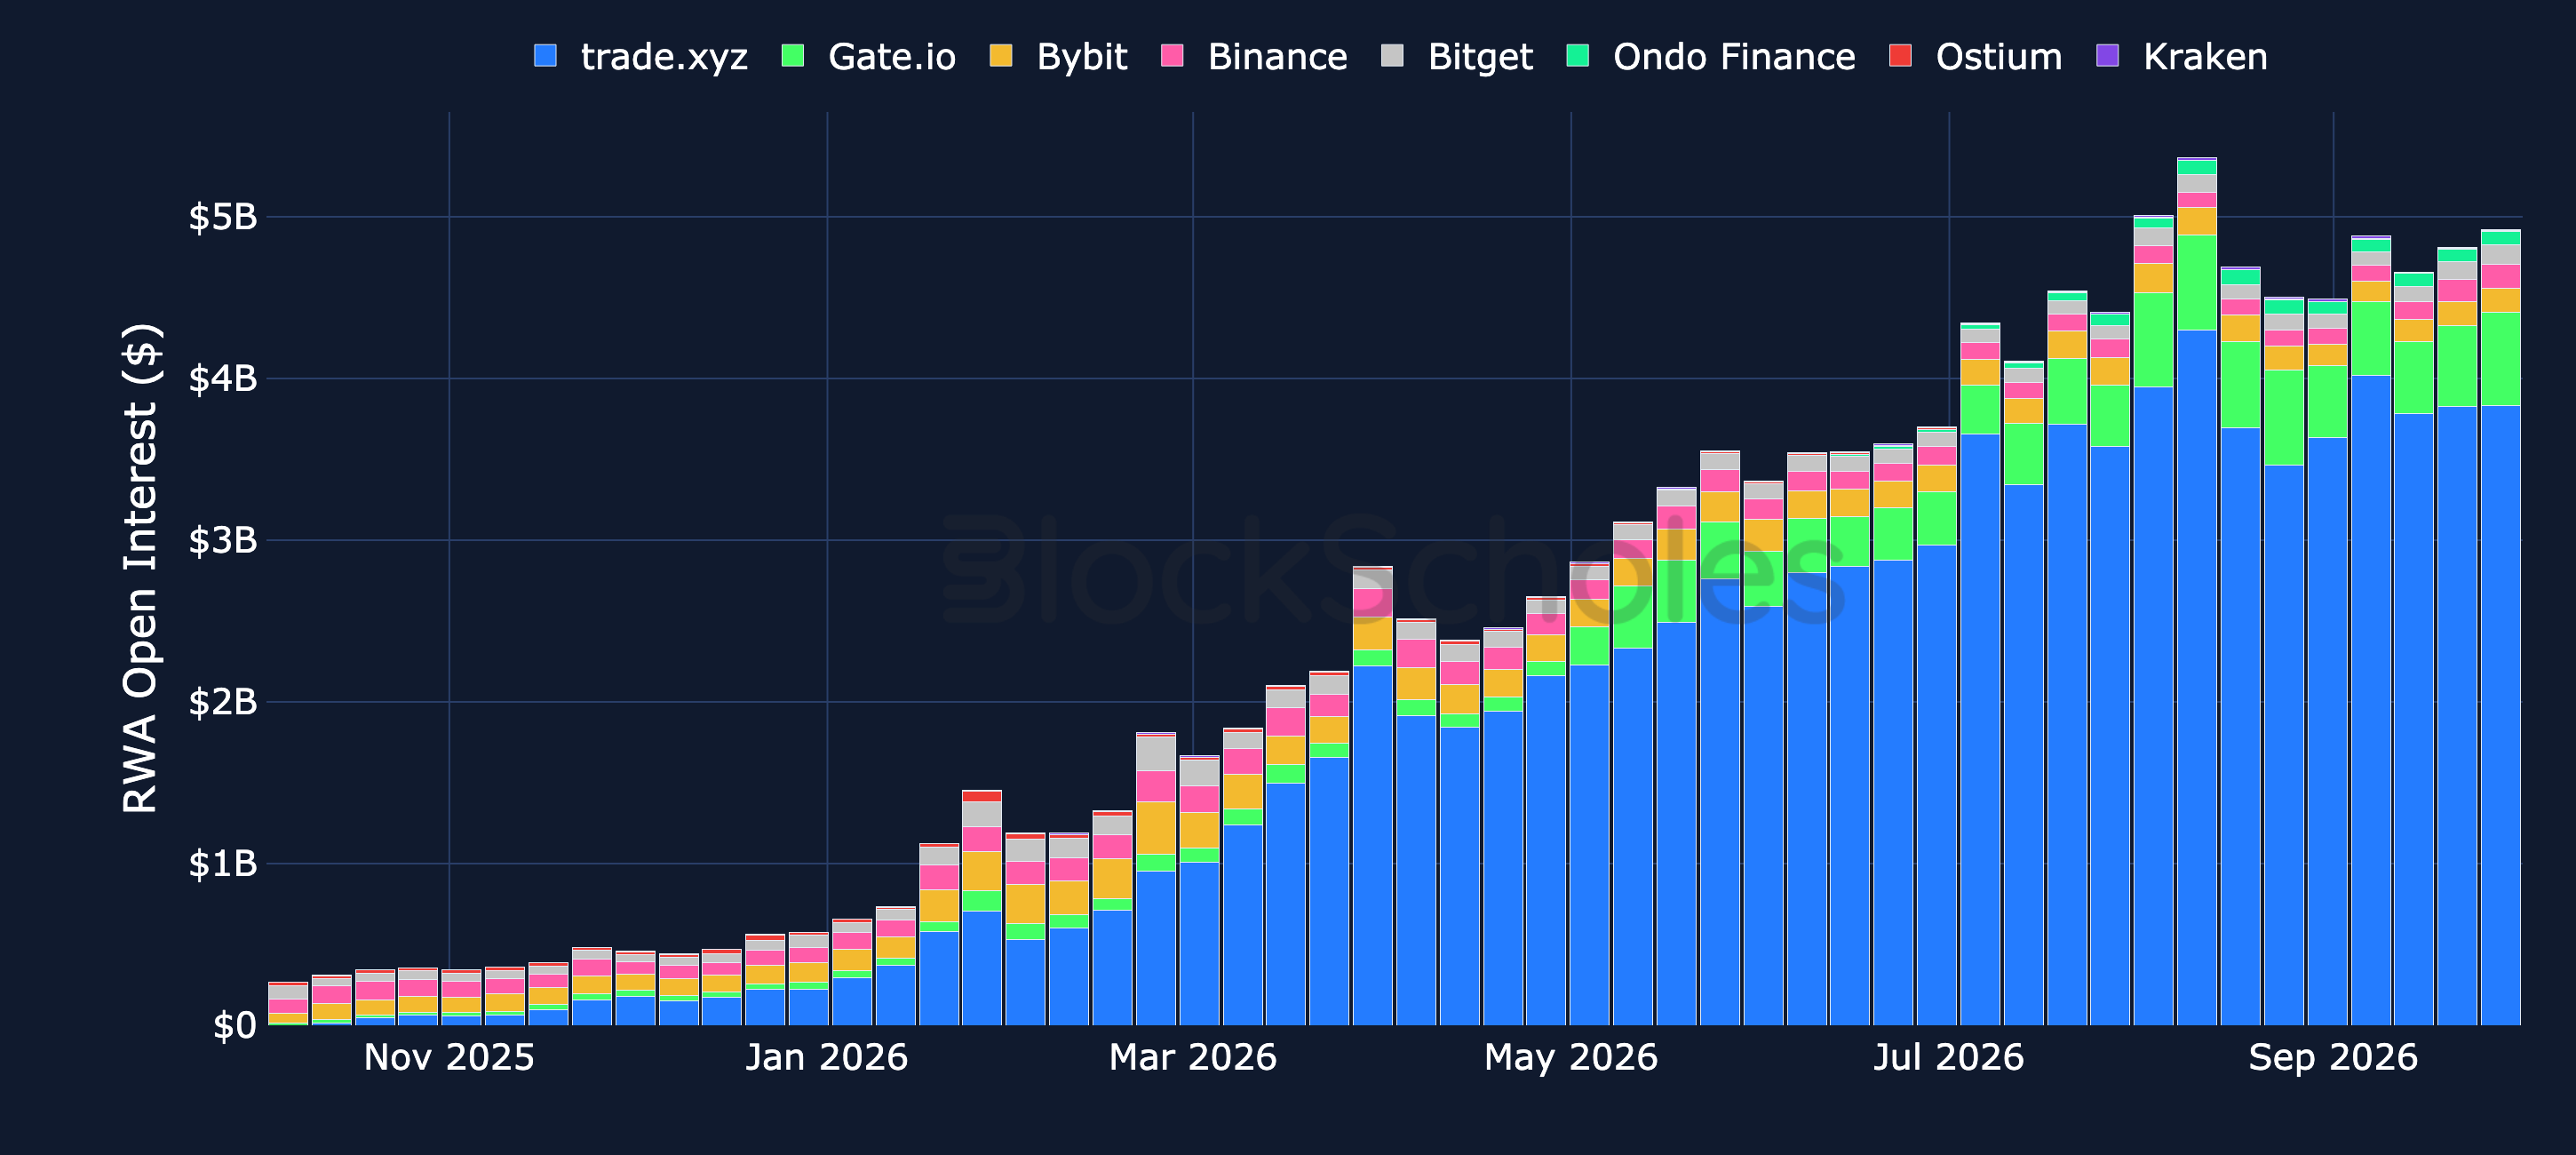
Figure 5. Open interest in real-world-asset perpetual futures by venue, USD. Source: Artemis, Block Scholes.
Ethereum Gas Market
Hourly Average Gas Fees Burnt per Block
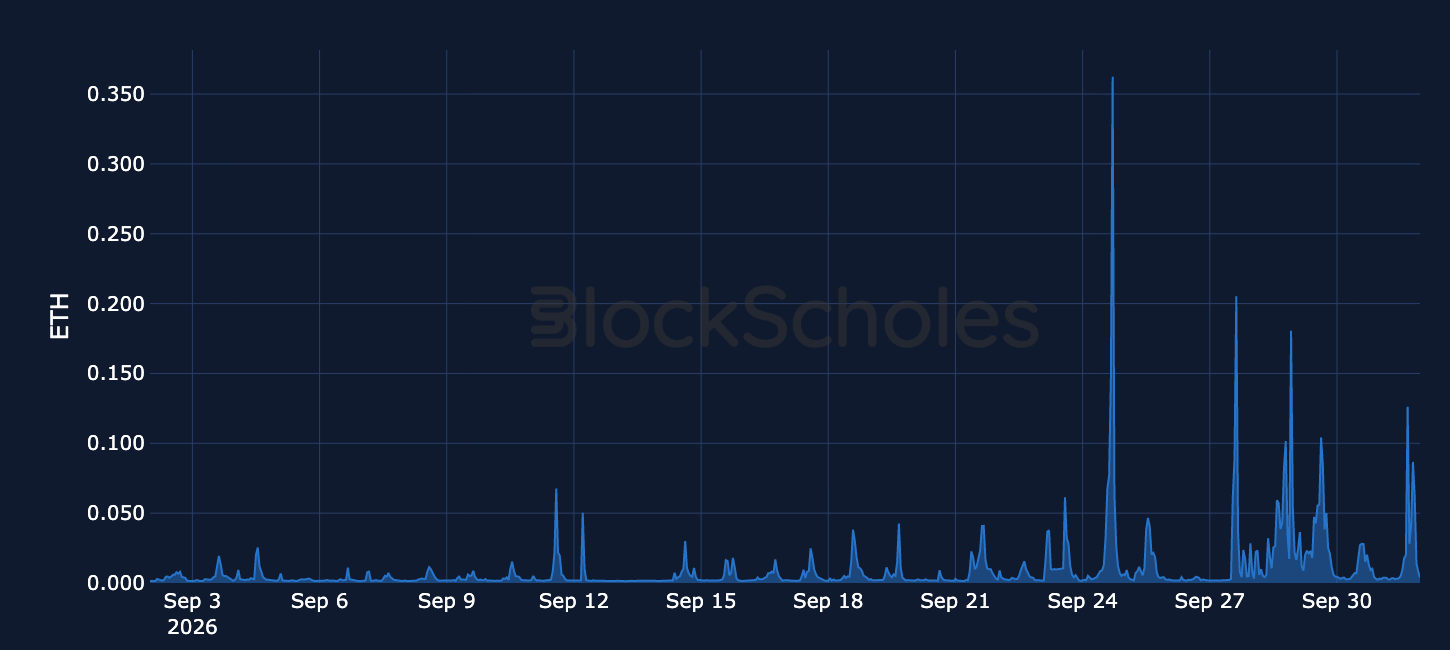
Figure 6. Hourly average gas fees burnt per Ethereum block. Source: Dune, Block Scholes.
Hourly Average Cost to Transfer ETH (21,000 Gas)
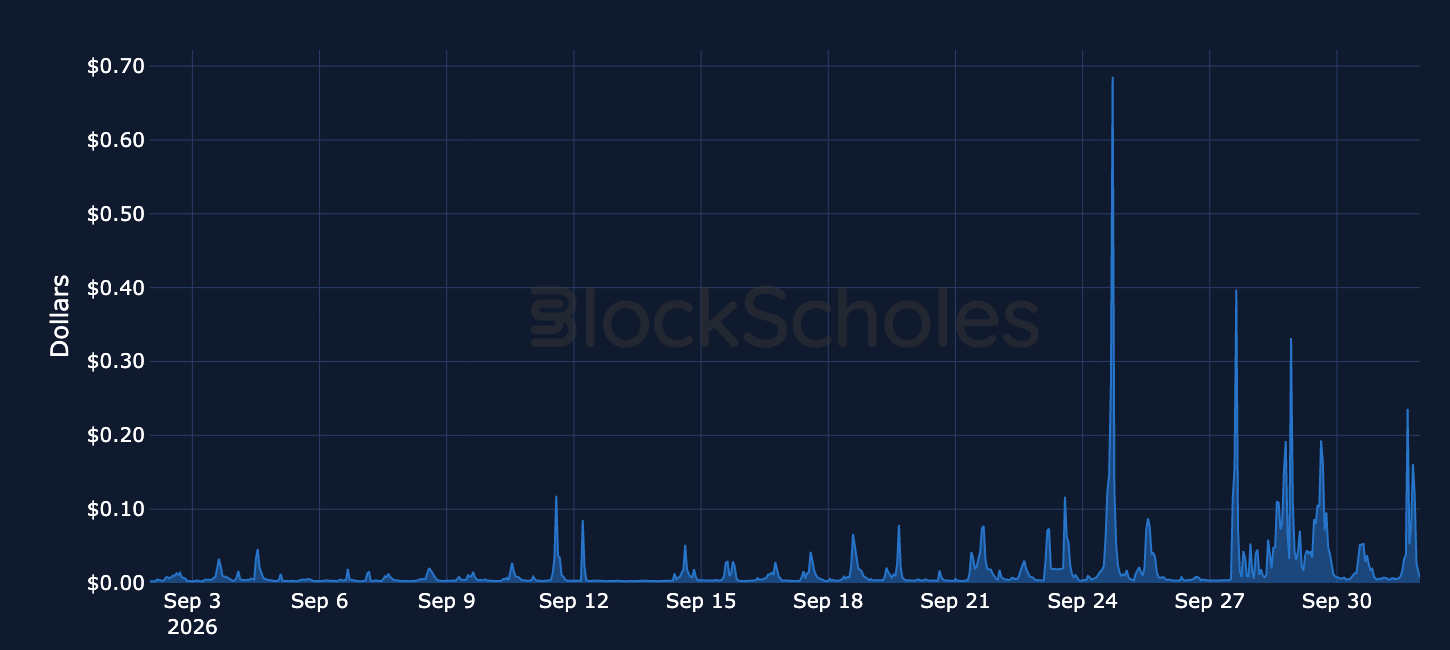
Figure 7. Hourly average cost of a standard ETH transfer (21,000 gas), USD. Source: Dune, Block Scholes.
Hourly Average Blob Gas Usage per Ethereum Block (Target: 6 Blobs)
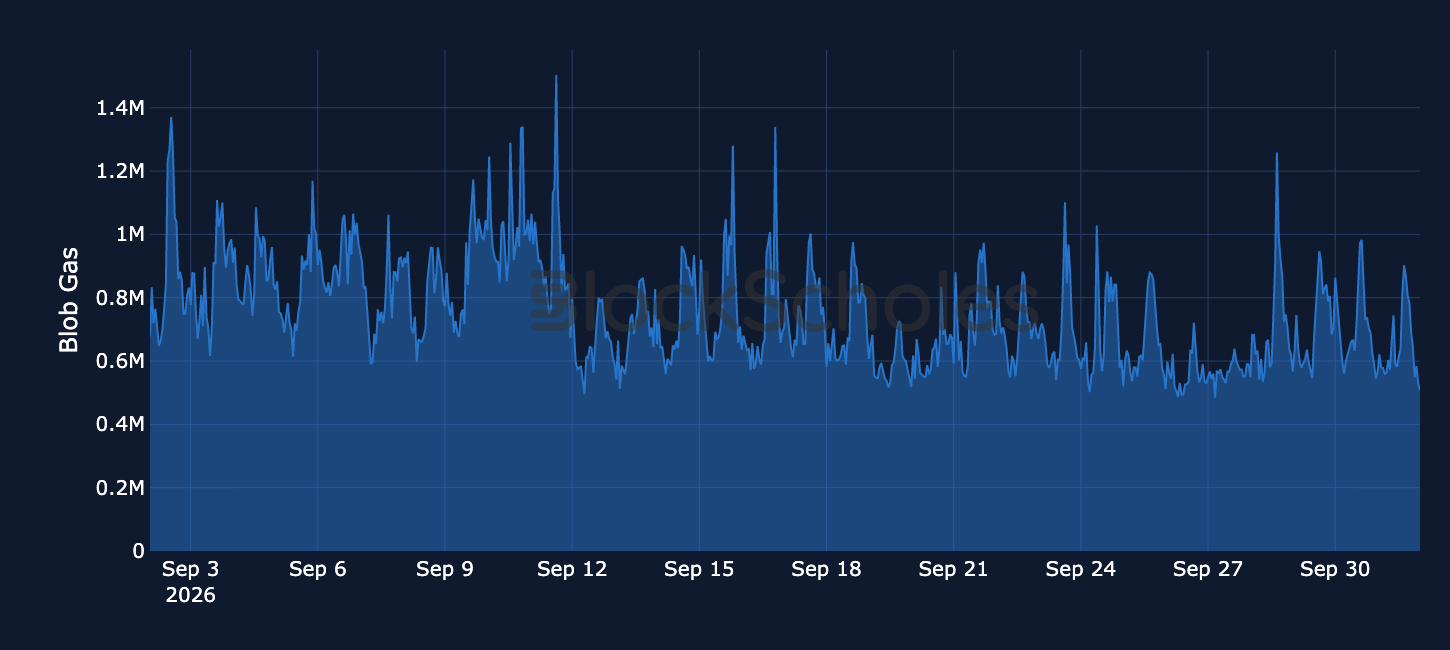
Figure 8. Hourly average blob gas used per Ethereum block against the six-blob target. Source: Dune, Block Scholes.
Hourly Average Excess Blob Gas per Ethereum Block
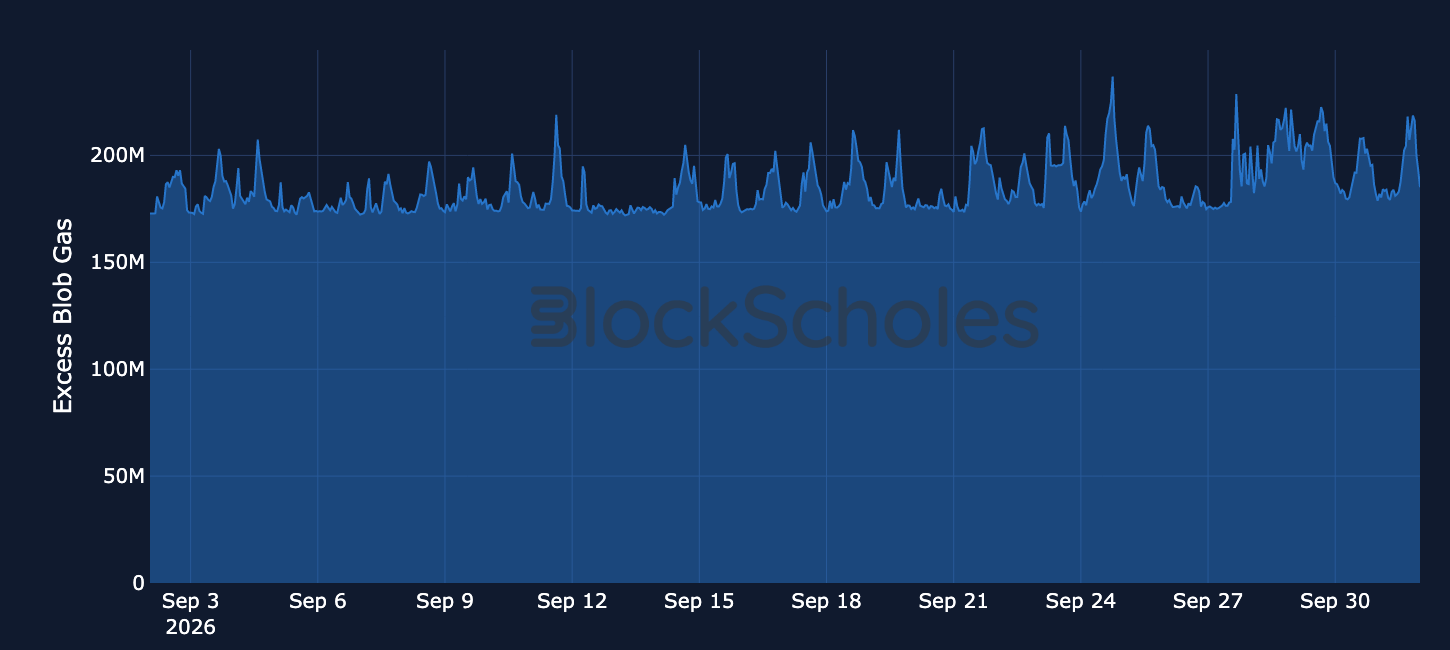
Figure 9. Hourly average excess blob gas per Ethereum block. Source: Dune, Block Scholes.
Beacon Chain
Beacon Chain Summary
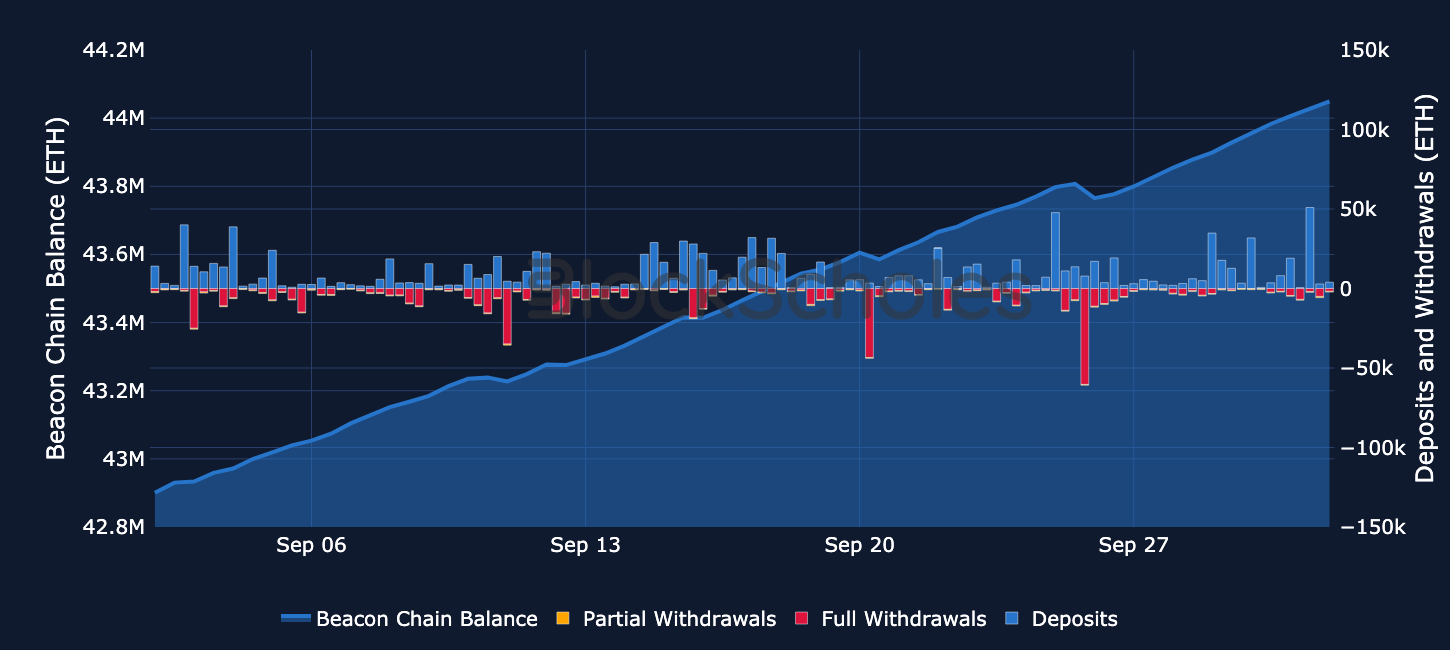
Figure 10. Beacon Chain balance in ETH (left-hand axis) with daily deposits, partial and full withdrawals (right-hand axis). Source: Dune, Block Scholes.
Beacon Chain Balance
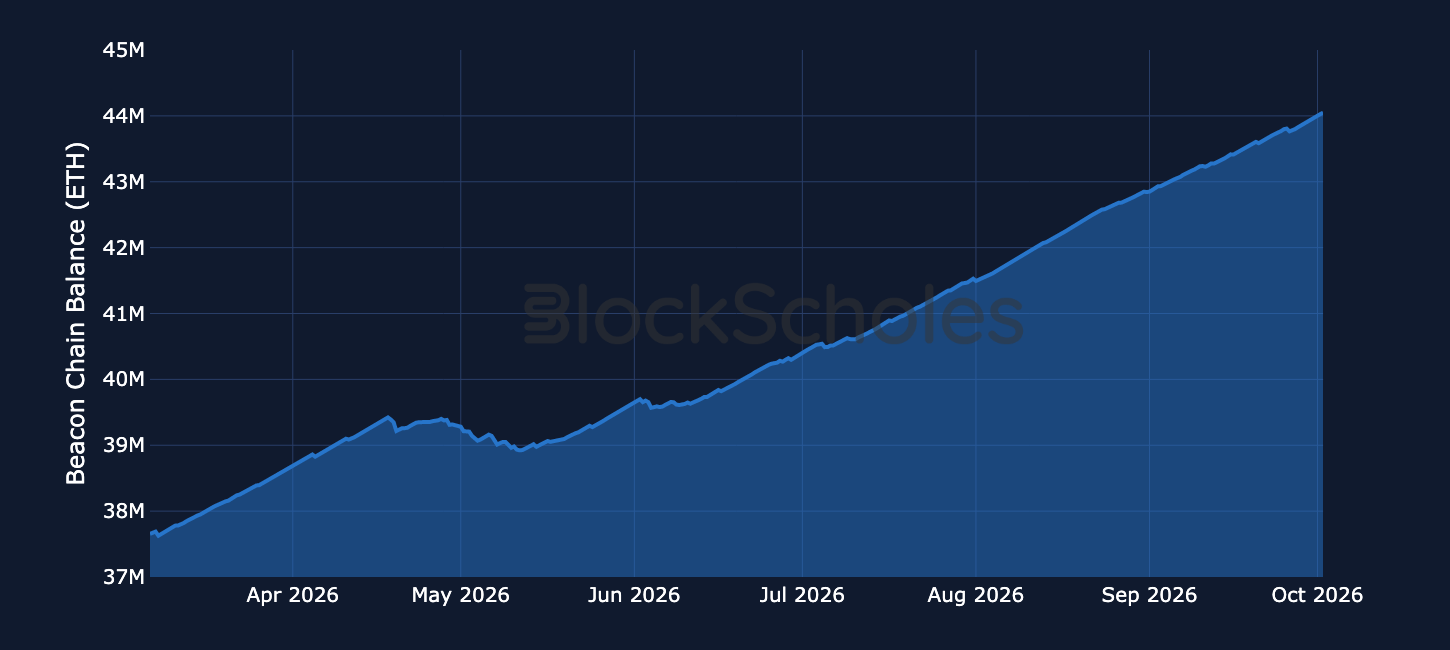
Figure 11. Total ETH staked on the Beacon Chain. Source: Dune, Block Scholes.
Beacon Chain - The Beacon Chain balance has kept rising, to around 44M ETH, or more than a third of supply. That growth is the problem EIP-8363 set out to tackle: it would have burnt a rising share of validator rewards as the total stake grew, reaching all of them at roughly 60M ETH, about half of supply. At the 34% staking ratio of mid-August, consensus yield would have dropped from about 2.6% to 1.2%. On Thursday its authors withdrew it from consideration for Hegota, the hard fork planned after Glamsterdam, after core contributors and industry participants argued that a fork's scoping process was the wrong place to settle issuance policy. The idea has not been abandoned: the authors plan a separate track of forums and workshops running to EthCC in April, with Lido offering to help steer it.
Uniswap V3
Uniswap V3 Hourly Volumes - Arbitrum
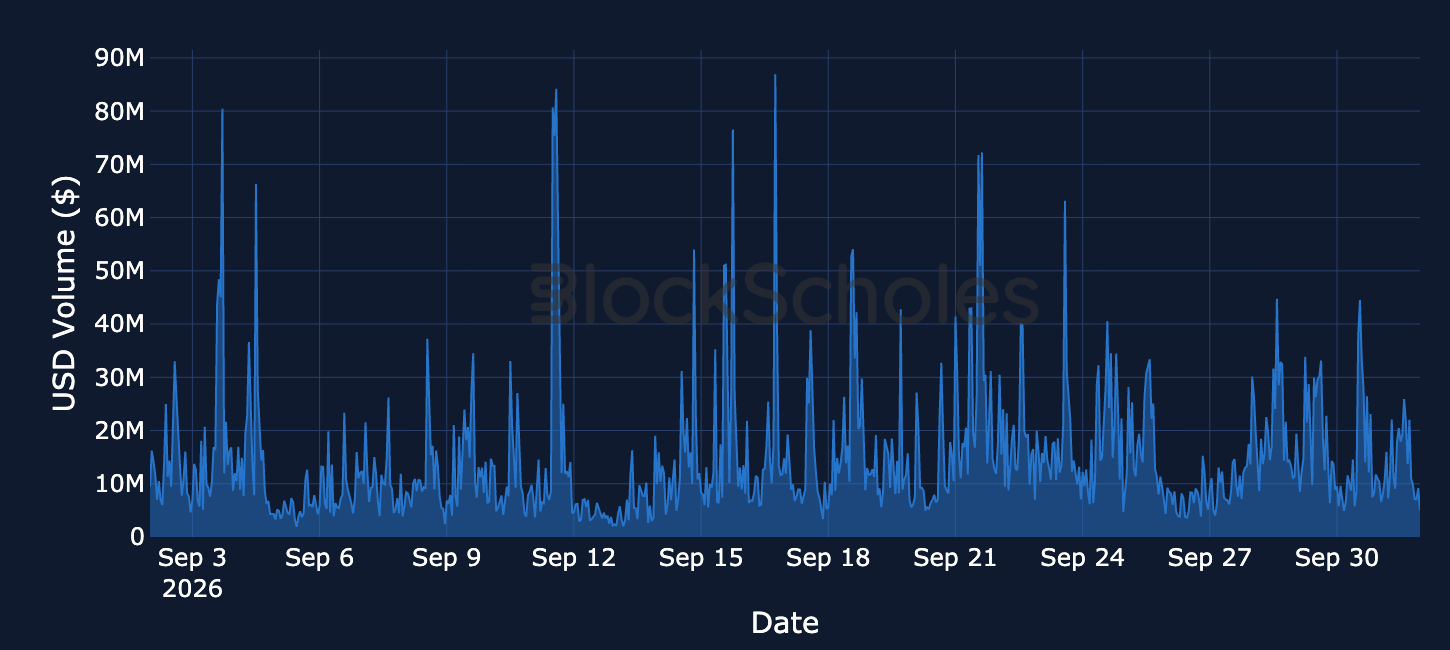
Figure 12. Hourly Uniswap V3 trading volume on Arbitrum, USD. Source: Dune, Block Scholes.
Uniswap V3 Hourly Transaction Count - Arbitrum
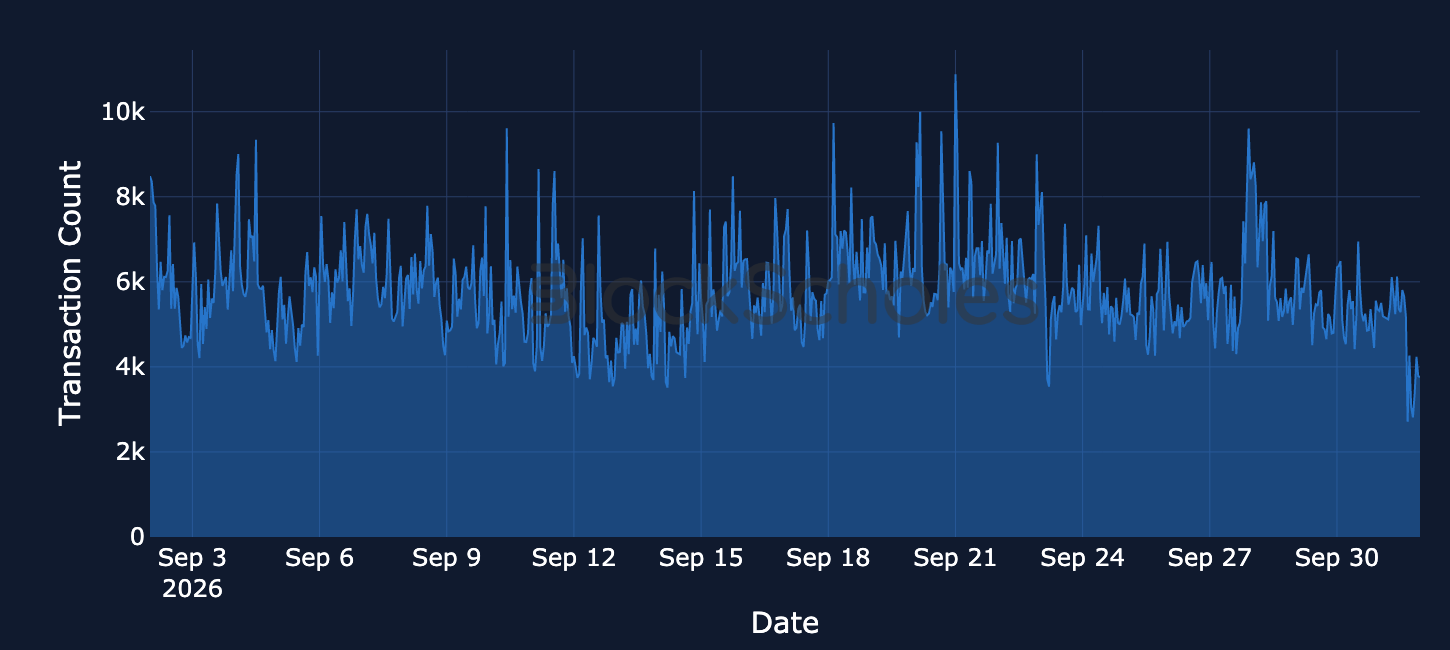
Figure 13. Hourly Uniswap V3 transaction count on Arbitrum. Source: Dune, Block Scholes.
Liquidations
Liquidations across Aave & Compound
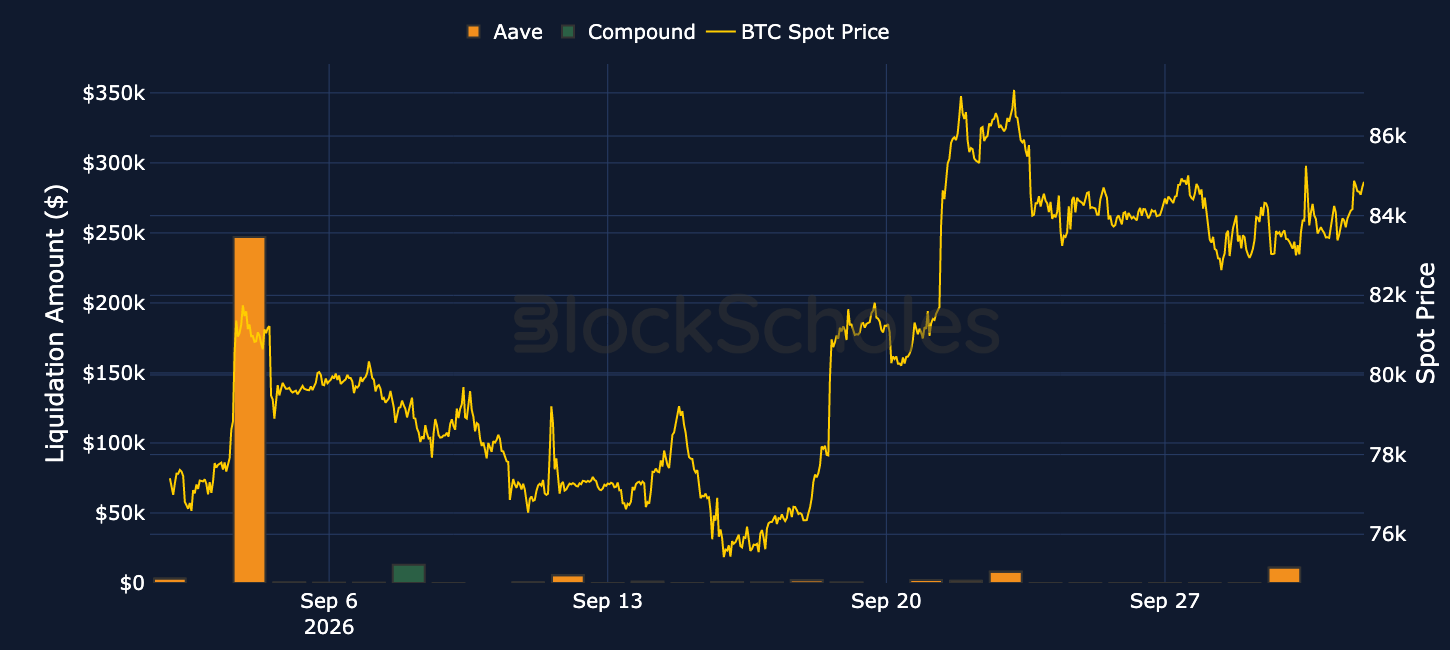
Figure 14. Daily liquidation amounts on Aave (orange) and Compound (green) with the BTC spot price (yellow, right-hand axis). Source: Dune, Block Scholes.


Free
PREMIUM
Institutional
DeFi Analytics 2nd October 2026
This week's edition of our Crypto DeFi Analytics.

Free
PREMIUM
Institutional
The SEC Proposed Letting Investment Advisers Use State Trust Companies as Crypto Custodians
The SEC has proposed a new crypto custody framework that would let investment advisers and regulated funds use state trust companies as crypto custodians and, in limited cases, self-custody digital assets. US equities posted their first green day of the week as the 10-year Treasury yield eased to around 5.23% from a 5.34% high after Fed Vice Chair Jefferson said policymakers may need more time, cutting the odds of an October hike to 26% from 71% at the start of the week. BTC rallied to almost $87K, while Evernorth shareholders approved its merger ahead of a planned Nasdaq listing on Oct. 8.
Free
PREMIUM
Institutional
Softer August PCE Inflation Cut the Odds of an October Fed Hike to 37% From 70% on Monday
US inflation rose less than expected in August, with the PCE Price Index up 0.3% on the month and 3.4% over the year against expectations of 0.4% and 3.7%, partly reflecting changes to the BEA's methodology. Fed funds futures now price a 37% probability of an October rate move, down from 70% on Monday, while the BEA revised Q2 GDP growth up to a 2.2% annualised rate from 1.5%, sending long-end Treasury yields higher. The S&P 500 ended 0.25% lower to close out its worst month since June 2026, while BTC briefly jumped past $85K before falling back to $83K.