
Back to Research
Last Updated:  
November 5, 2026
•
4 Minutes

Crypto Risk Appetite Report 4th November 2026

This week's edition of our Market Sentiment Report.

BLOCK SCHOLES BTC RISK APPETITE INDEX

Risk appetite in BTC continued to decline over the past week following Binance’s $6.3B hack announcement, a wider retreat from risk in US equities and most recently, as Democrats won control of both the House and Senate in a decisive blue wave.
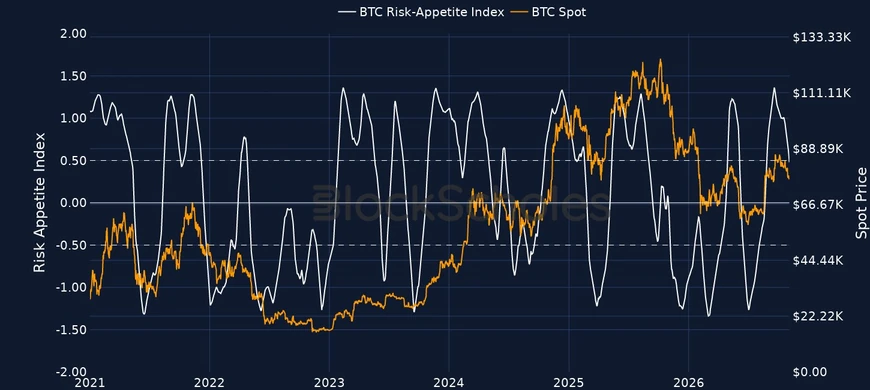
Figure 1. Block Scholes BTC Risk-Appetite Index (white, left axis) against the BTC spot price (right axis). Source: Block Scholes.
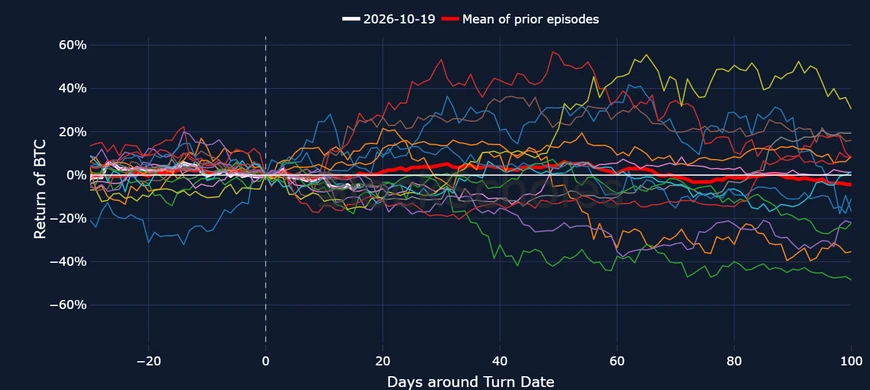
Figure 1. Block Scholes BTC Risk-Appetite Index (white, left axis) against the BTC spot price (right axis). Source: Block Scholes.

BTC SPOT RETURNS AFTER RISK APPETITE INDEX CROSSES 1.0 THRESHOLD FROM ABOVE:

Figure 2. BTC spot returns in the days around each time the BTC Risk-Appetite Index crossed down through 1.0, with the current episode in white and the mean of prior episodes in red. Source: Block Scholes.

Figure 2. BTC spot returns in the days around each time the BTC Risk-Appetite Index crossed down through 1.0, with the current episode in white and the mean of prior episodes in red. Source: Block Scholes.

BLOCK SCHOLES ETH RISK APPETITE INDEX

Our Risk Appetite Index for ETH is moving below zero, a region which has typically been characterised by more bearish sentiment in the market. That’s coincided with seven straight days of outflows from Spot Ethereum exchange-traded funds.
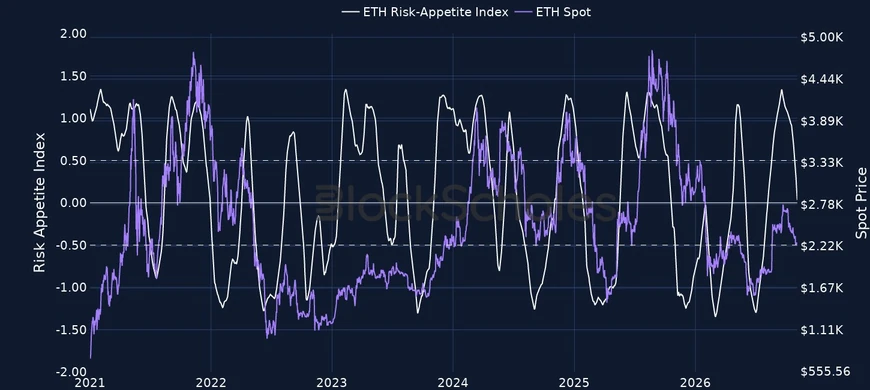
Figure 3. Block Scholes ETH Risk-Appetite Index (white, left axis) against the ETH spot price (right axis). Source: Block Scholes.
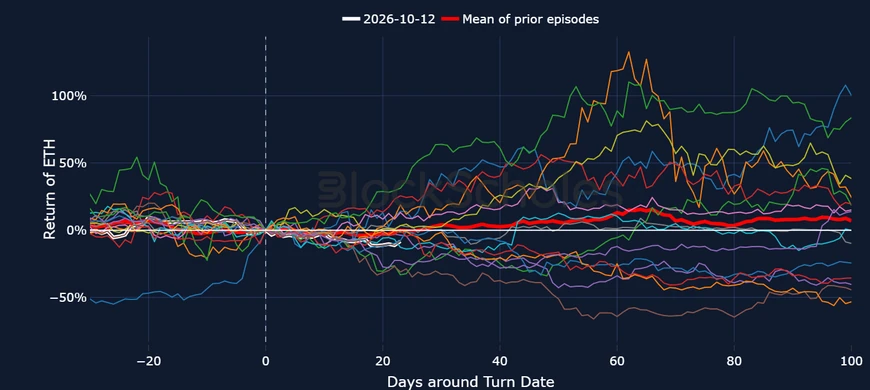
Figure 3. Block Scholes ETH Risk-Appetite Index (white, left axis) against the ETH spot price (right axis). Source: Block Scholes.

ETH SPOT RETURNS AFTER RISK APPETITE INDEX CROSSES 1.0 THRESHOLD FROM ABOVE:

Figure 4. ETH spot returns in the days around each time the ETH Risk-Appetite Index crossed down through 1.0, with the current episode in white and the mean of prior episodes in red. Source: Block Scholes.

Figure 4. ETH spot returns in the days around each time the ETH Risk-Appetite Index crossed down through 1.0, with the current episode in white and the mean of prior episodes in red. Source: Block Scholes.

Data behind Risk Appetite charts: BlockScholes BTC/ETH/ SOL/ SUI/ XRP composite spot index price. Available via the BlockScholes REST API.
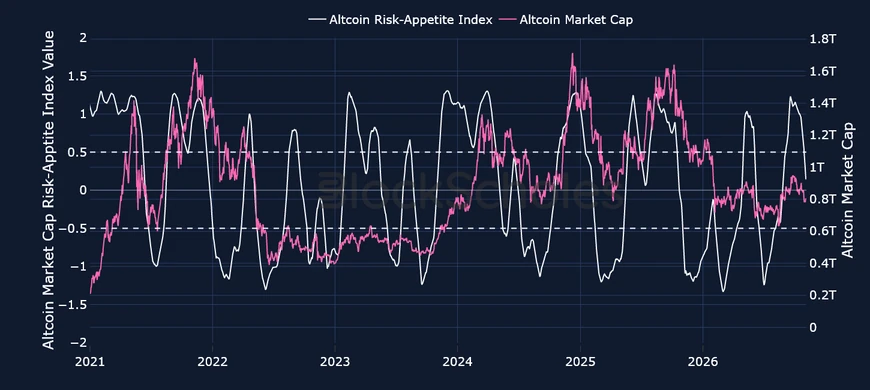
BLOCK SCHOLES ALTCOIN RISK APPETITE INDEX

Figure 5. Block Scholes Altcoin Risk-Appetite Index (white, left axis) against altcoin market capitalisation (right axis). Source: Block Scholes.
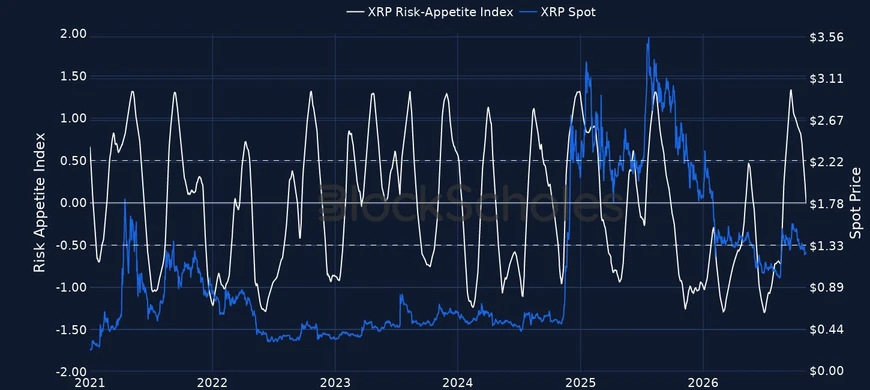
Figure 5. Block Scholes Altcoin Risk-Appetite Index (white, left axis) against altcoin market capitalisation (right axis). Source: Block Scholes.

BLOCK SCHOLES XRP RISK APPETITE INDEX

Figure 6. Block Scholes XRP Risk-Appetite Index (white, left axis) against the XRP spot price (right axis). Source: Block Scholes.
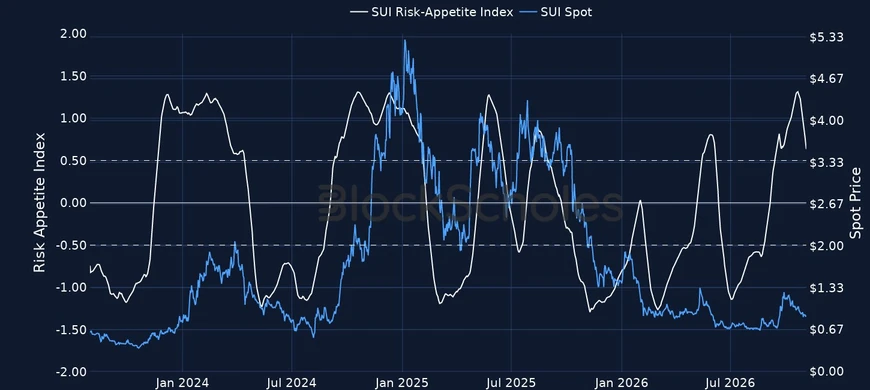
Figure 6. Block Scholes XRP Risk-Appetite Index (white, left axis) against the XRP spot price (right axis). Source: Block Scholes.

BLOCK SCHOLES SUI RISK APPETITE INDEX

Figure 7. Block Scholes SUI Risk-Appetite Index (white, left axis) against the SUI spot price (right axis). Source: Block Scholes.
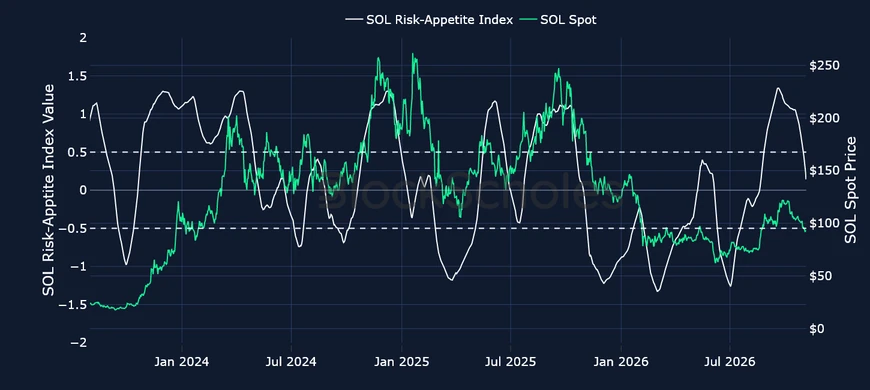
Figure 7. Block Scholes SUI Risk-Appetite Index (white, left axis) against the SUI spot price (right axis). Source: Block Scholes.

BLOCK SCHOLES SOL RISK APPETITE INDEX

Figure 8. Block Scholes SOL Risk-Appetite Index (white, left axis) against the SOL spot price (right axis). Source: Block Scholes.


Figure 8. Block Scholes SOL Risk-Appetite Index (white, left axis) against the SOL spot price (right axis). Source: Block Scholes.

Share this post
Copy URL
https://www.blockscholes.com/premium-research/crypto-risk-appetite-report-4th-november-2026

BLOCK SCHOLES BTC RISK APPETITE INDEX

Risk appetite in BTC continued to decline over the past week following Binance’s $6.3B hack announcement, a wider retreat from risk in US equities and most recently, as Democrats won control of both the House and Senate in a decisive blue wave.

Figure 1. Block Scholes BTC Risk-Appetite Index (white, left axis) against the BTC spot price (right axis). Source: Block Scholes.

Figure 1. Block Scholes BTC Risk-Appetite Index (white, left axis) against the BTC spot price (right axis). Source: Block Scholes.

BTC SPOT RETURNS AFTER RISK APPETITE INDEX CROSSES 1.0 THRESHOLD FROM ABOVE:

Figure 2. BTC spot returns in the days around each time the BTC Risk-Appetite Index crossed down through 1.0, with the current episode in white and the mean of prior episodes in red. Source: Block Scholes.

Figure 2. BTC spot returns in the days around each time the BTC Risk-Appetite Index crossed down through 1.0, with the current episode in white and the mean of prior episodes in red. Source: Block Scholes.

BLOCK SCHOLES ETH RISK APPETITE INDEX

Our Risk Appetite Index for ETH is moving below zero, a region which has typically been characterised by more bearish sentiment in the market. That’s coincided with seven straight days of outflows from Spot Ethereum exchange-traded funds.

Figure 3. Block Scholes ETH Risk-Appetite Index (white, left axis) against the ETH spot price (right axis). Source: Block Scholes.

Figure 3. Block Scholes ETH Risk-Appetite Index (white, left axis) against the ETH spot price (right axis). Source: Block Scholes.

ETH SPOT RETURNS AFTER RISK APPETITE INDEX CROSSES 1.0 THRESHOLD FROM ABOVE:

‍

‍

‍

‍

‍

‍

‍

‍

‍

‍

‍

‍

‍

‍

‍

‍

‍

‍

BLOCK SCHOLES BTC RISK APPETITE INDEX

Risk appetite in BTC continued to decline over the past week following Binance’s $6.3B hack announcement, a wider retreat from risk in US equities and most recently, as Democrats won control of both the House and Senate in a decisive blue wave.

Figure 1. Block Scholes BTC Risk-Appetite Index (white, left axis) against the BTC spot price (right axis). Source: Block Scholes.

Figure 1. Block Scholes BTC Risk-Appetite Index (white, left axis) against the BTC spot price (right axis). Source: Block Scholes.

BTC SPOT RETURNS AFTER RISK APPETITE INDEX CROSSES 1.0 THRESHOLD FROM ABOVE:

Figure 2. BTC spot returns in the days around each time the BTC Risk-Appetite Index crossed down through 1.0, with the current episode in white and the mean of prior episodes in red. Source: Block Scholes.

Figure 2. BTC spot returns in the days around each time the BTC Risk-Appetite Index crossed down through 1.0, with the current episode in white and the mean of prior episodes in red. Source: Block Scholes.

BLOCK SCHOLES ETH RISK APPETITE INDEX

Our Risk Appetite Index for ETH is moving below zero, a region which has typically been characterised by more bearish sentiment in the market. That’s coincided with seven straight days of outflows from Spot Ethereum exchange-traded funds.

Figure 3. Block Scholes ETH Risk-Appetite Index (white, left axis) against the ETH spot price (right axis). Source: Block Scholes.

Figure 3. Block Scholes ETH Risk-Appetite Index (white, left axis) against the ETH spot price (right axis). Source: Block Scholes.

ETH SPOT RETURNS AFTER RISK APPETITE INDEX CROSSES 1.0 THRESHOLD FROM ABOVE:

‍

‍

‍

‍

‍

‍

‍

‍

‍

‍

‍

‍

‍

‍

‍

‍

‍

‍