Back to Research
Last Updated:  
September 21, 2026
6 Minutes

Altcoins Analytics 21st September 2026

This week's edition of our Crypto Altcoins Analytics.

BTC & Altcoin Dominance

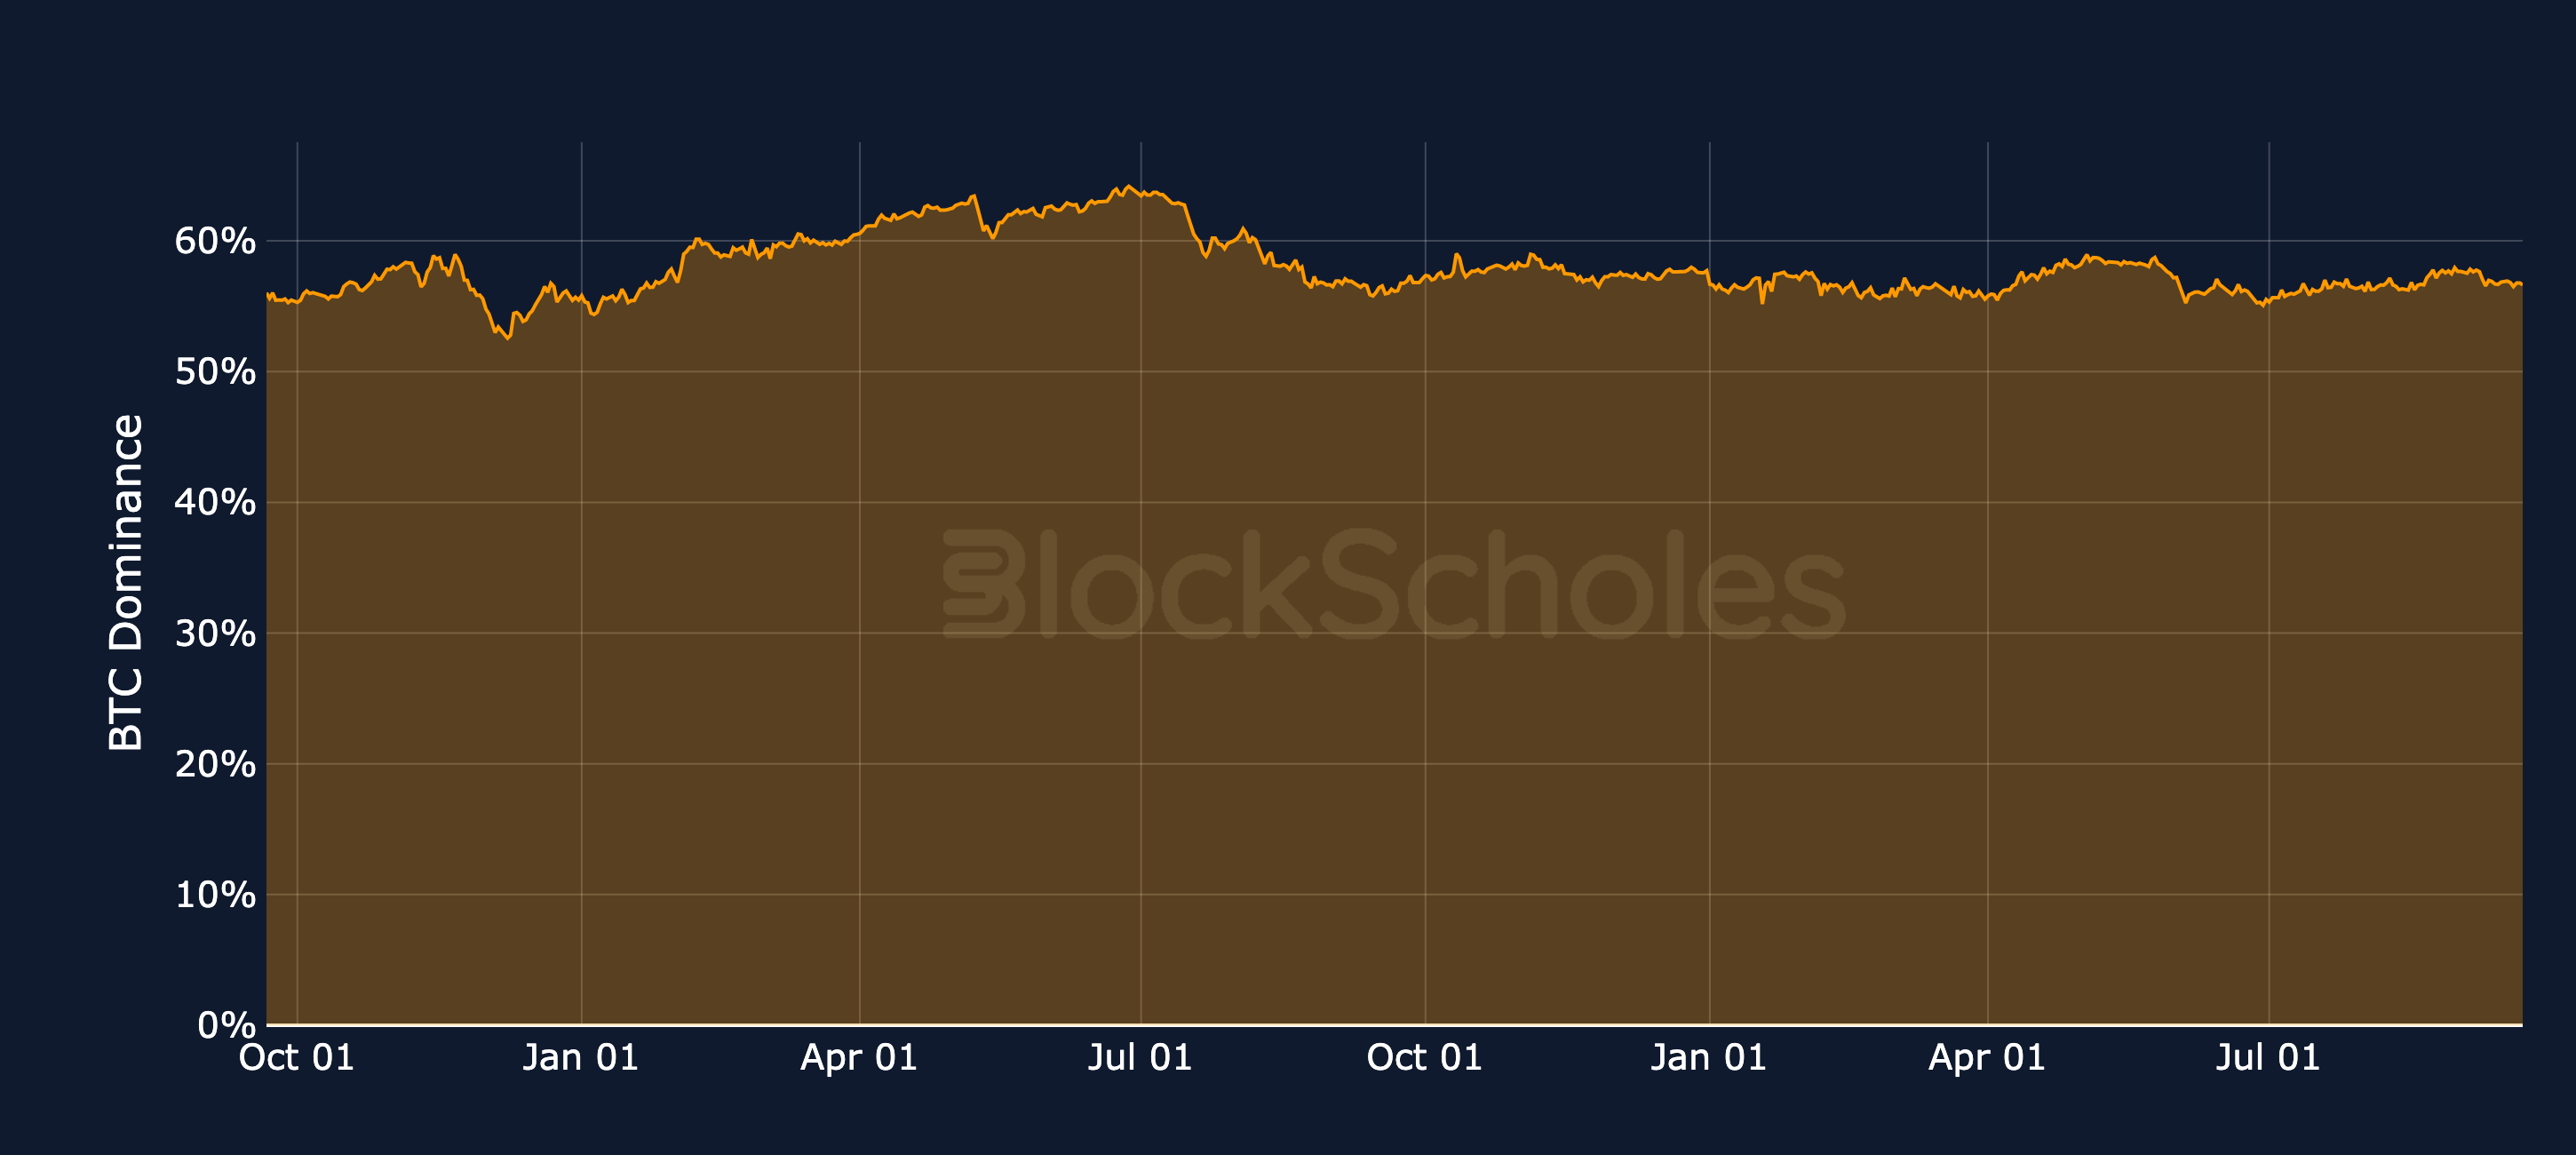
BTC Dominance

Figure 1. Bitcoin's market capitalisation as a share of the total crypto market capitalisation. Source: CoinGecko, Block Scholes.
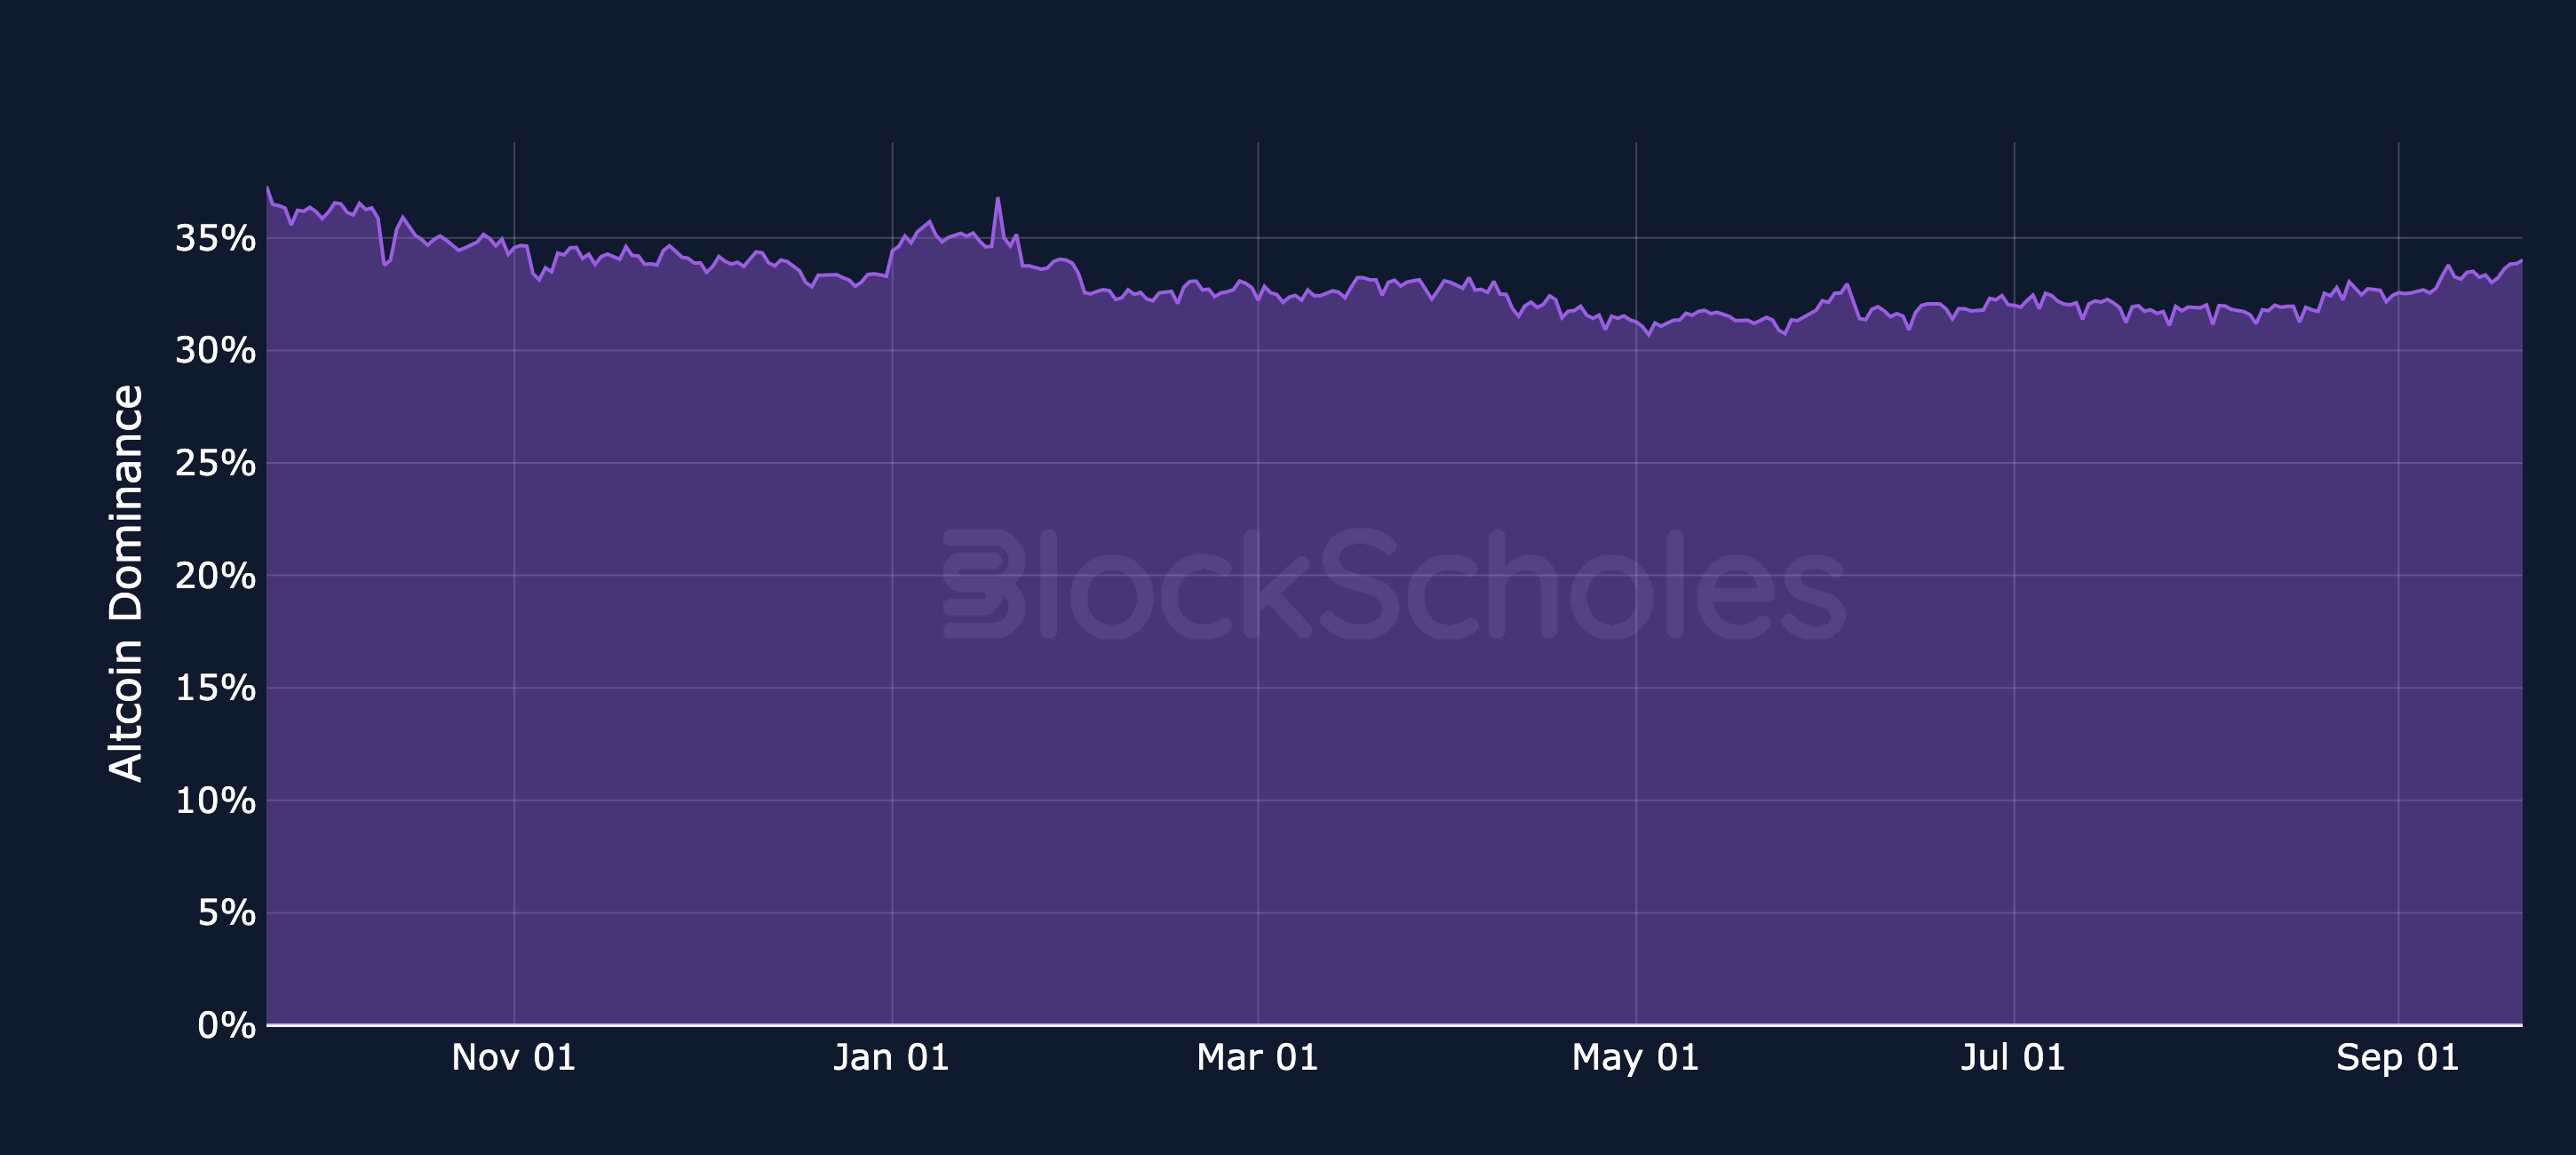
Figure 1. Bitcoin's market capitalisation as a share of the total crypto market capitalisation. Source: CoinGecko, Block Scholes.

Altcoin Dominance

Figure 2. Market capitalisation of altcoins, excluding BTC and stablecoins, as a share of the total crypto market capitalisation. Source: CoinGecko, Block Scholes.
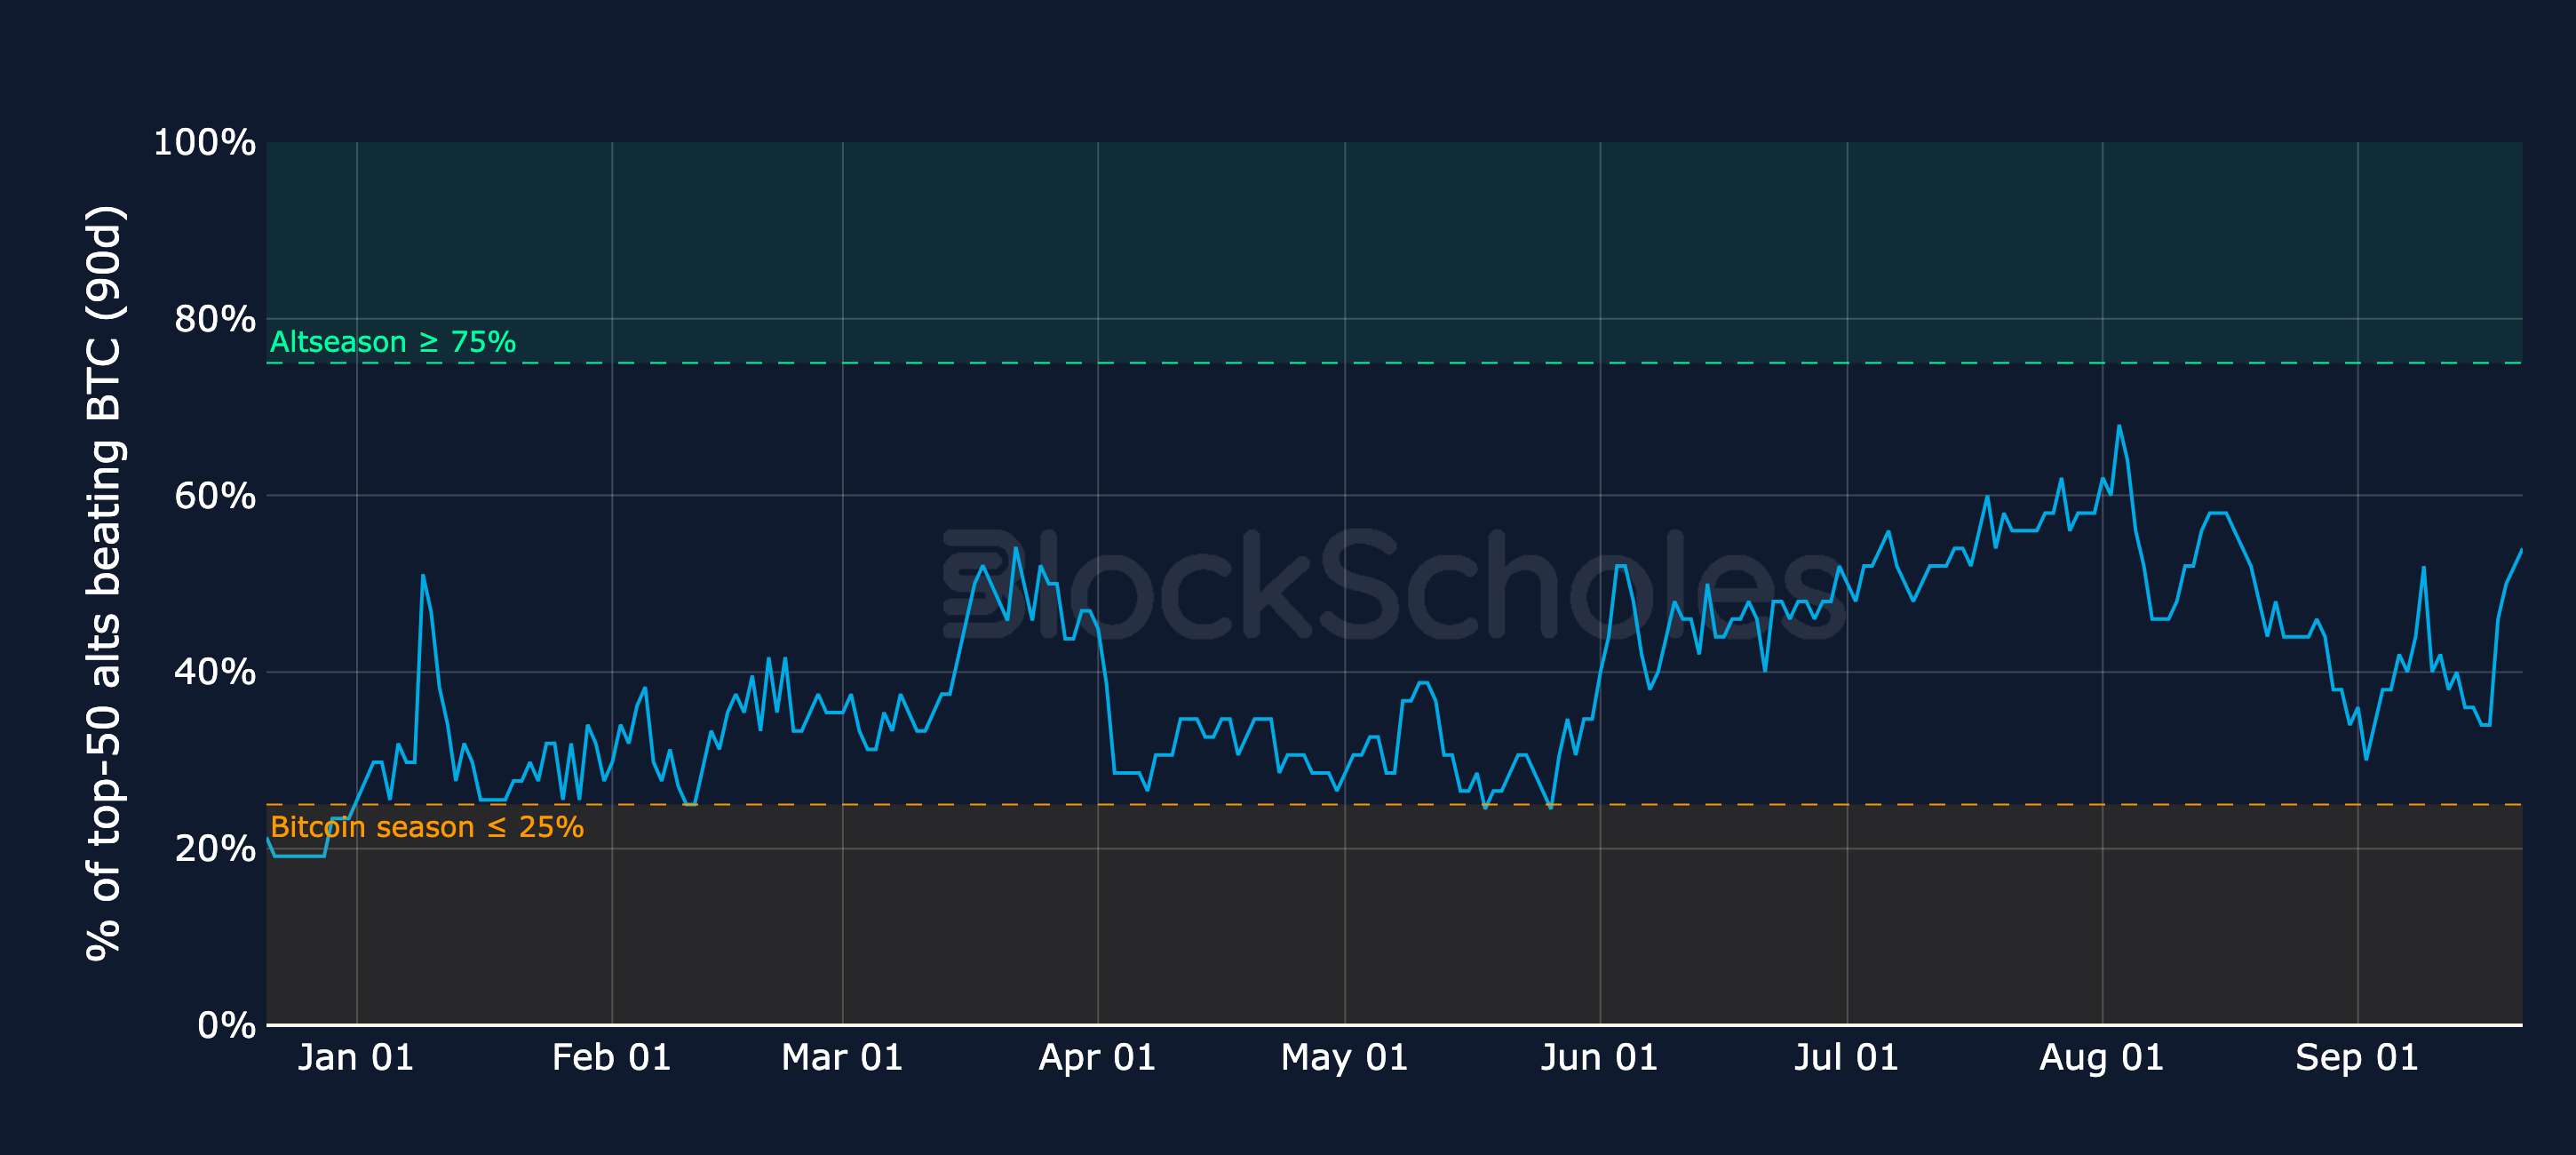
Figure 2. Market capitalisation of altcoins, excluding BTC and stablecoins, as a share of the total crypto market capitalisation. Source: CoinGecko, Block Scholes.

Altcoin Season Gauge (90-day lookback)

Figure 3. Share of the top-50 altcoins (current constituents) whose trailing 90-day return beats BTC's; slow-moving by construction. Source: CoinGecko, Block Scholes.
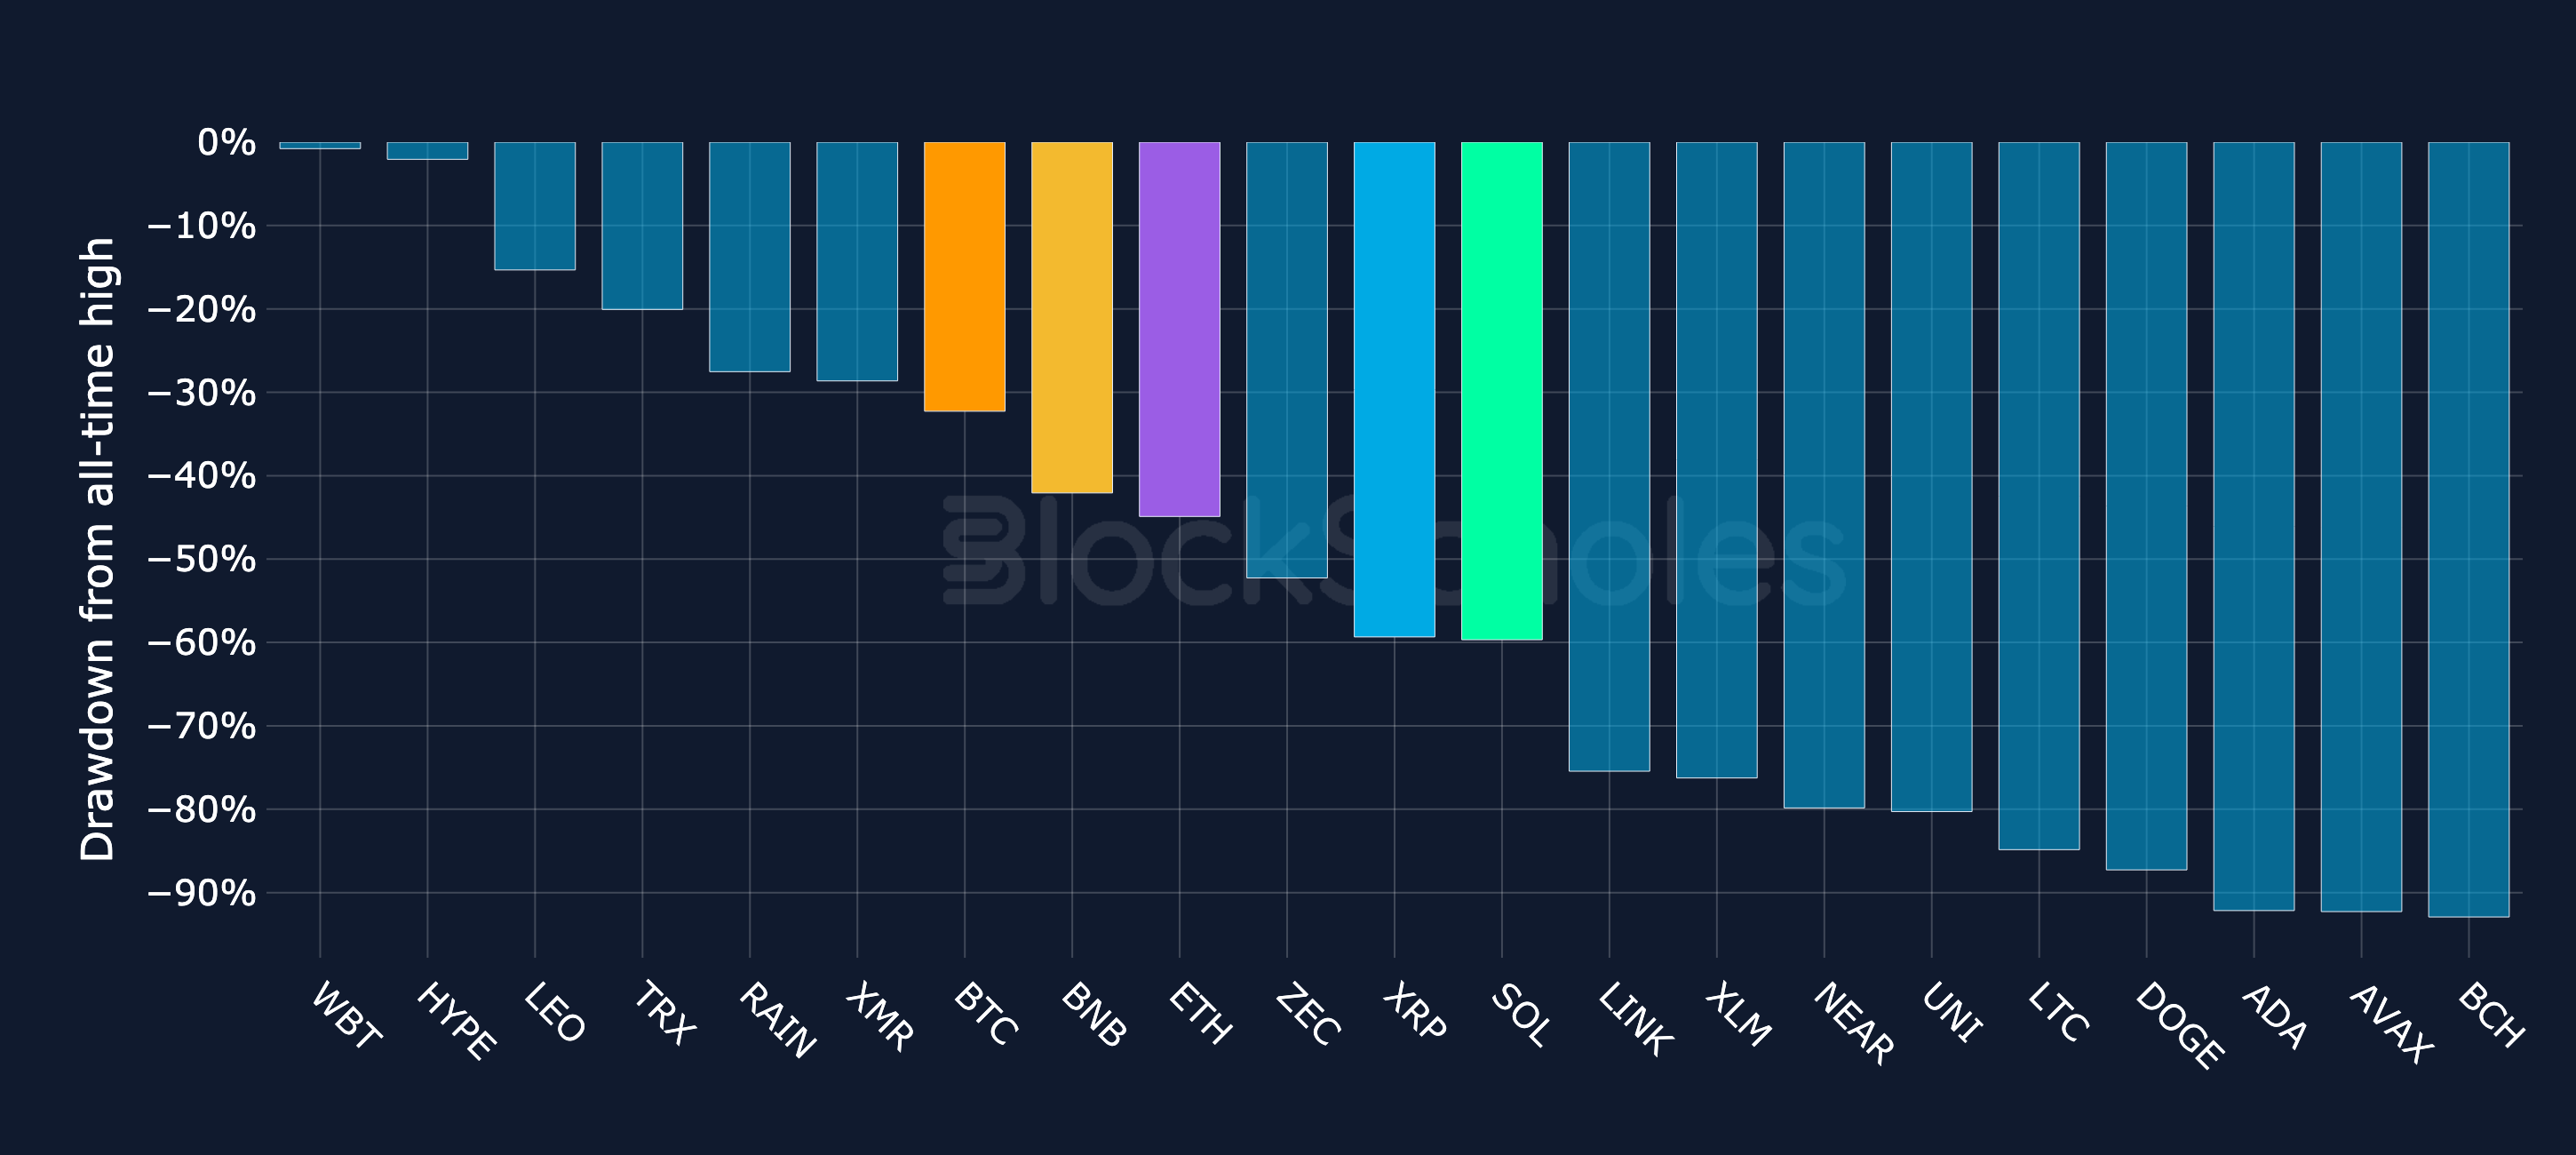
Figure 3. Share of the top-50 altcoins (current constituents) whose trailing 90-day return beats BTC's; slow-moving by construction. Source: CoinGecko, Block Scholes.

Drawdown from all-time high: BTC + top-20 altcoins by market cap

Figure 4. Percentage drawdown from each asset's all-time high for BTC and the top-20 altcoins by market cap. Source: CoinGecko, Block Scholes.
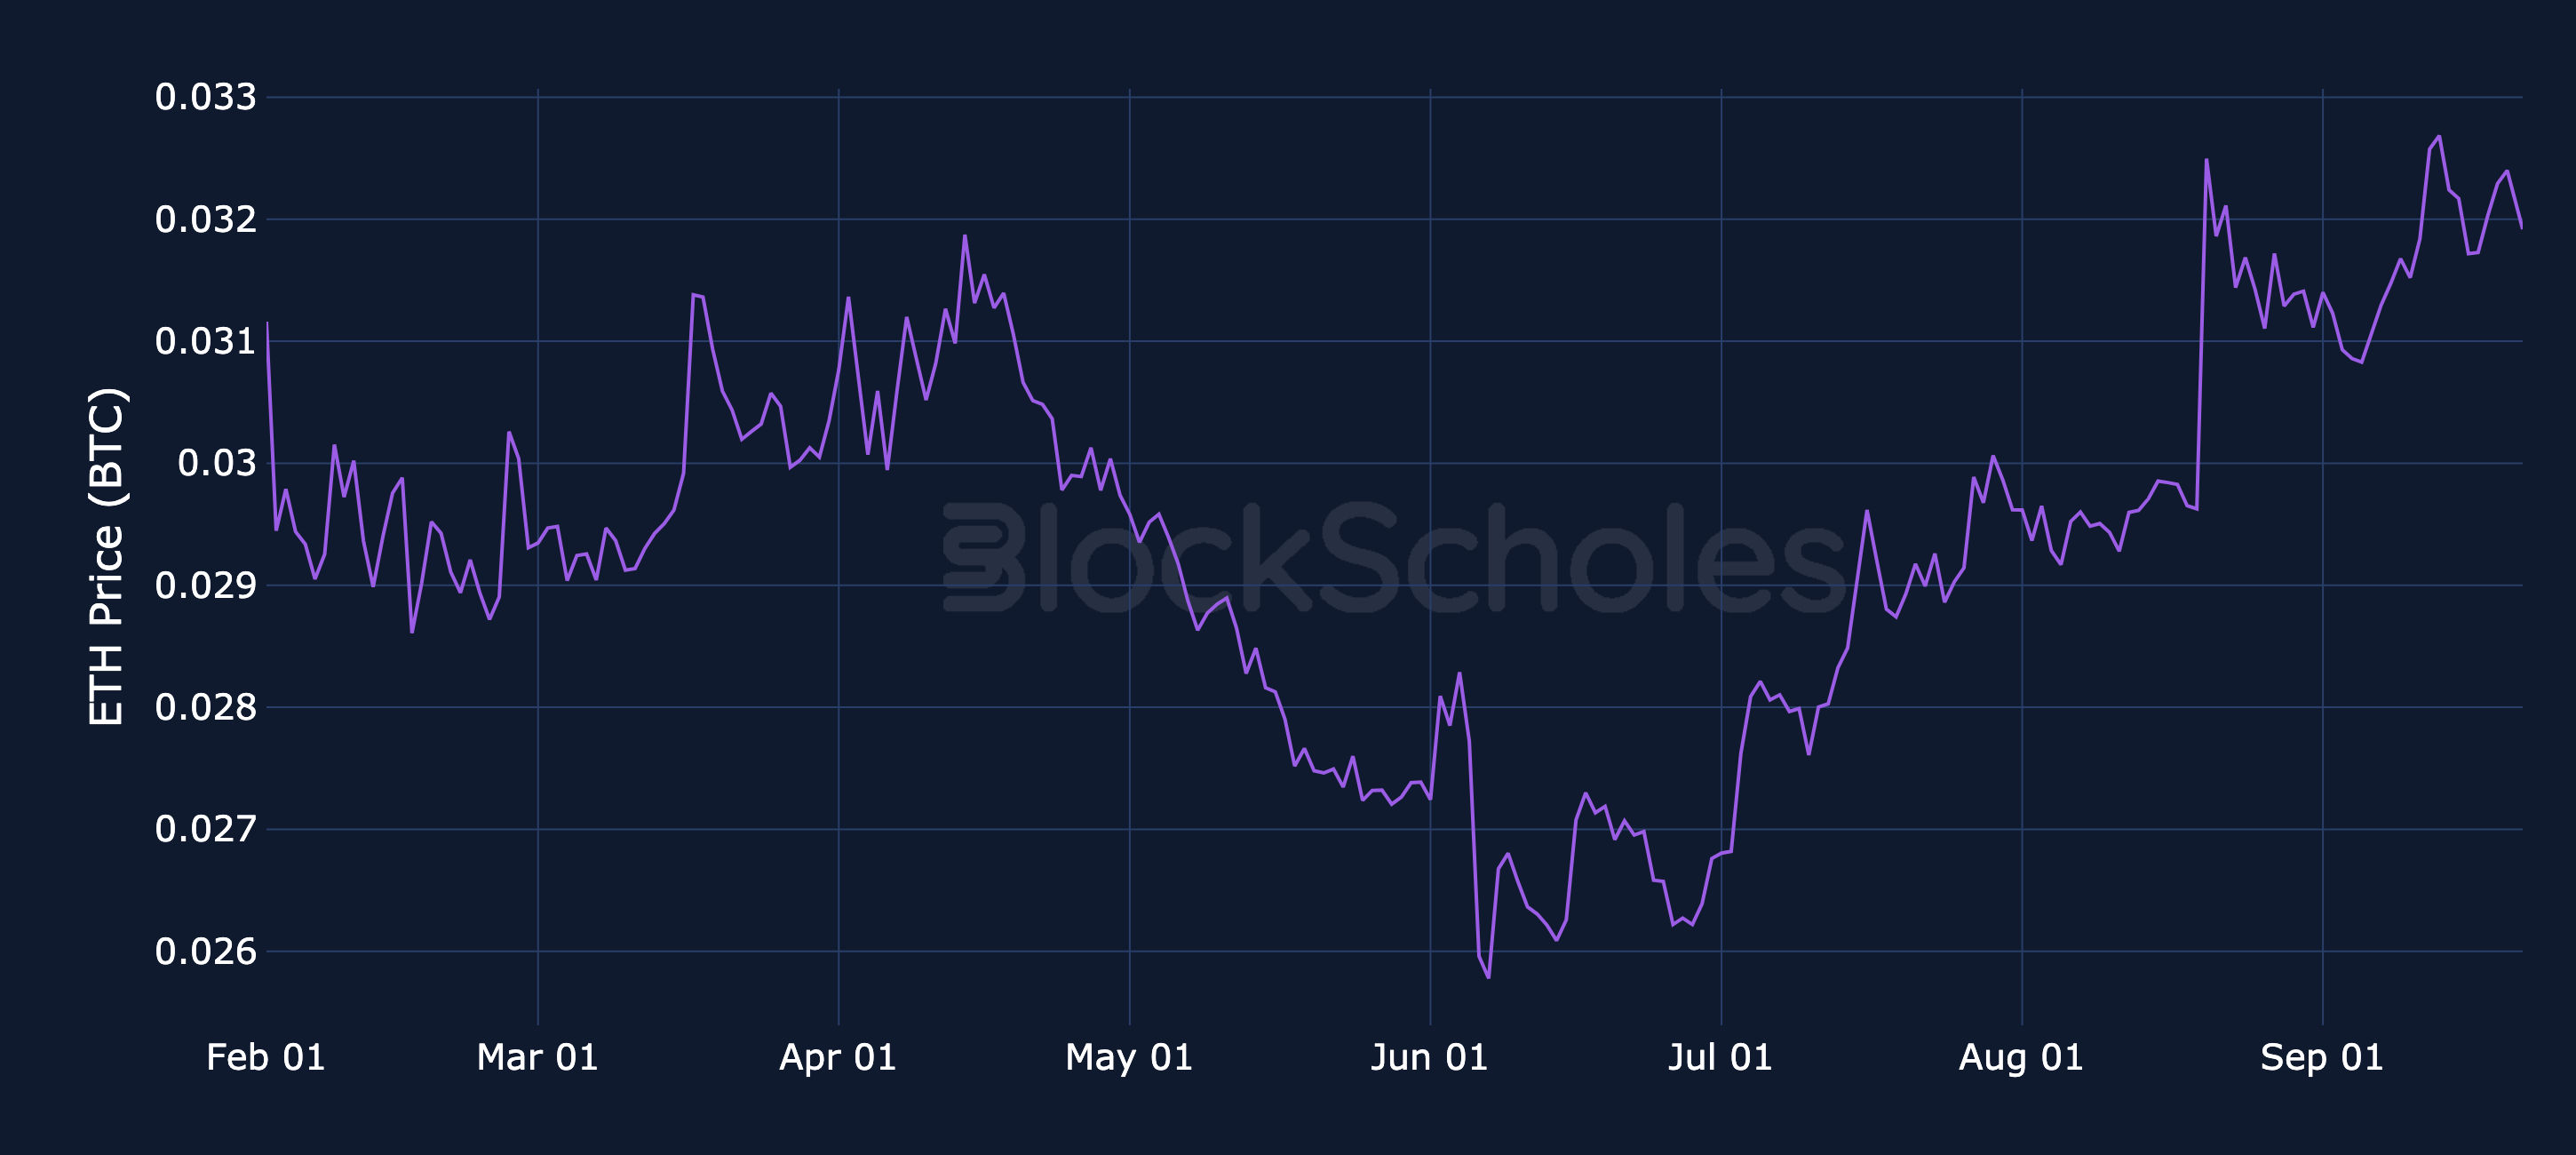
Figure 4. Percentage drawdown from each asset's all-time high for BTC and the top-20 altcoins by market cap. Source: CoinGecko, Block Scholes.

Altcoins / BTC Spot Crosses

Altcoin spot prices denominated in BTC: ETH

Figure 5. ETH spot price denominated in BTC (the ETH/BTC cross). Source: CoinGecko, Block Scholes.
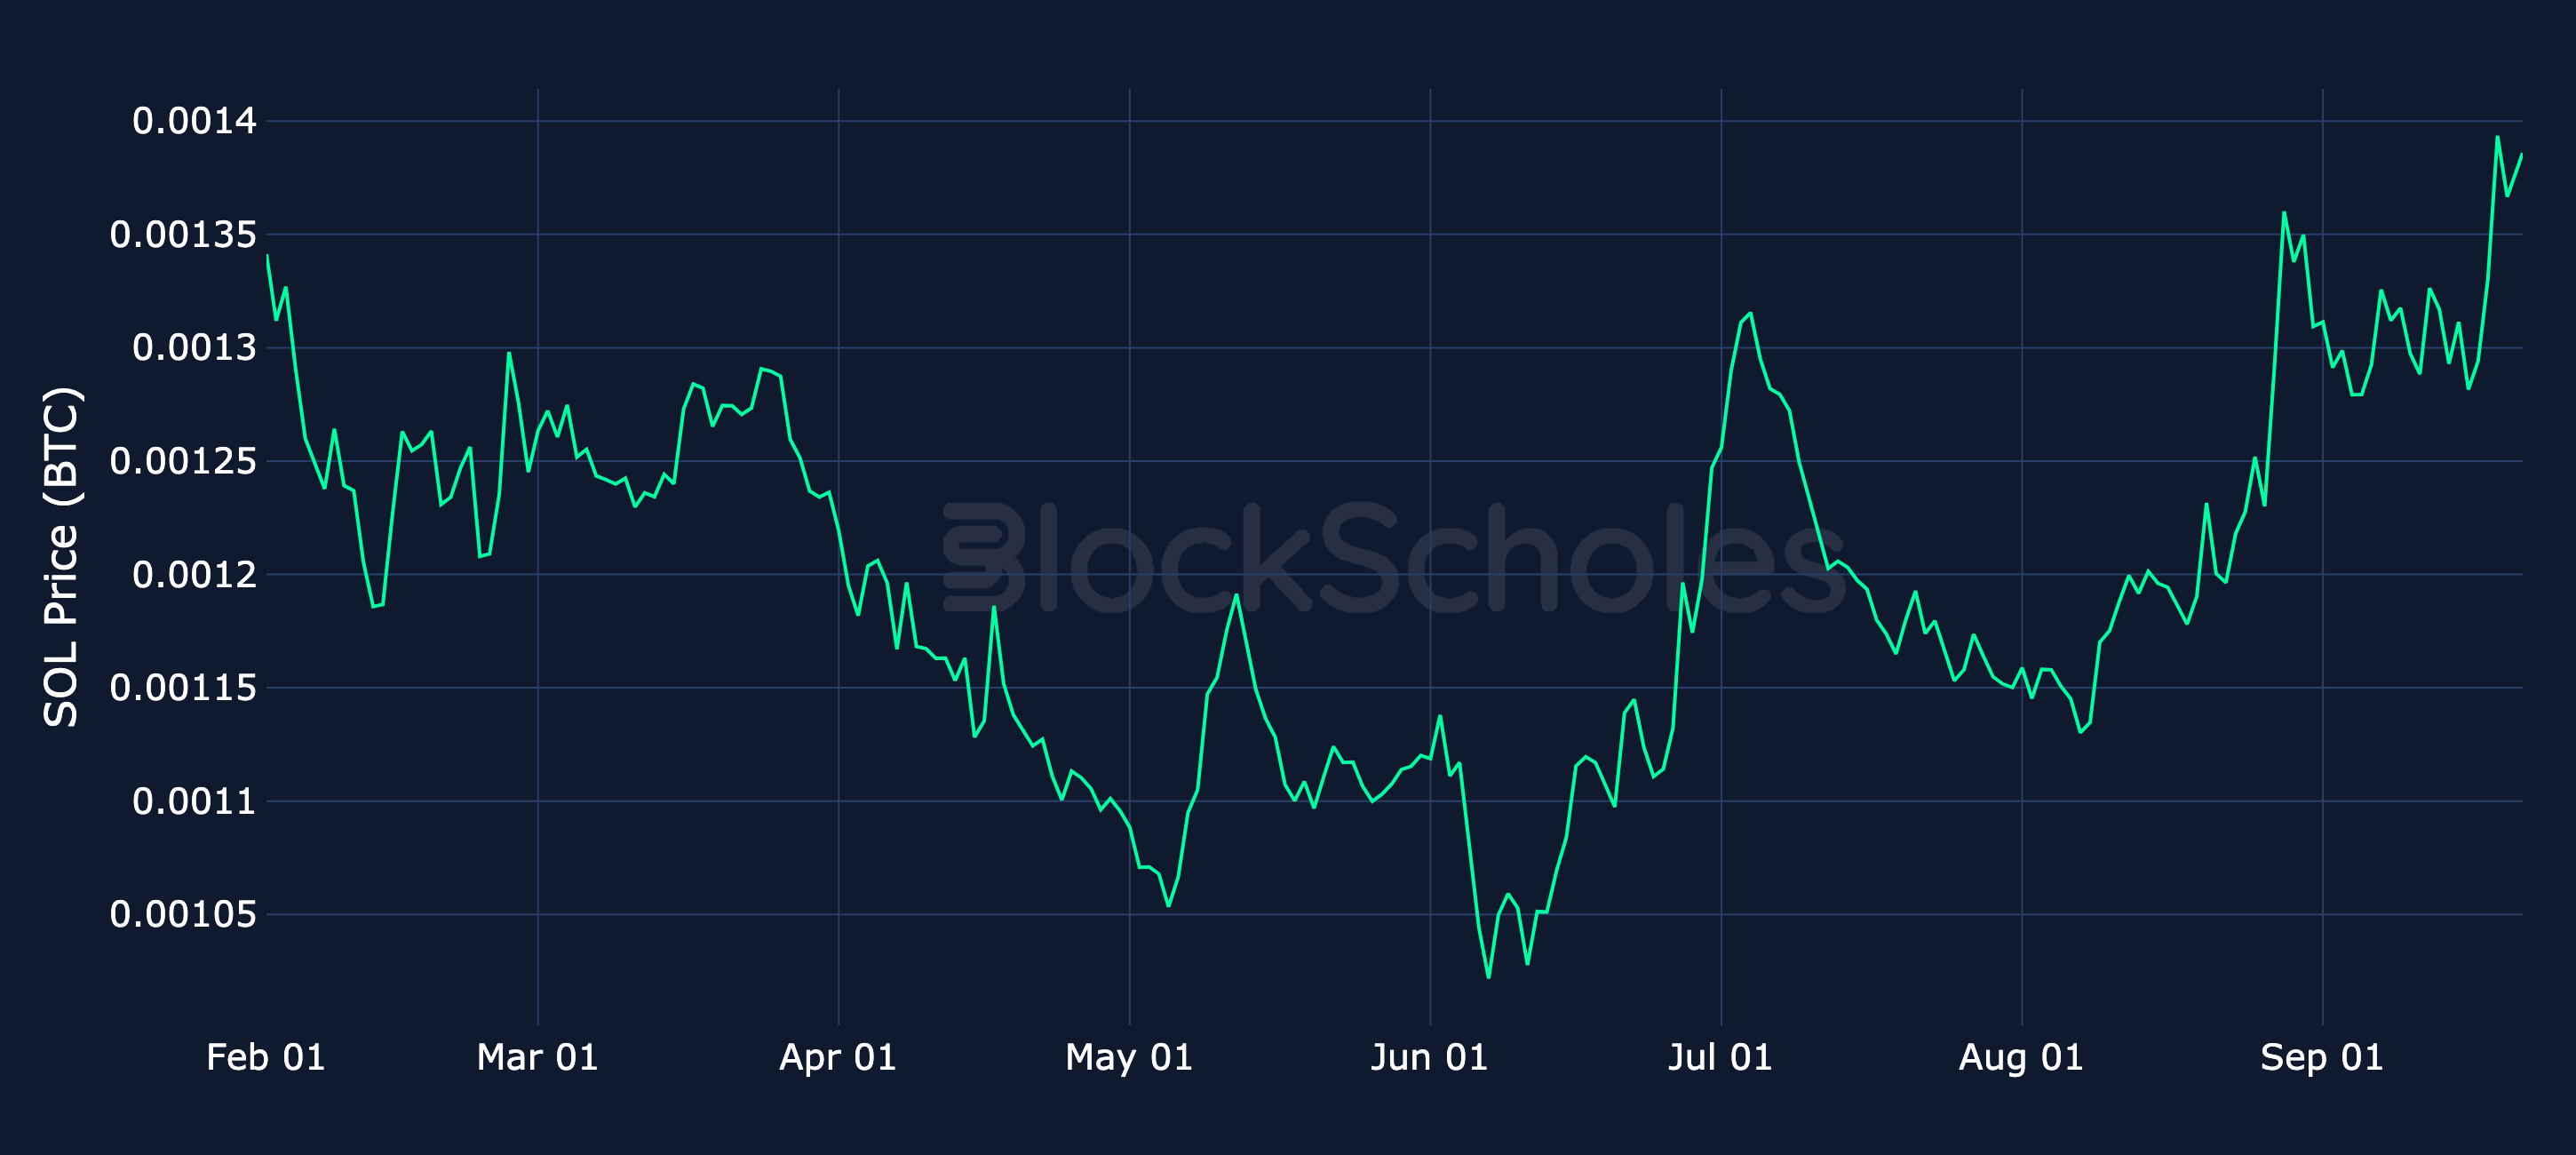
Figure 5. ETH spot price denominated in BTC (the ETH/BTC cross). Source: CoinGecko, Block Scholes.

Altcoin spot prices denominated in BTC: SOL

Figure 6. SOL spot price denominated in BTC (the SOL/BTC cross). Source: CoinGecko, Block Scholes.
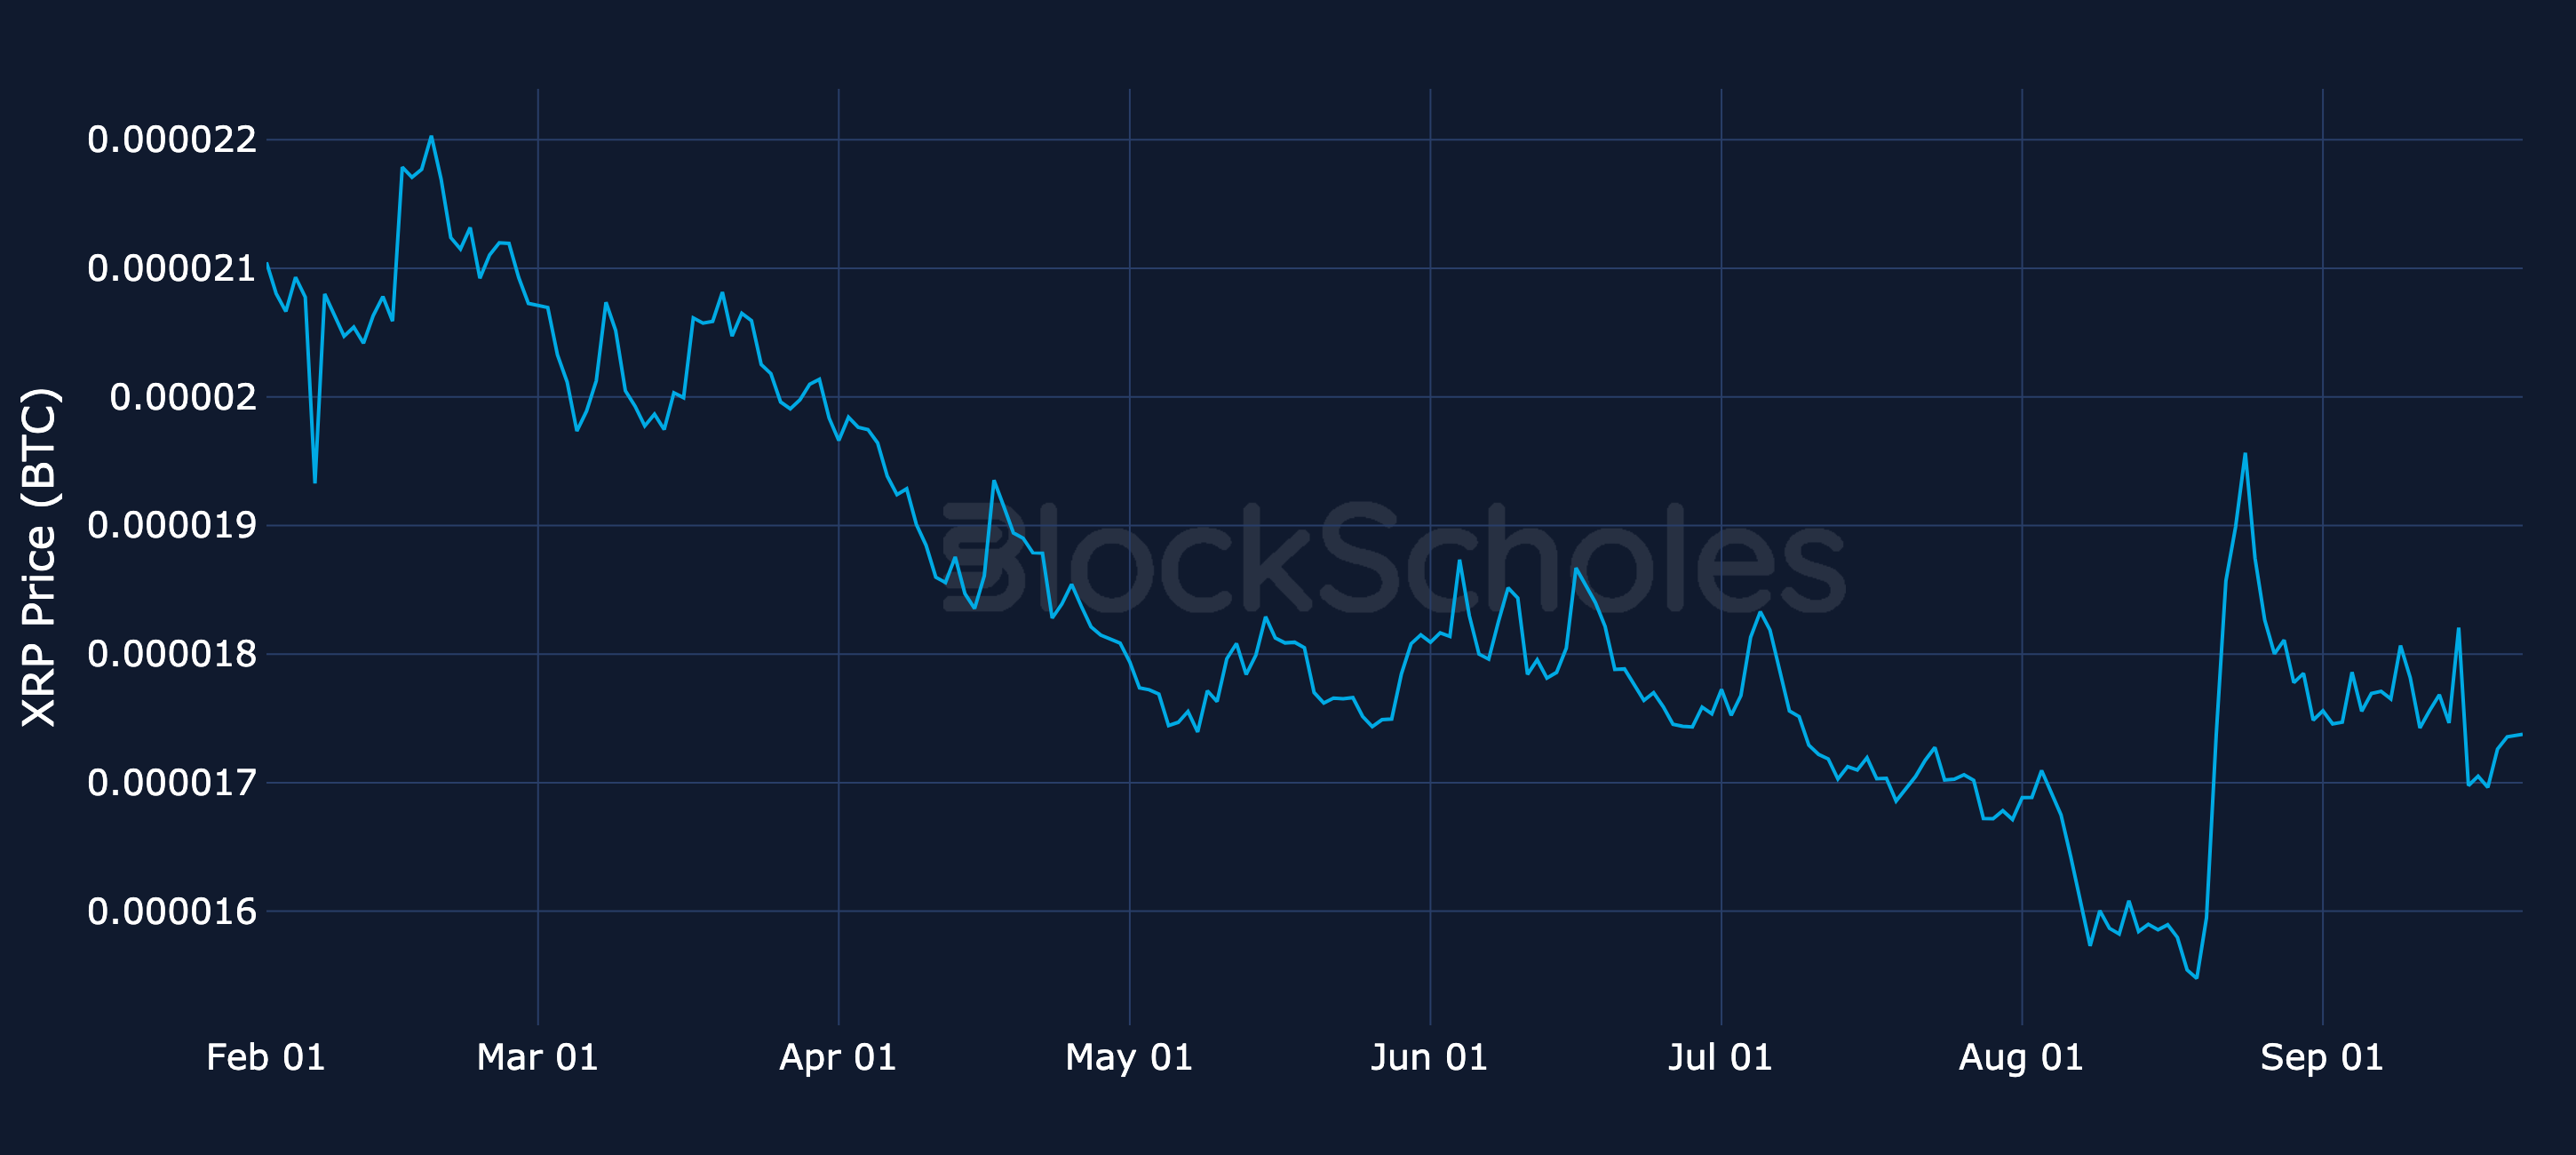
Figure 6. SOL spot price denominated in BTC (the SOL/BTC cross). Source: CoinGecko, Block Scholes.

Altcoin spot prices denominated in BTC: XRP

Figure 7. XRP spot price denominated in BTC (the XRP/BTC cross). Source: CoinGecko, Block Scholes.
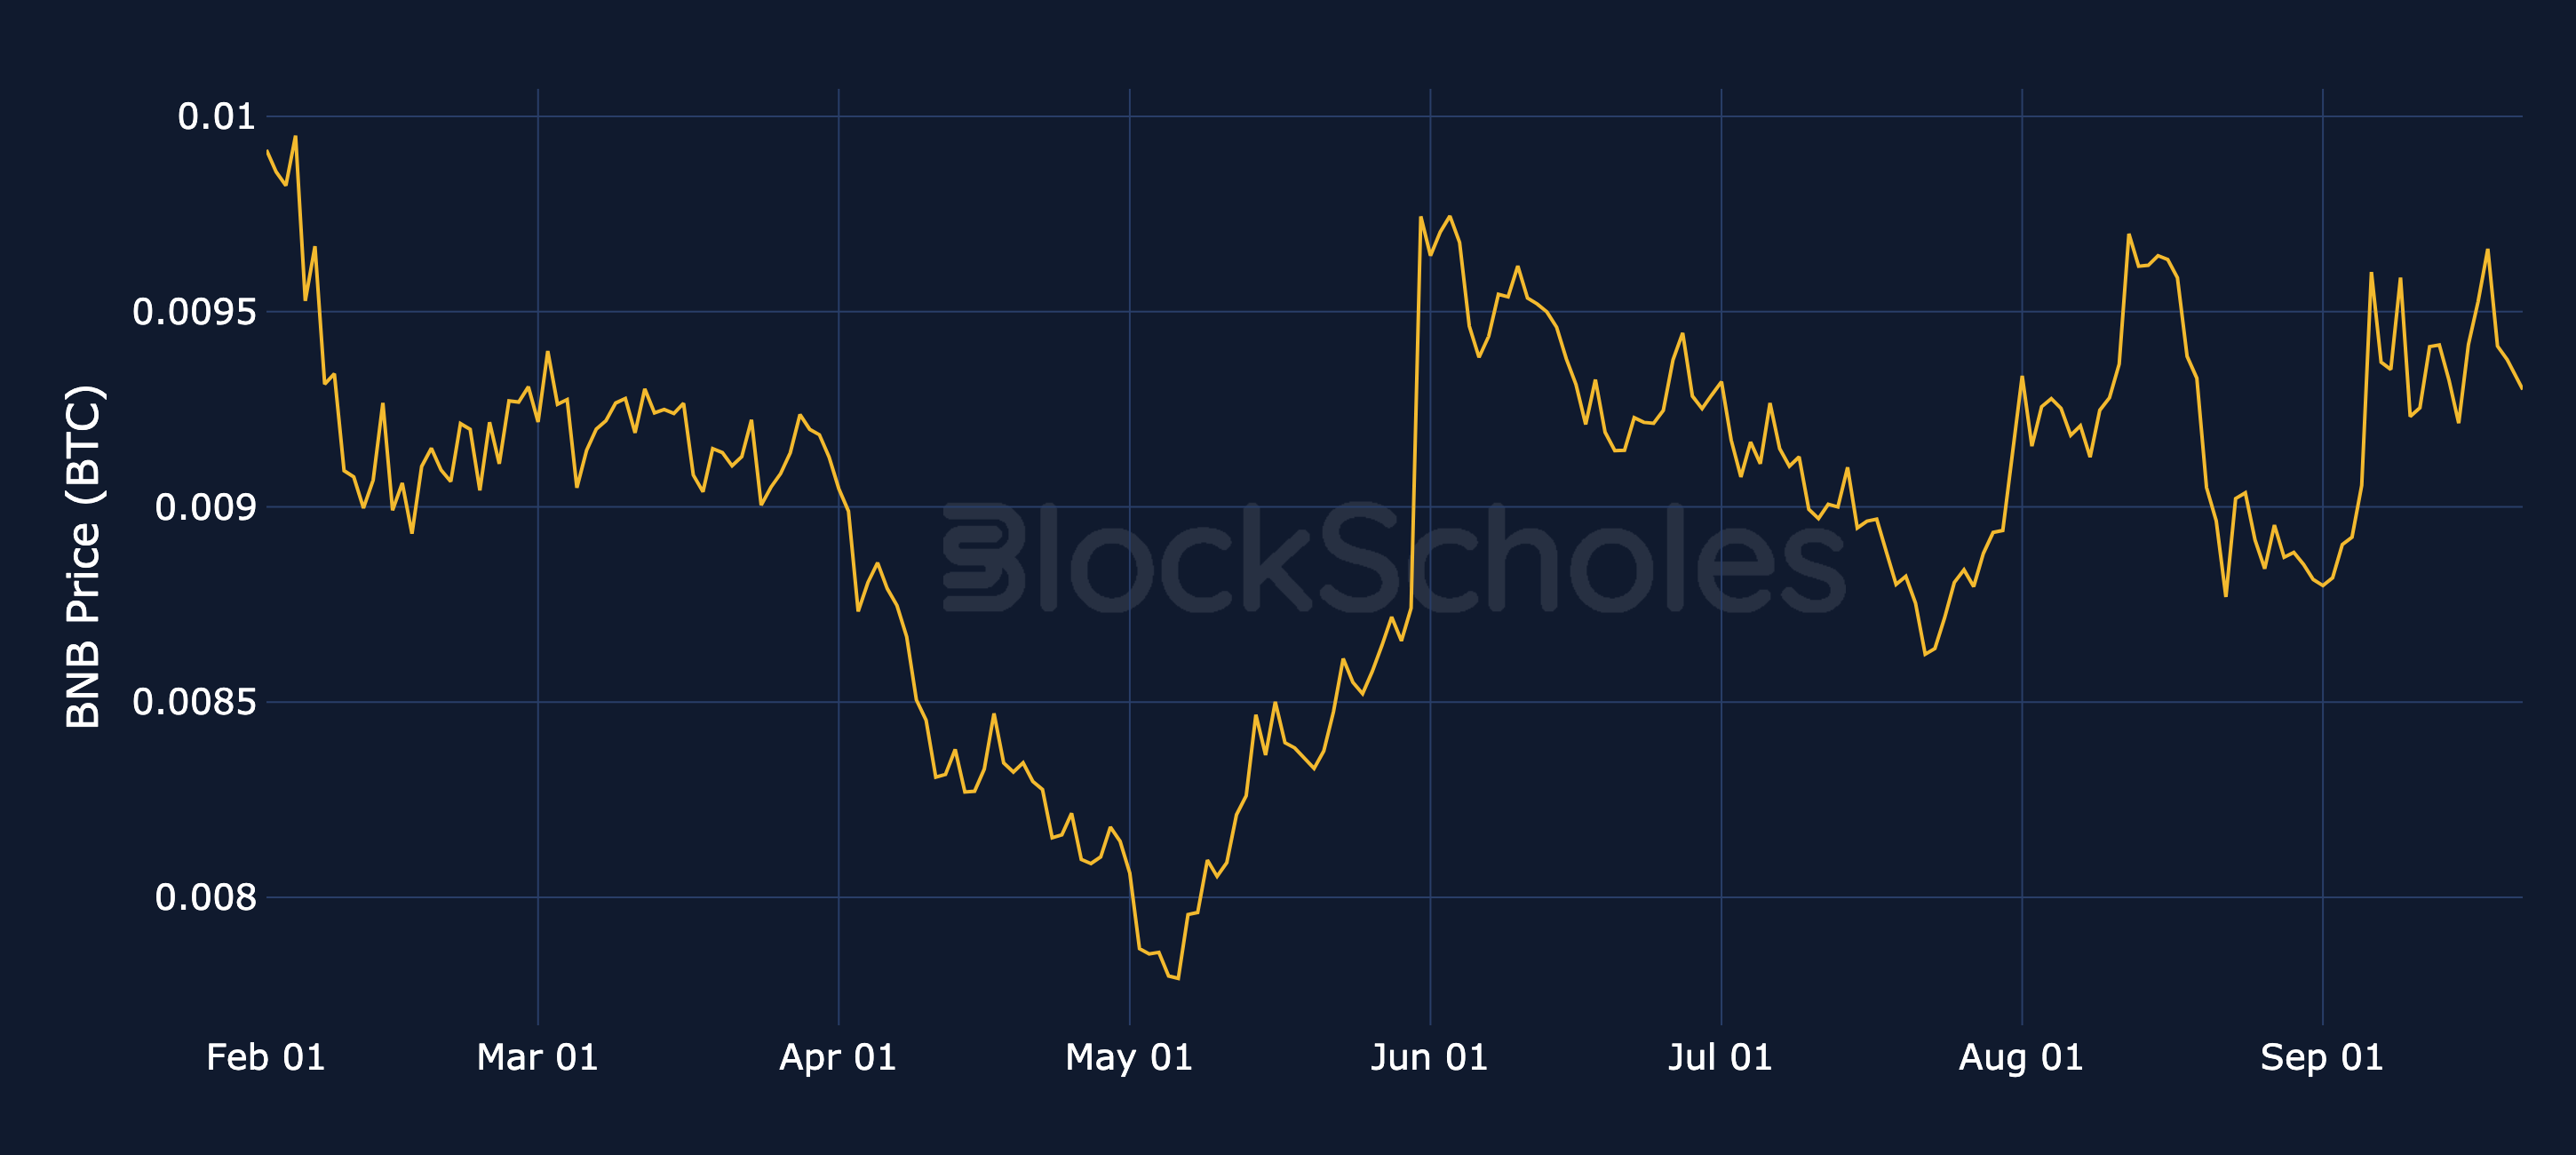
Figure 7. XRP spot price denominated in BTC (the XRP/BTC cross). Source: CoinGecko, Block Scholes.

Altcoin spot prices denominated in BTC: BNB

Figure 8. BNB spot price denominated in BTC (the BNB/BTC cross). Source: CoinGecko, Block Scholes.
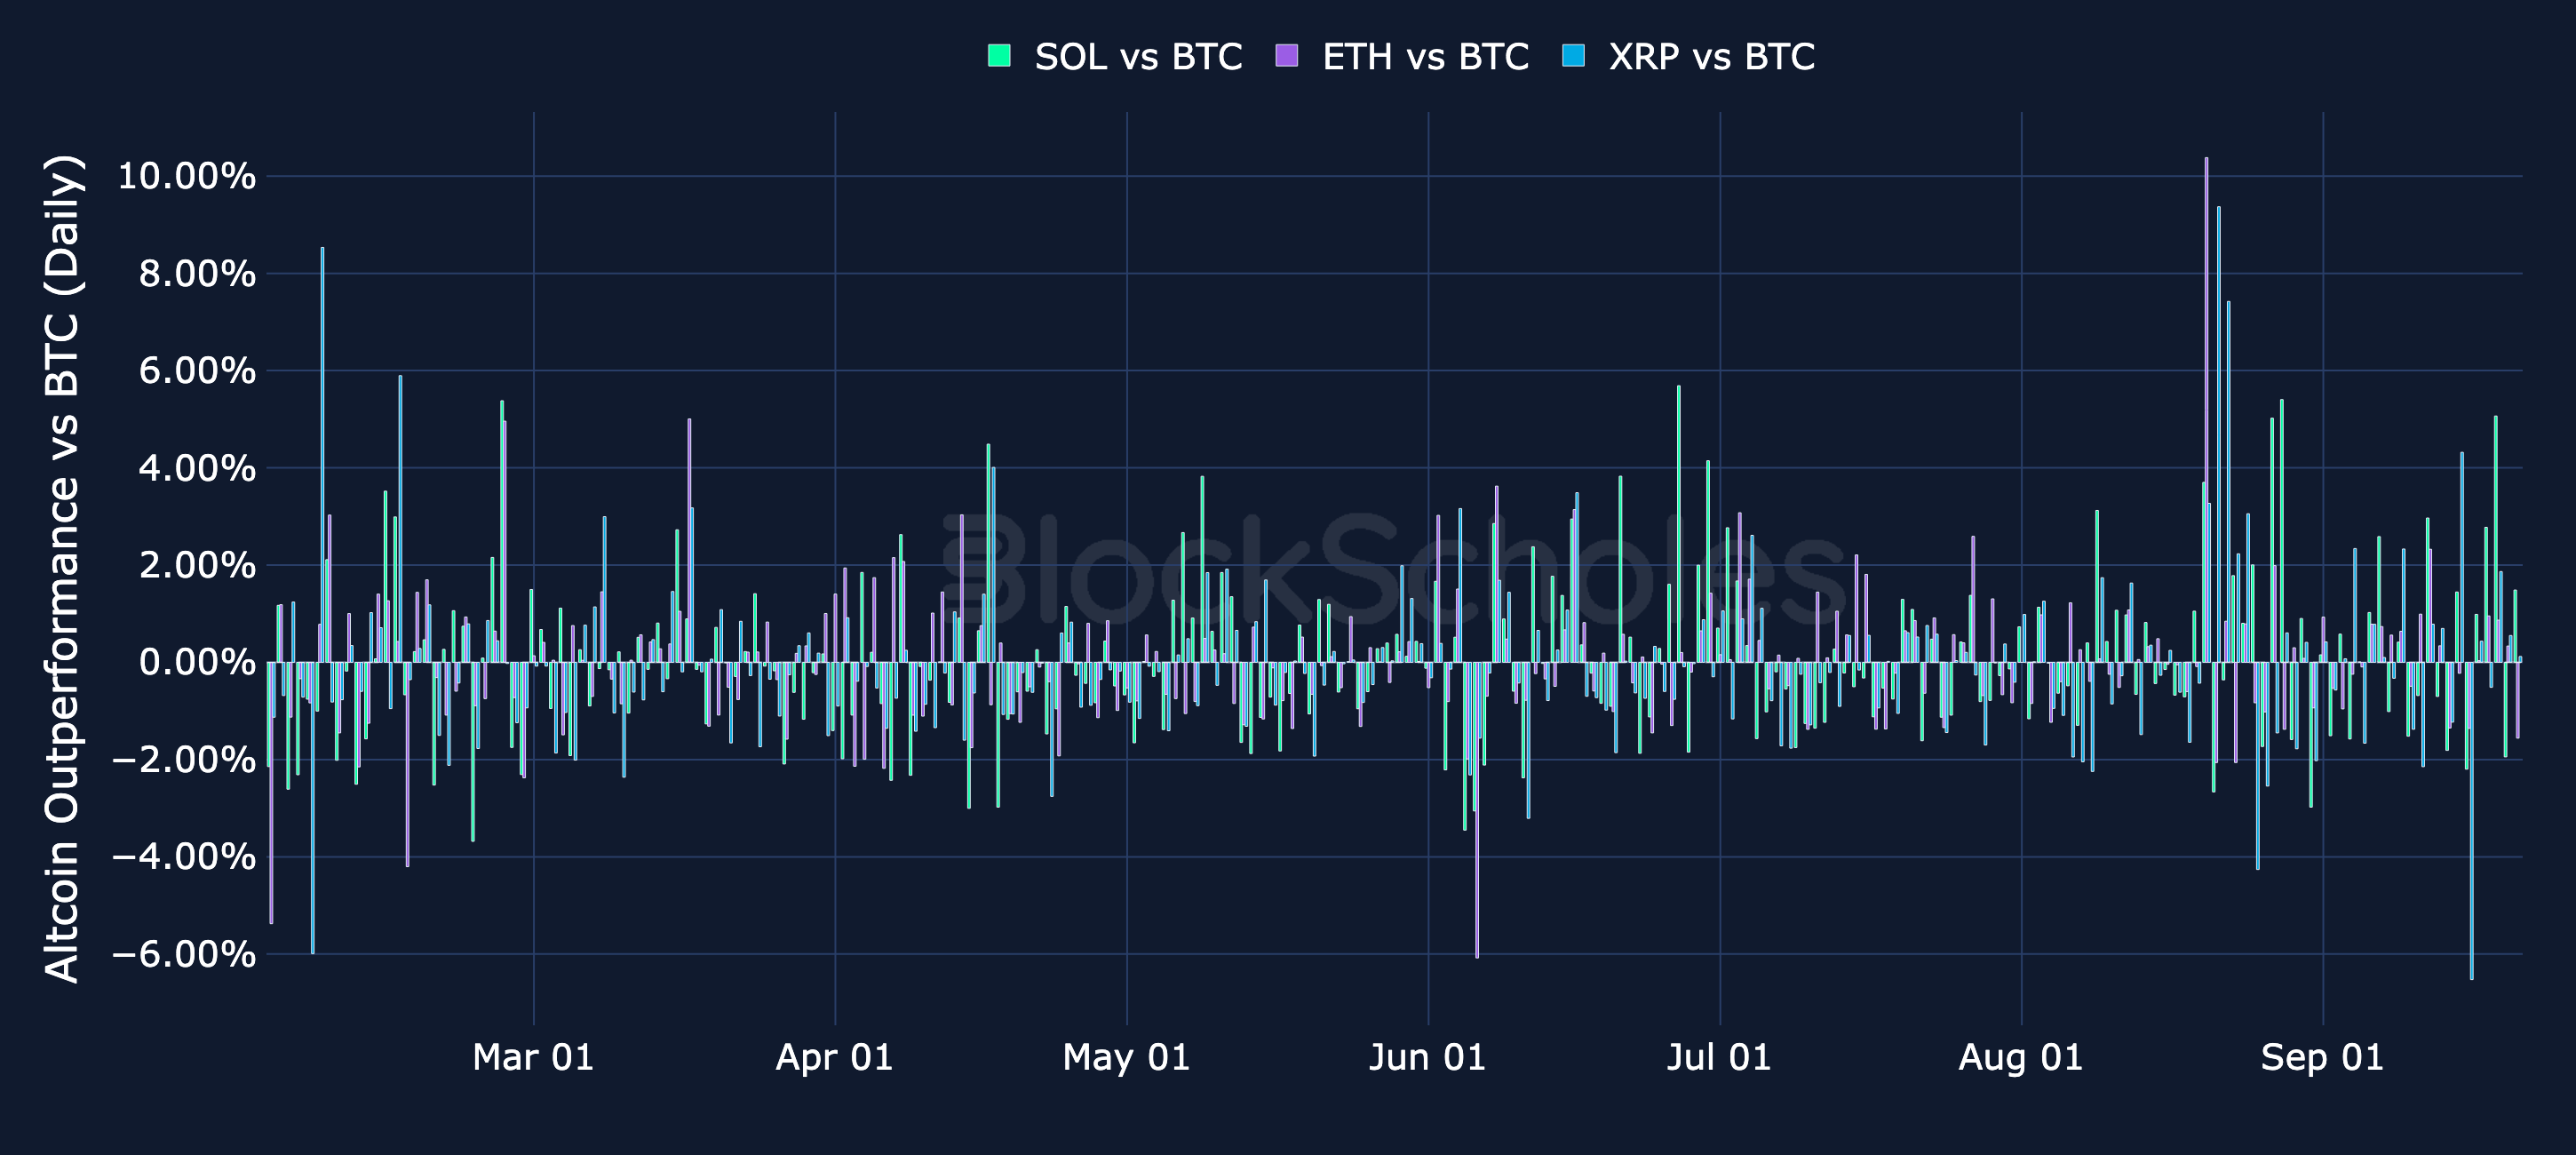
Figure 8. BNB spot price denominated in BTC (the BNB/BTC cross). Source: CoinGecko, Block Scholes.

Altcoins performance vs BTC

Daily relative simple returns vs BTC

Figure 9. Daily simple return of each tracked altcoin minus BTC's daily return. Source: CoinGecko, Block Scholes.
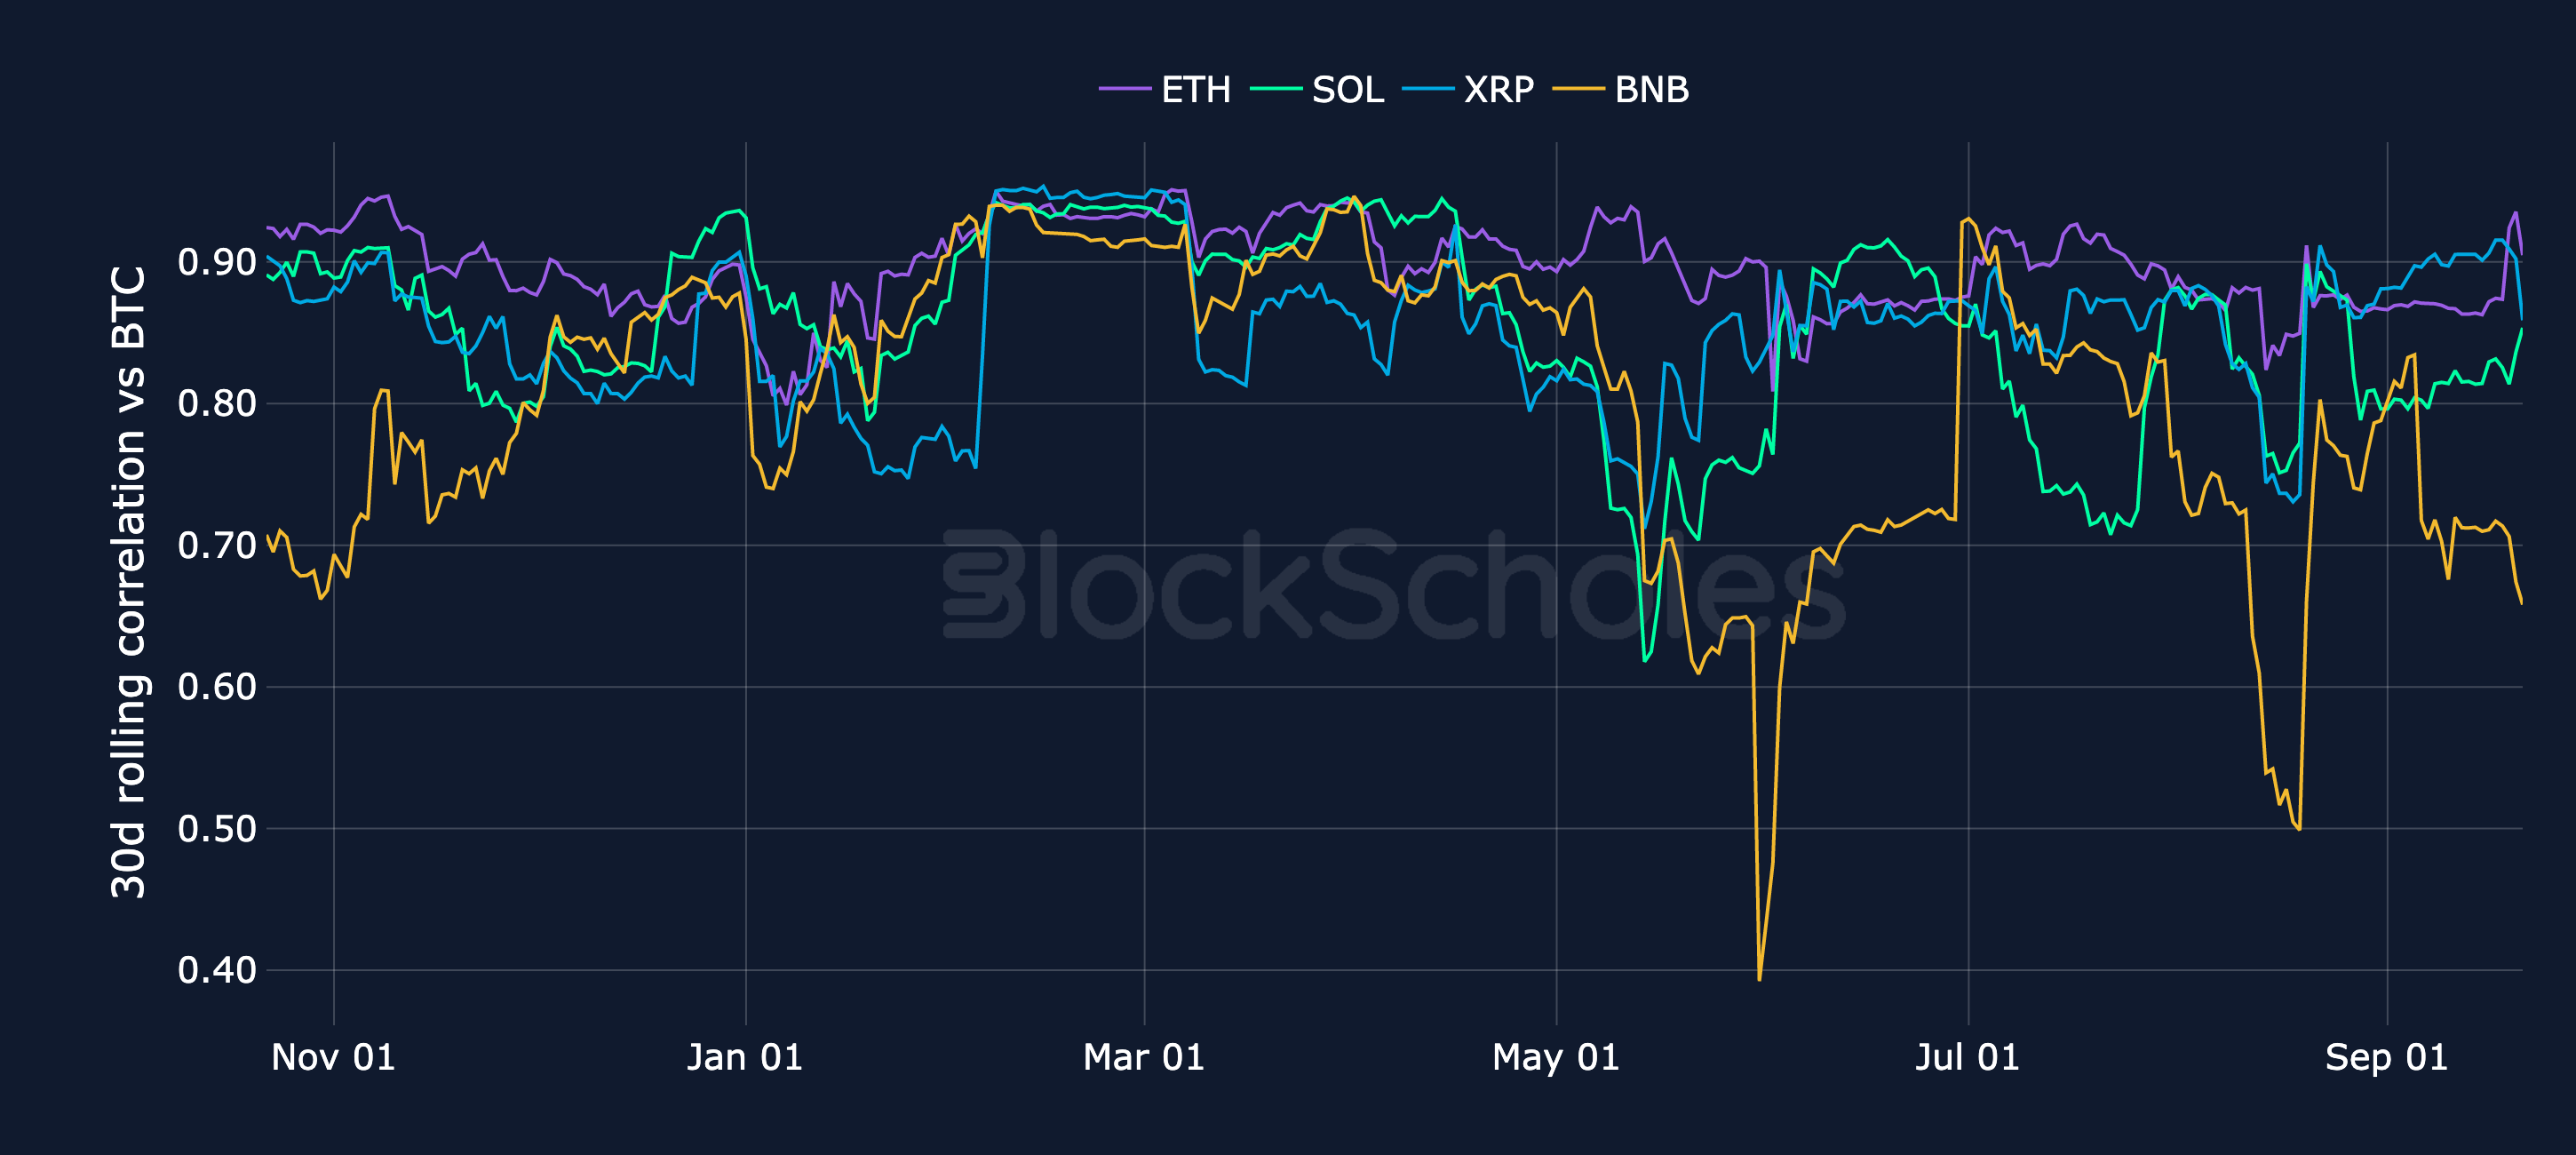
Figure 9. Daily simple return of each tracked altcoin minus BTC's daily return. Source: CoinGecko, Block Scholes.

Rolling 30-day correlation vs BTC

Figure 10. Rolling 30-day correlation of each altcoin's daily returns with BTC's. Source: CoinGecko, Block Scholes.
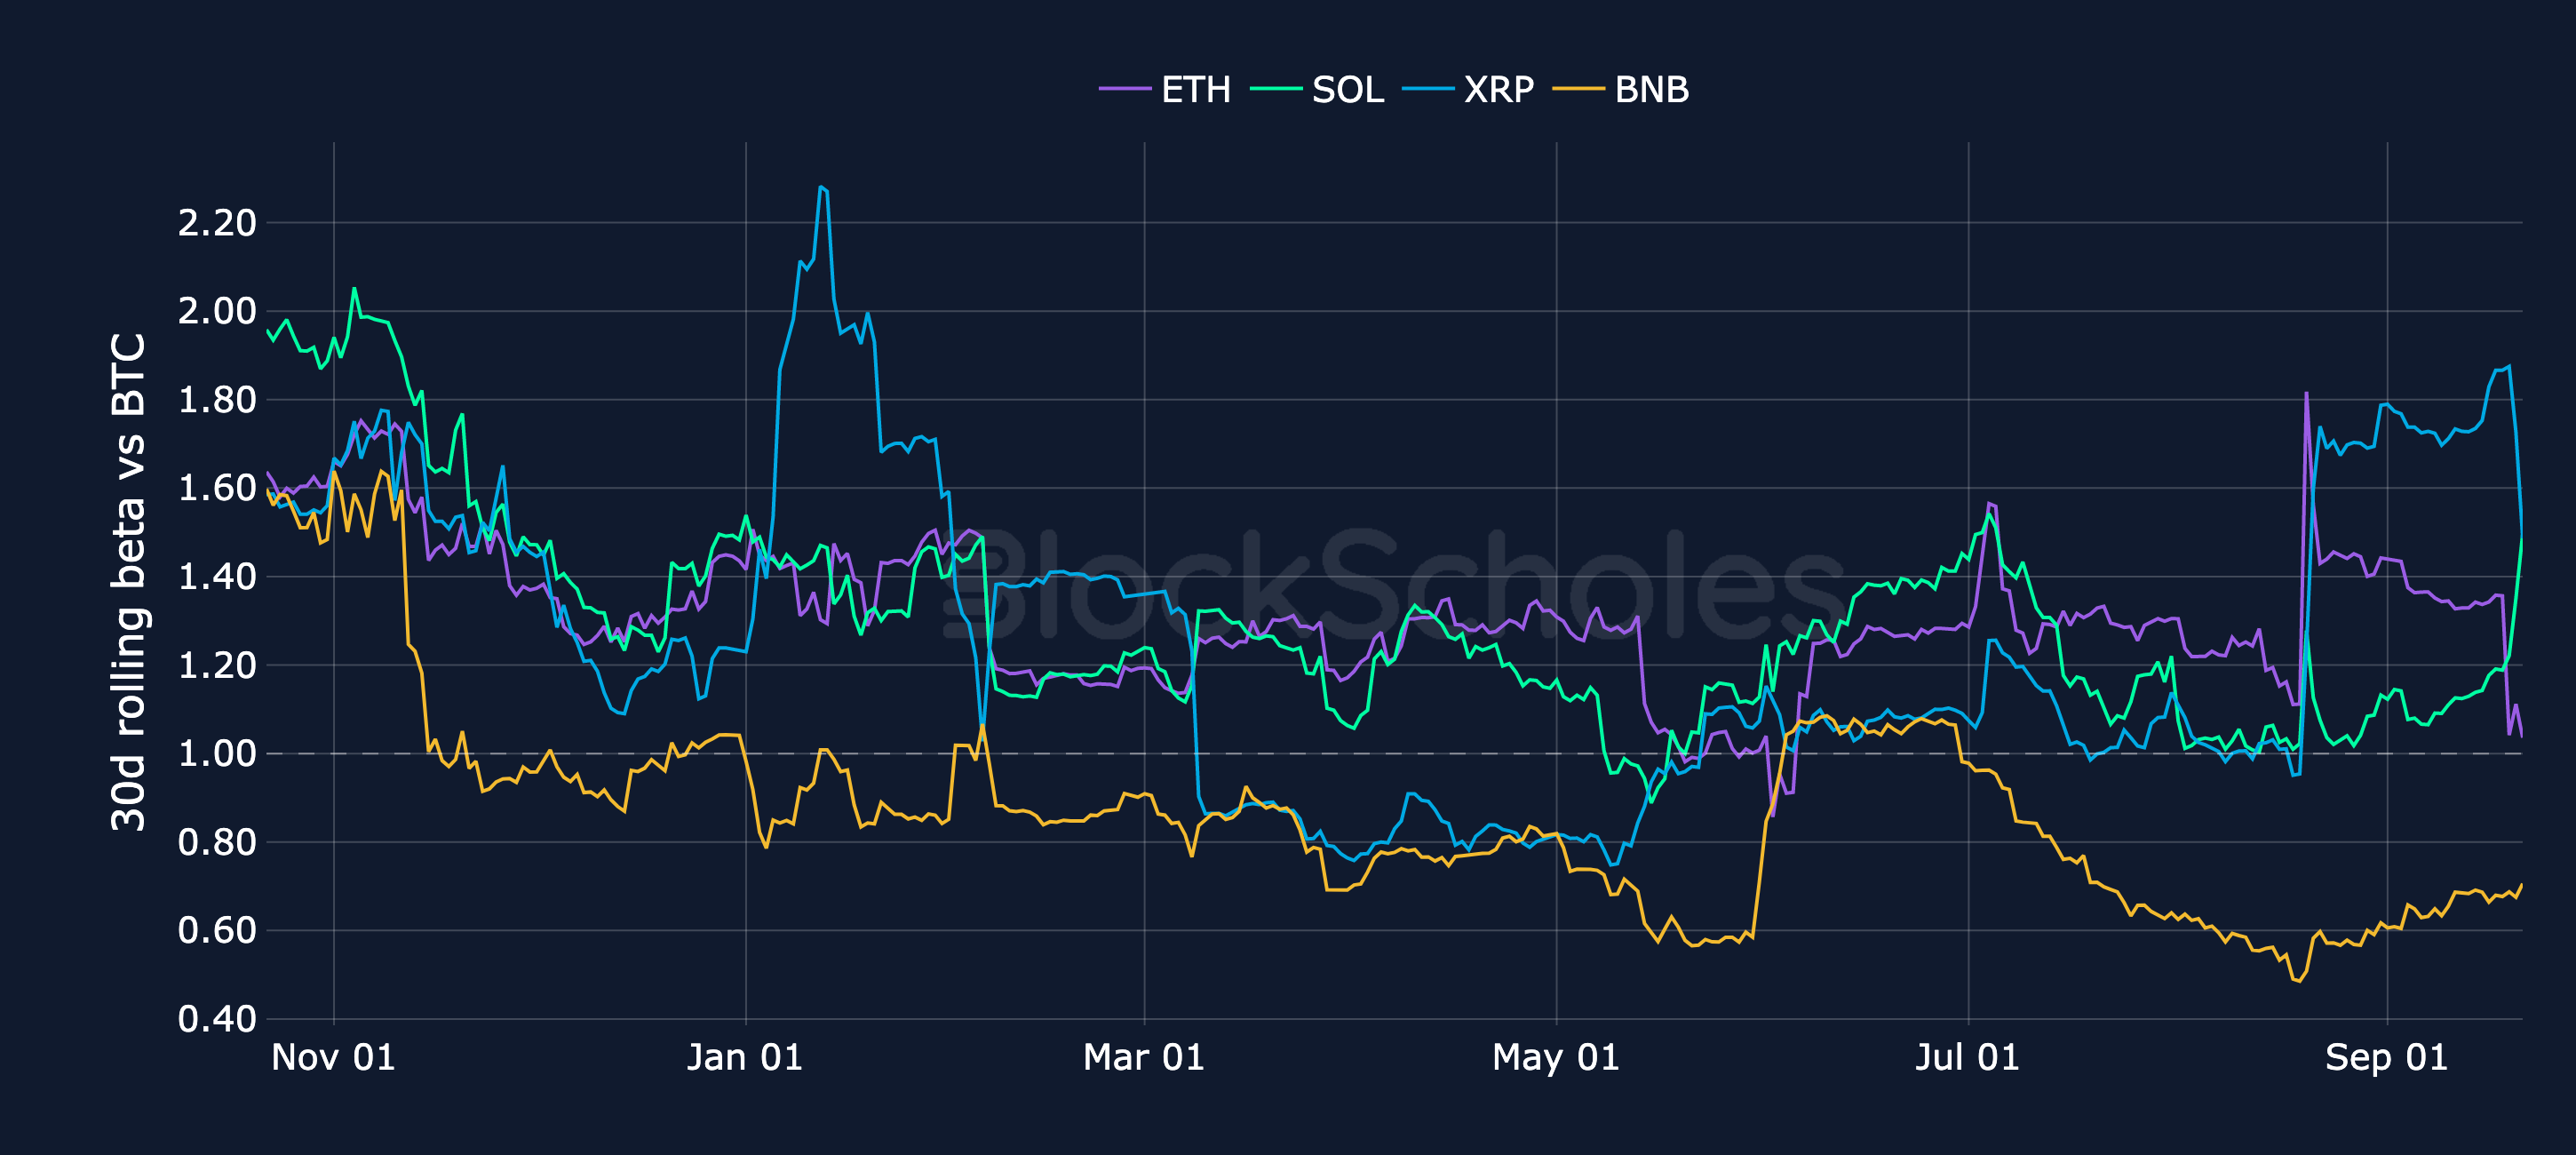
Figure 10. Rolling 30-day correlation of each altcoin's daily returns with BTC's. Source: CoinGecko, Block Scholes.

Rolling 30-day beta vs BTC

Figure 11. Rolling 30-day beta of each altcoin's daily returns to BTC's. Source: CoinGecko, Block Scholes.
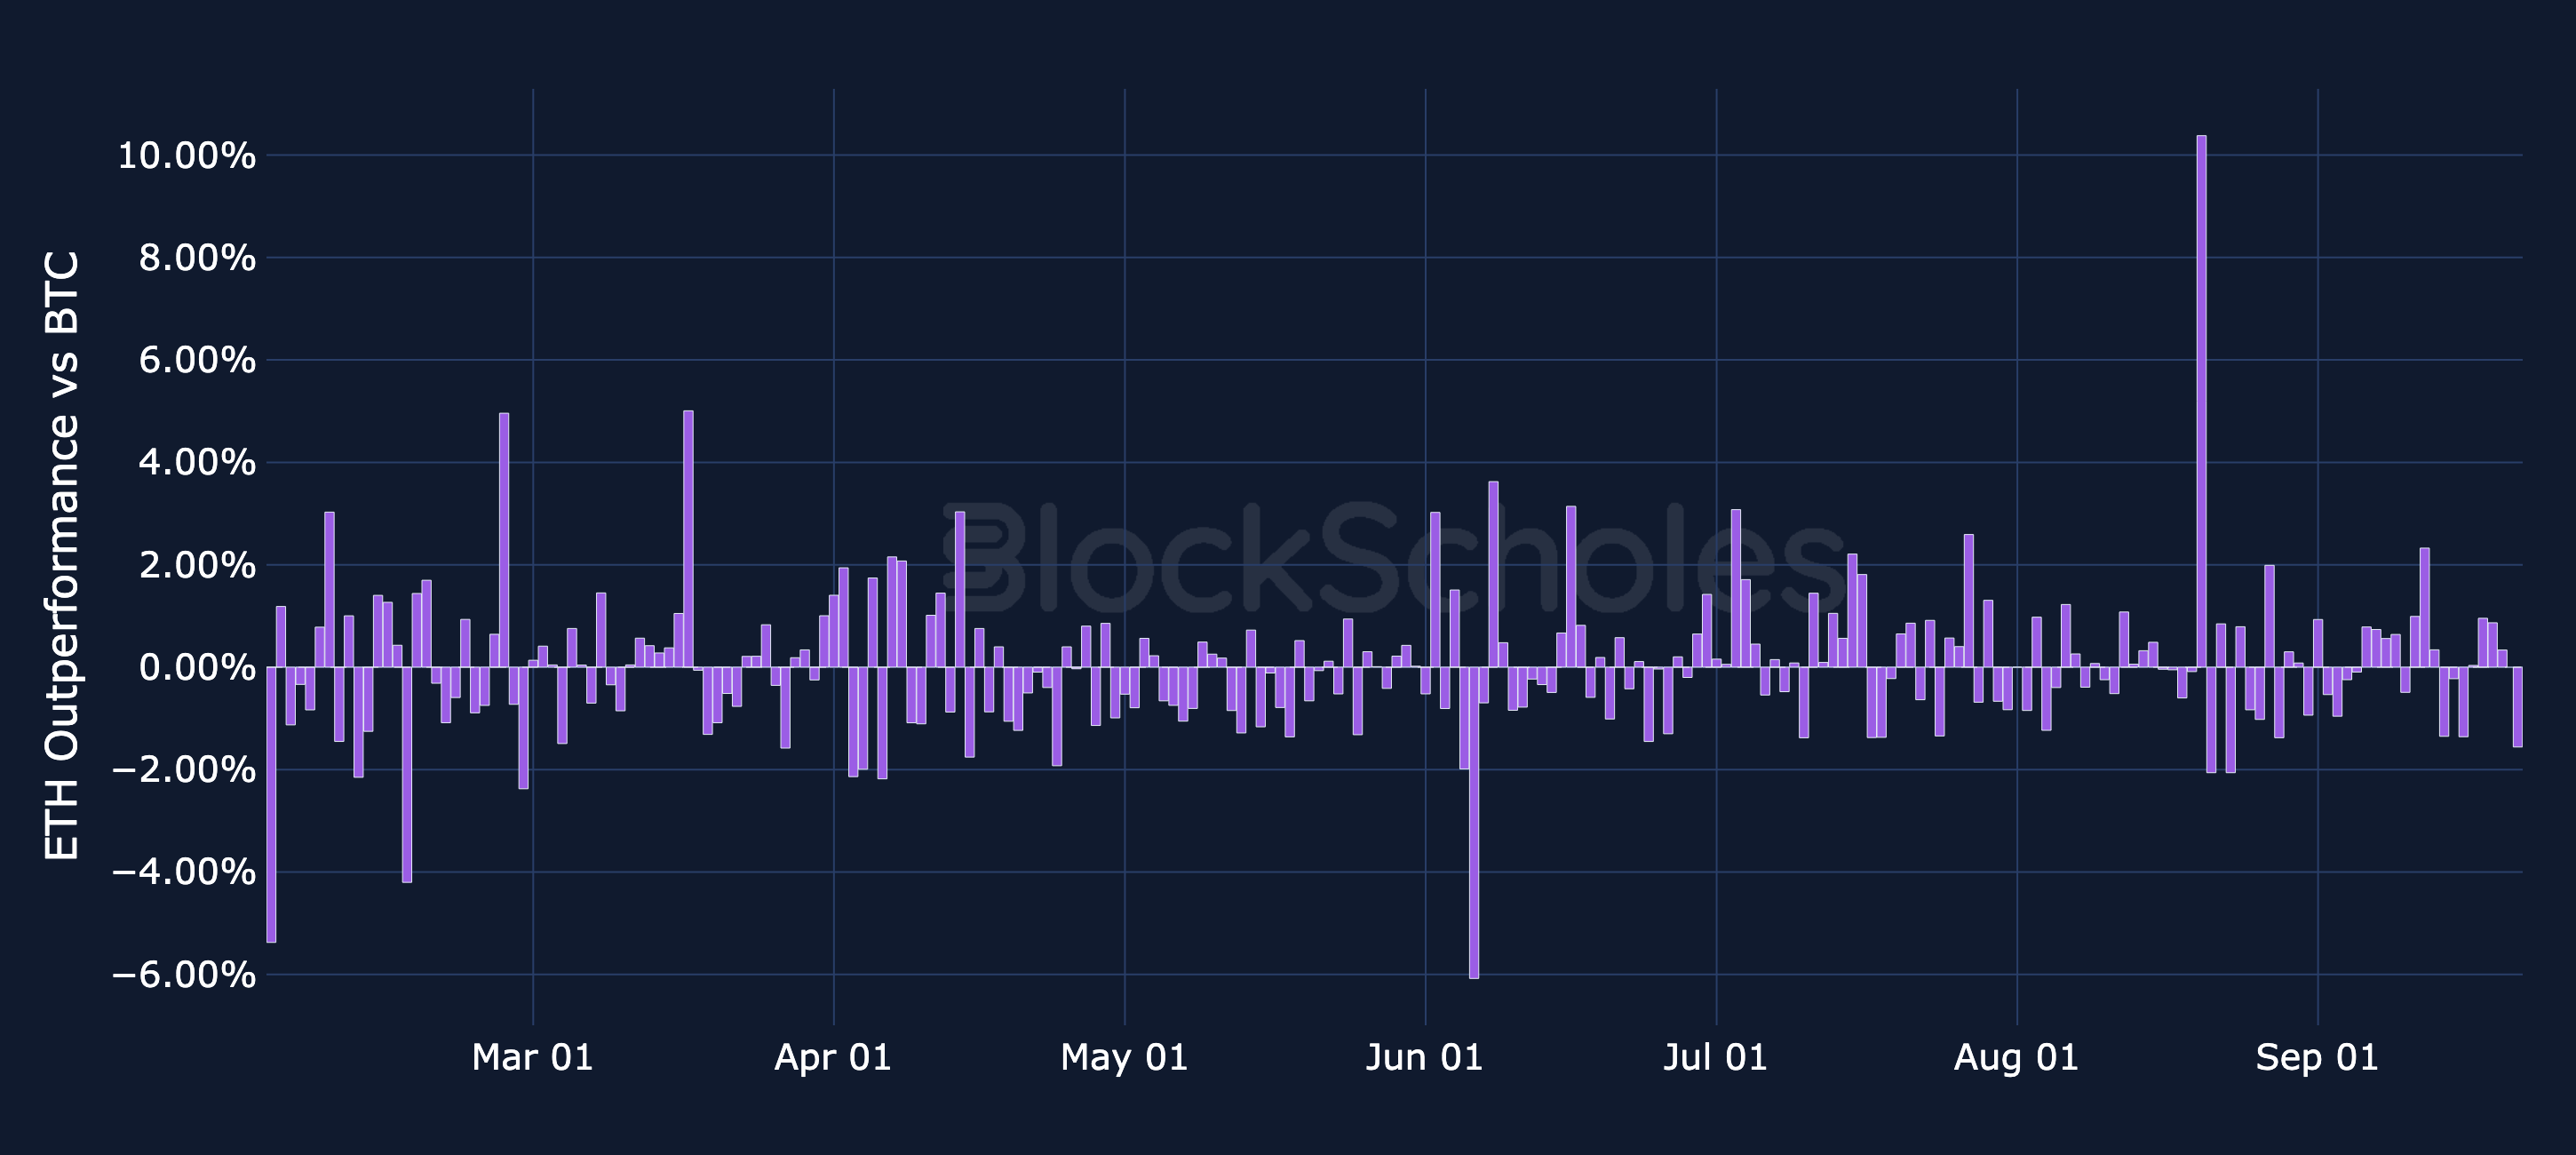
Figure 11. Rolling 30-day beta of each altcoin's daily returns to BTC's. Source: CoinGecko, Block Scholes.

Altcoin Performance vs BTC

Daily relative simple returns vs BTC: ETH

Figure 12. Daily simple return of ETH minus BTC's daily return. Source: CoinGecko, Block Scholes.
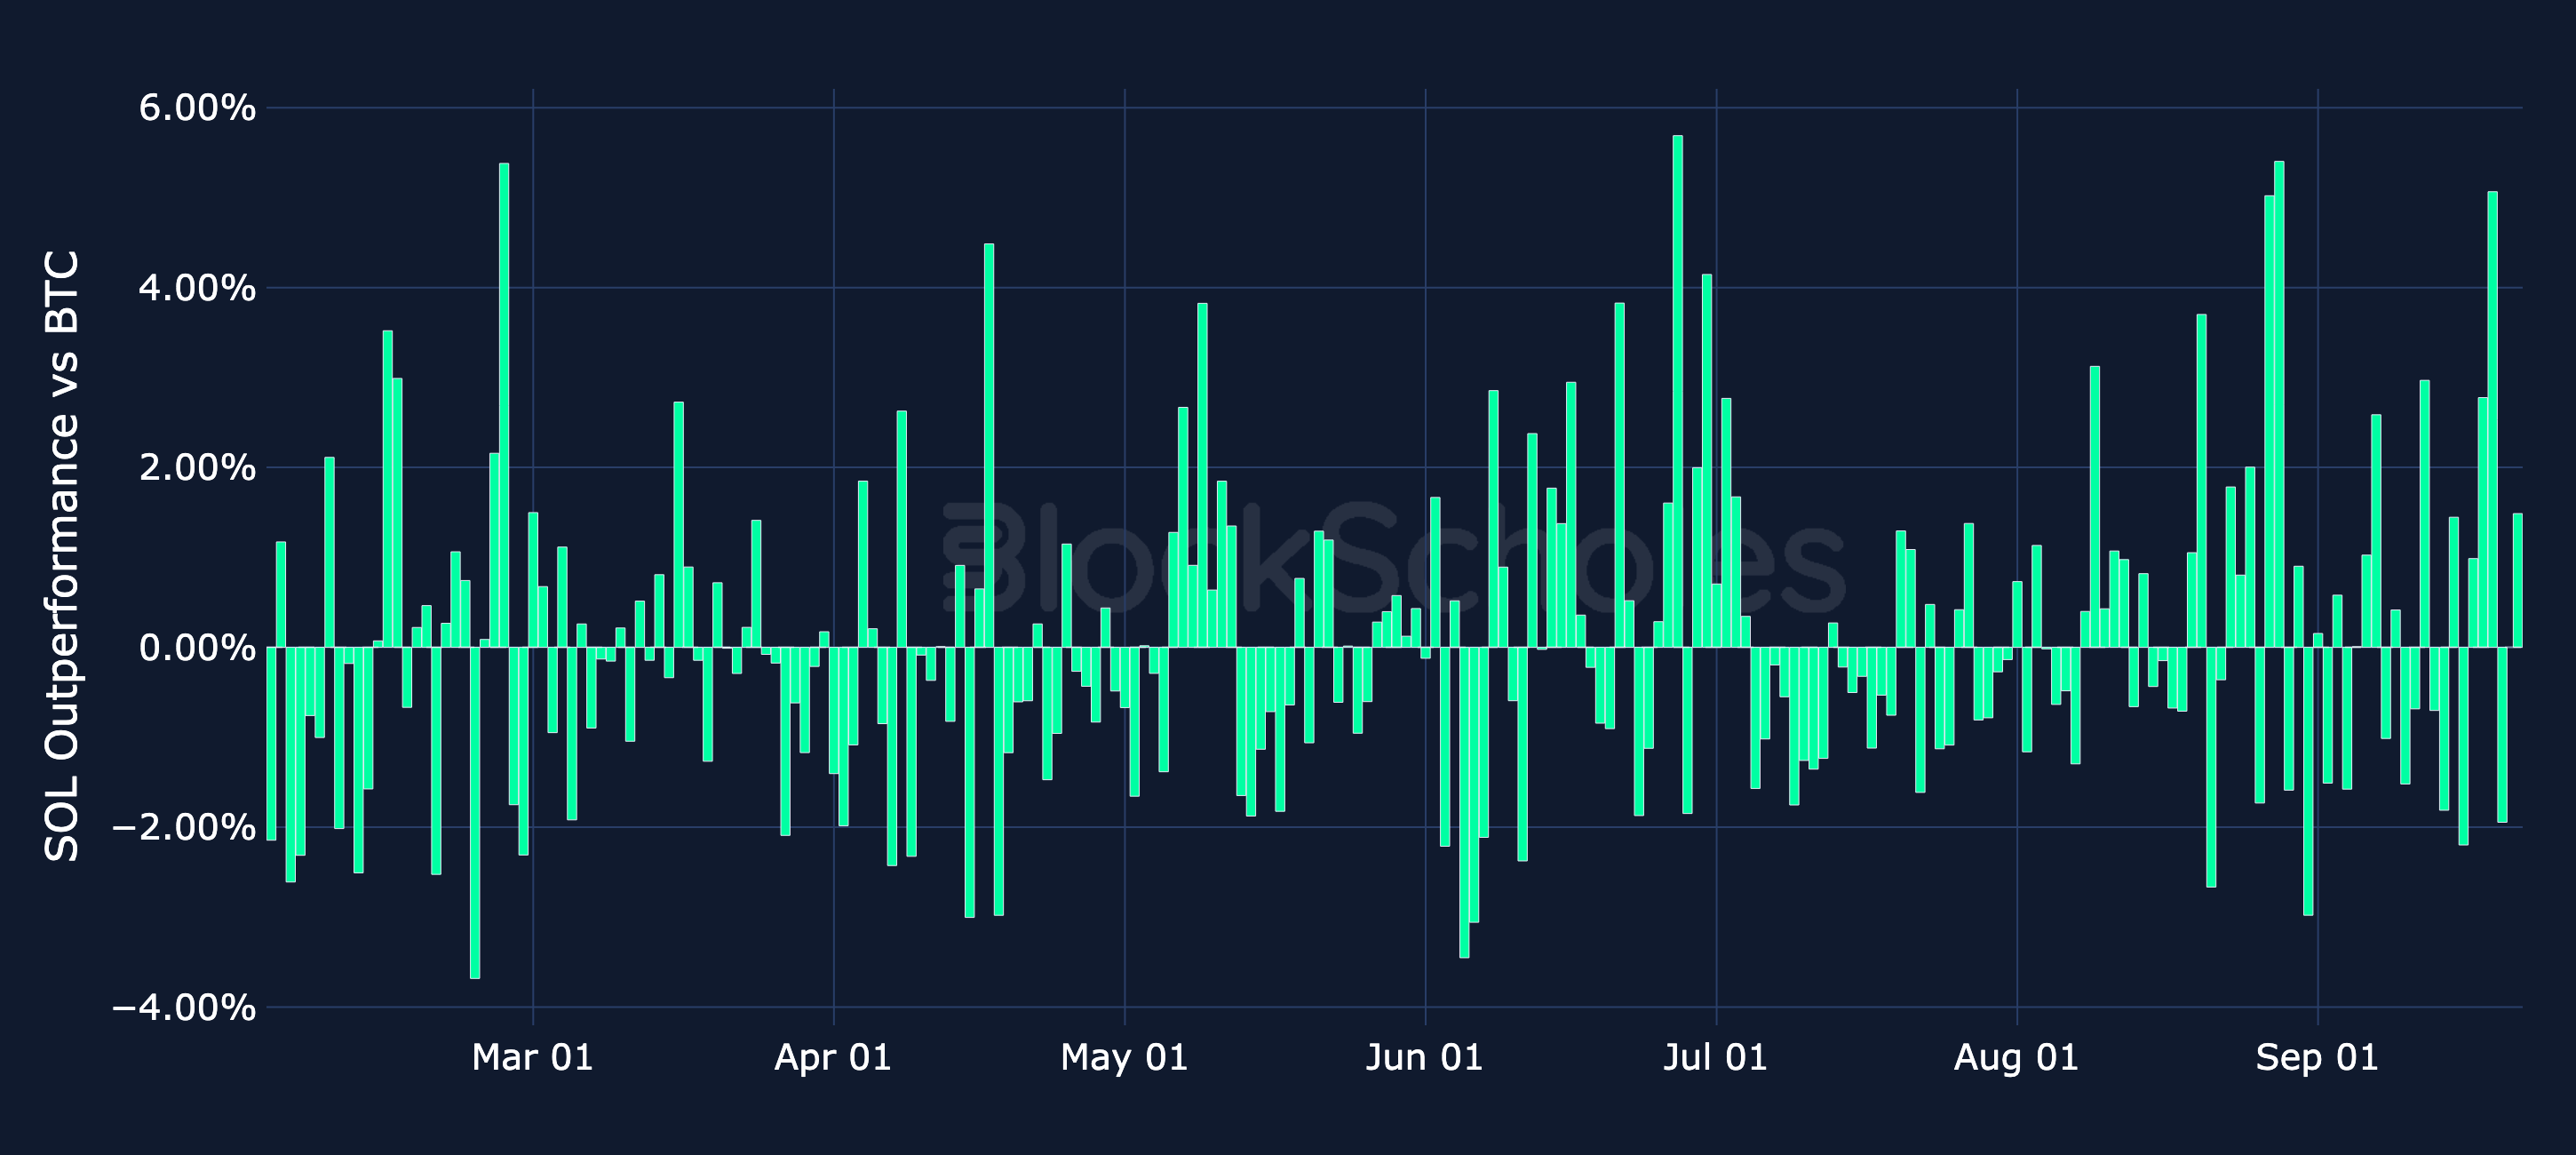
Figure 12. Daily simple return of ETH minus BTC's daily return. Source: CoinGecko, Block Scholes.

Daily relative simple returns vs BTC: SOL

Figure 13. Daily simple return of SOL minus BTC's daily return. Source: CoinGecko, Block Scholes.
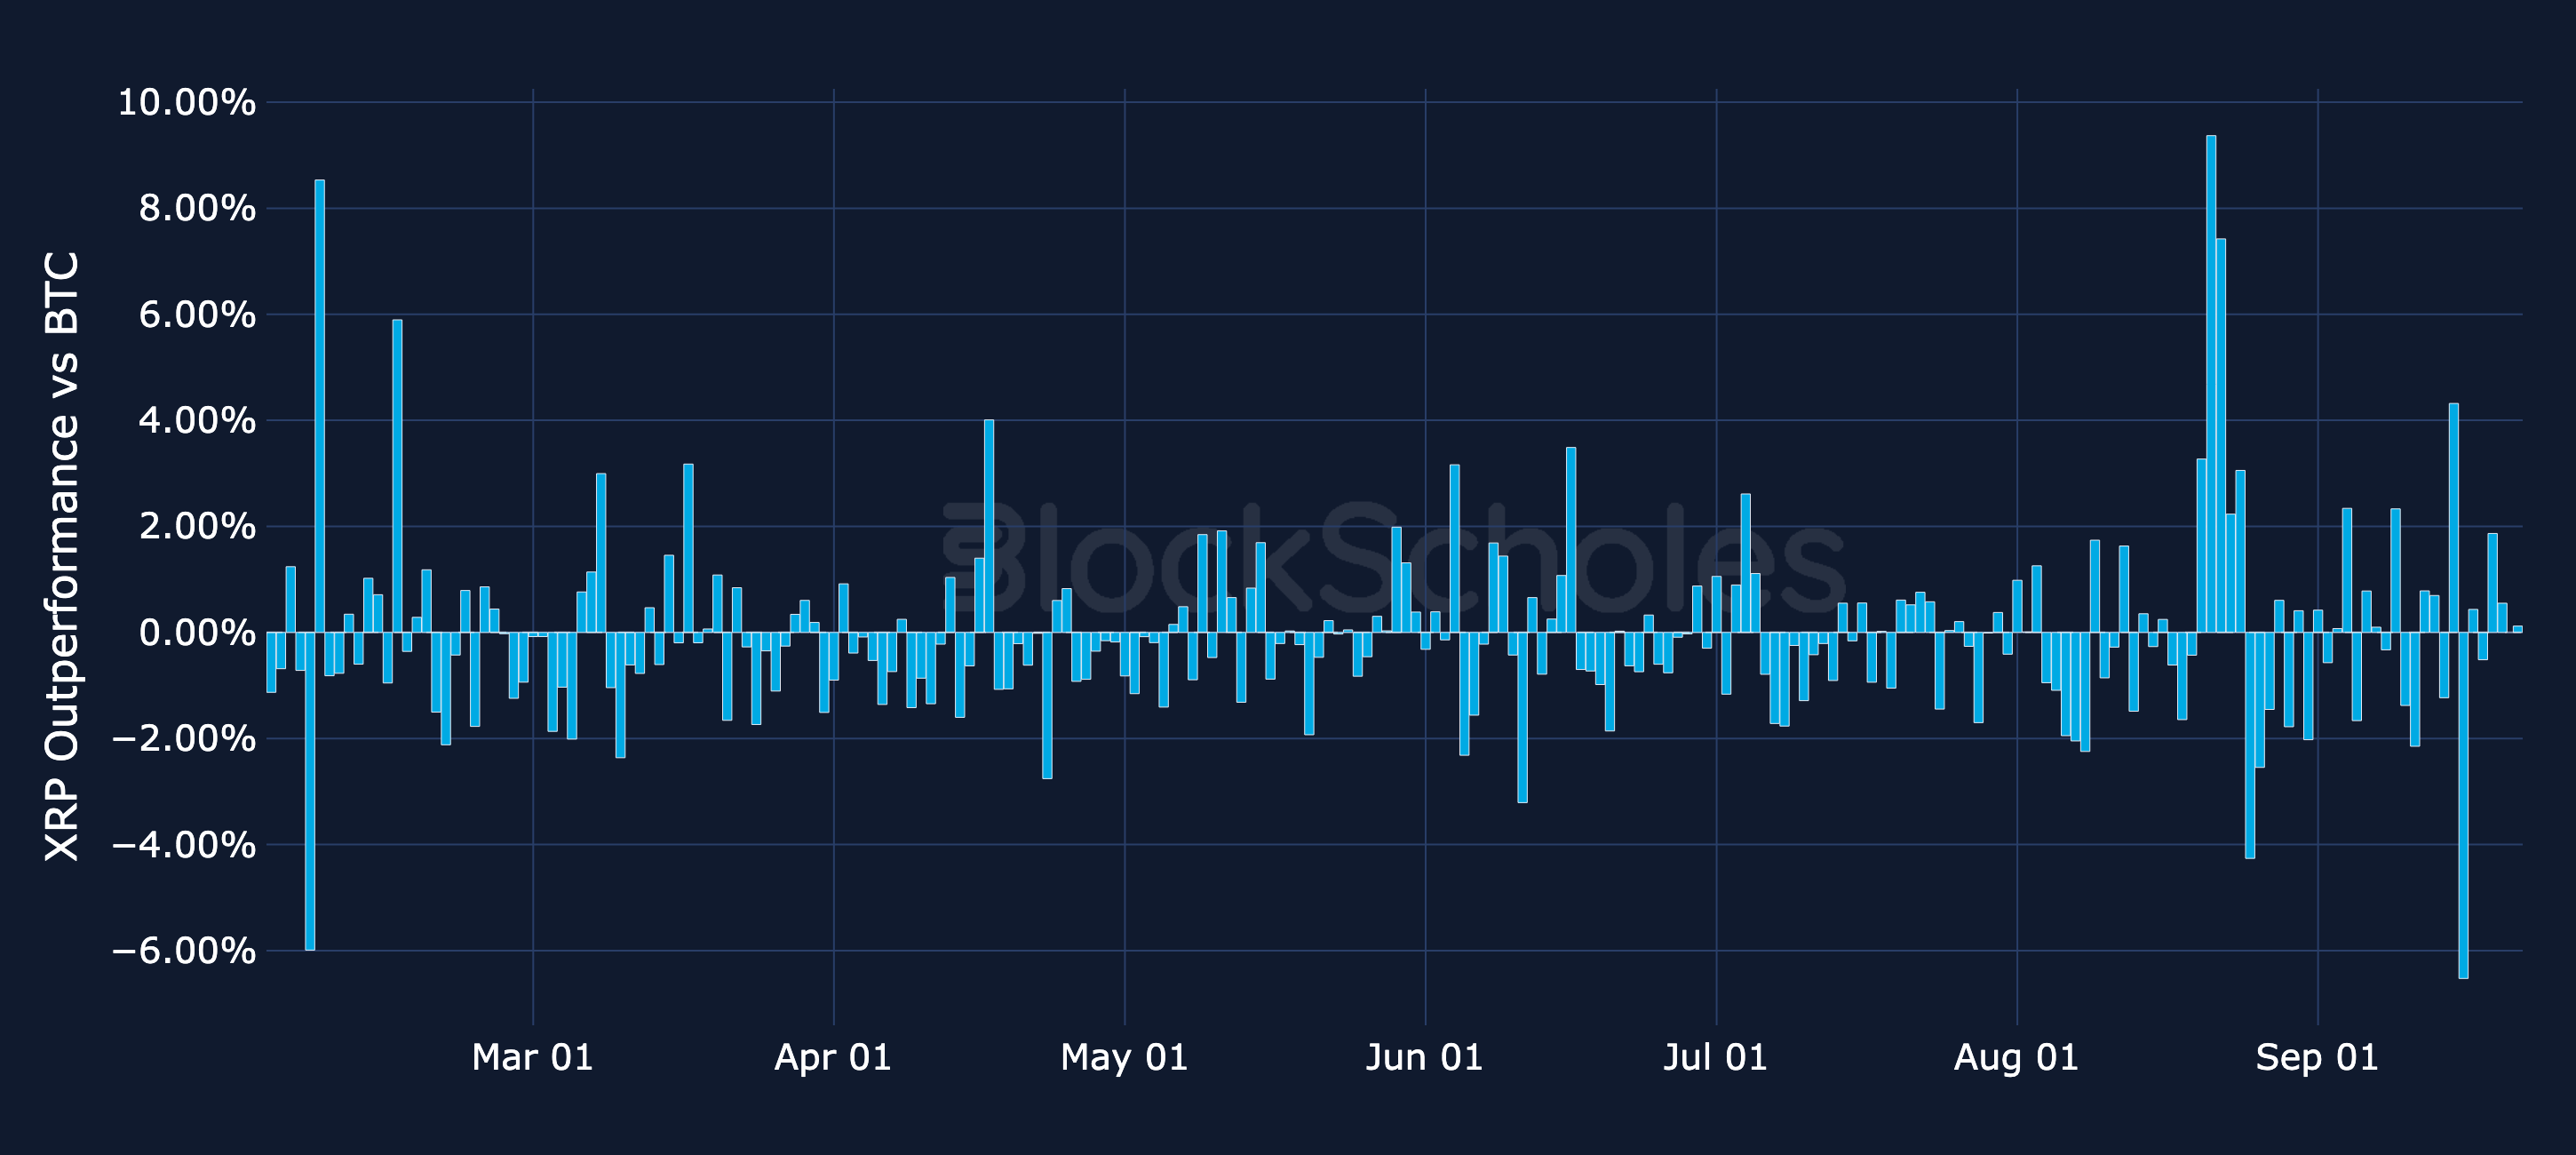
Figure 13. Daily simple return of SOL minus BTC's daily return. Source: CoinGecko, Block Scholes.

Daily relative simple returns vs BTC: XRP

Figure 14. Daily simple return of XRP minus BTC's daily return. Source: CoinGecko, Block Scholes.
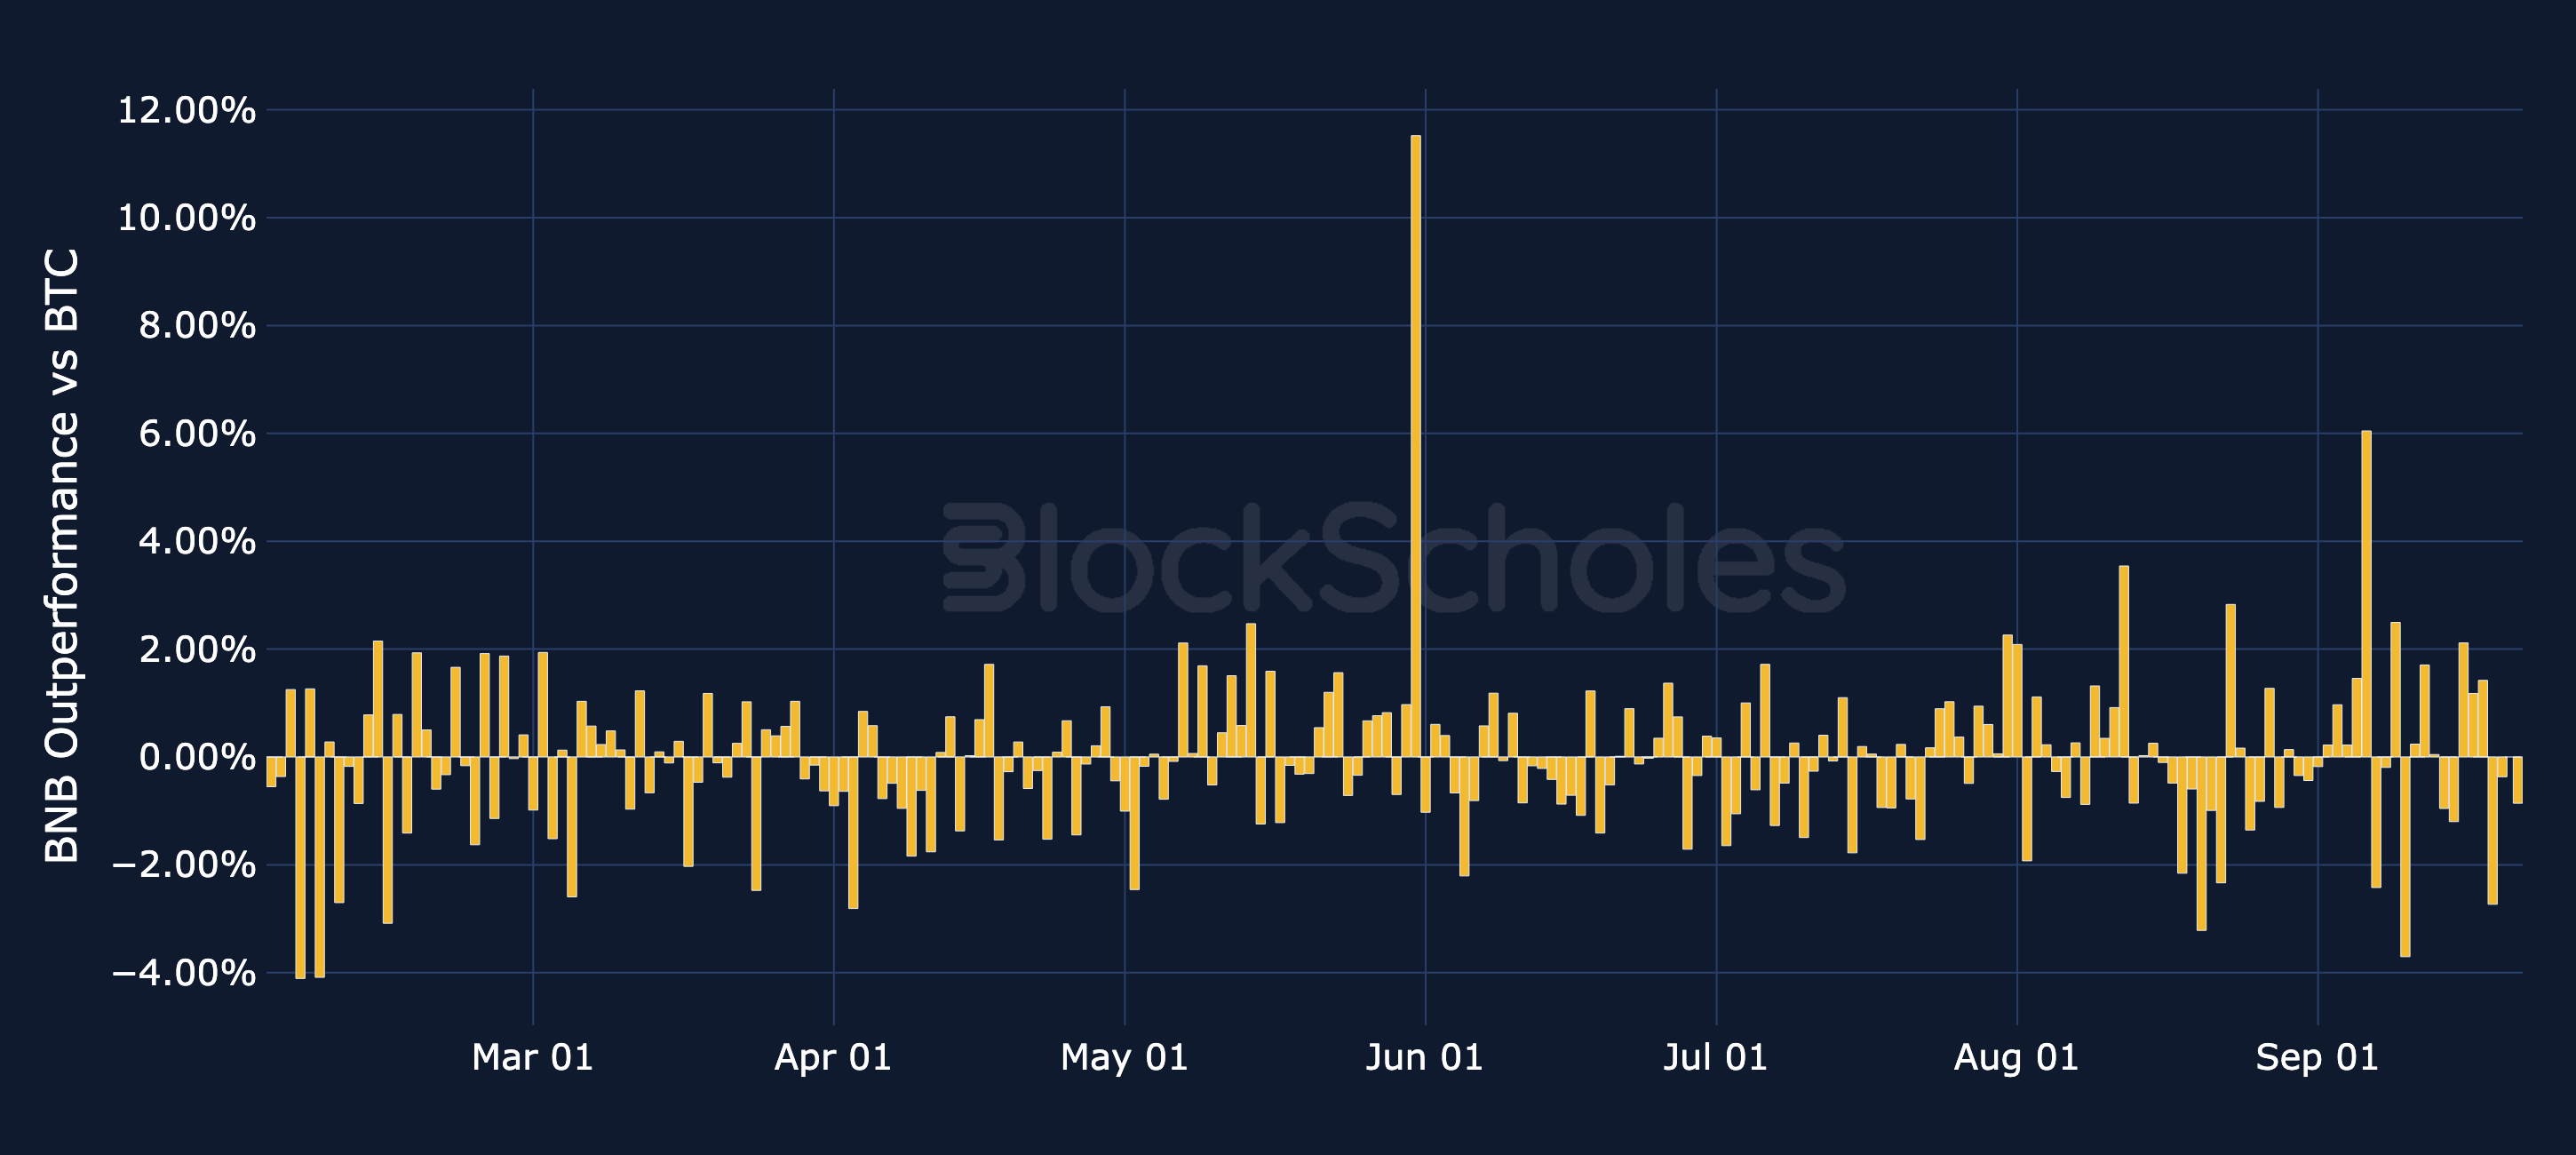
Figure 14. Daily simple return of XRP minus BTC's daily return. Source: CoinGecko, Block Scholes.

Daily relative simple returns vs BTC: BNB

Figure 15. Daily simple return of BNB minus BTC's daily return. Source: CoinGecko, Block Scholes.

Figure 15. Daily simple return of BNB minus BTC's daily return. Source: CoinGecko, Block Scholes.

ETF Flows: BTC, ETH & Altcoins

ETF Flows – Spot BTC ETFs were roughly flat over the past week (14th September–18th September), adding just $6.21M, which leaves their recovery from the 13th July low intact. Over the 48 trading days from that low they have taken in $4.31B, with net inflows on 31 of them, winning back about half of the $8.91B that flowed out between the 6th May peak and 13th July. ETH ETFs swung to net outflows of $140M over the same week, after $197M of inflows the week before.

ZEC joins the ETF charts this week: Grayscale's Zcash ETF (ZCSH) began trading on 25th August and has drawn $271M of net inflows to date, with net assets of about $915M as of 18th September. It also led altcoin ETF inflows over the past week at $98.2M, taking in money on all five trading days, ahead of SOL at $13.2M, XRP at $9.56M, HYPE at $3.06M and LINK at $2.62M. Smaller inflows went to AVAX ($972K), TRX ($491K), DOGE ($285K), LTC ($279K) and HBAR ($102K).

Adjusted for market cap, ZEC has the largest 20-day rolling net ETF inflow among altcoin ETFs, at around 1.45% of token market cap (as of 18th September), a window that spans the fund's entire trading history so far. Over the fund's life, ZEC's price has also rallied far more than any other coin in the ETF charts: it rose about 88% between 25th August and 18th September, against about 17% for HYPE, 14% for SOL, 5% for ETH and 2% for BTC.
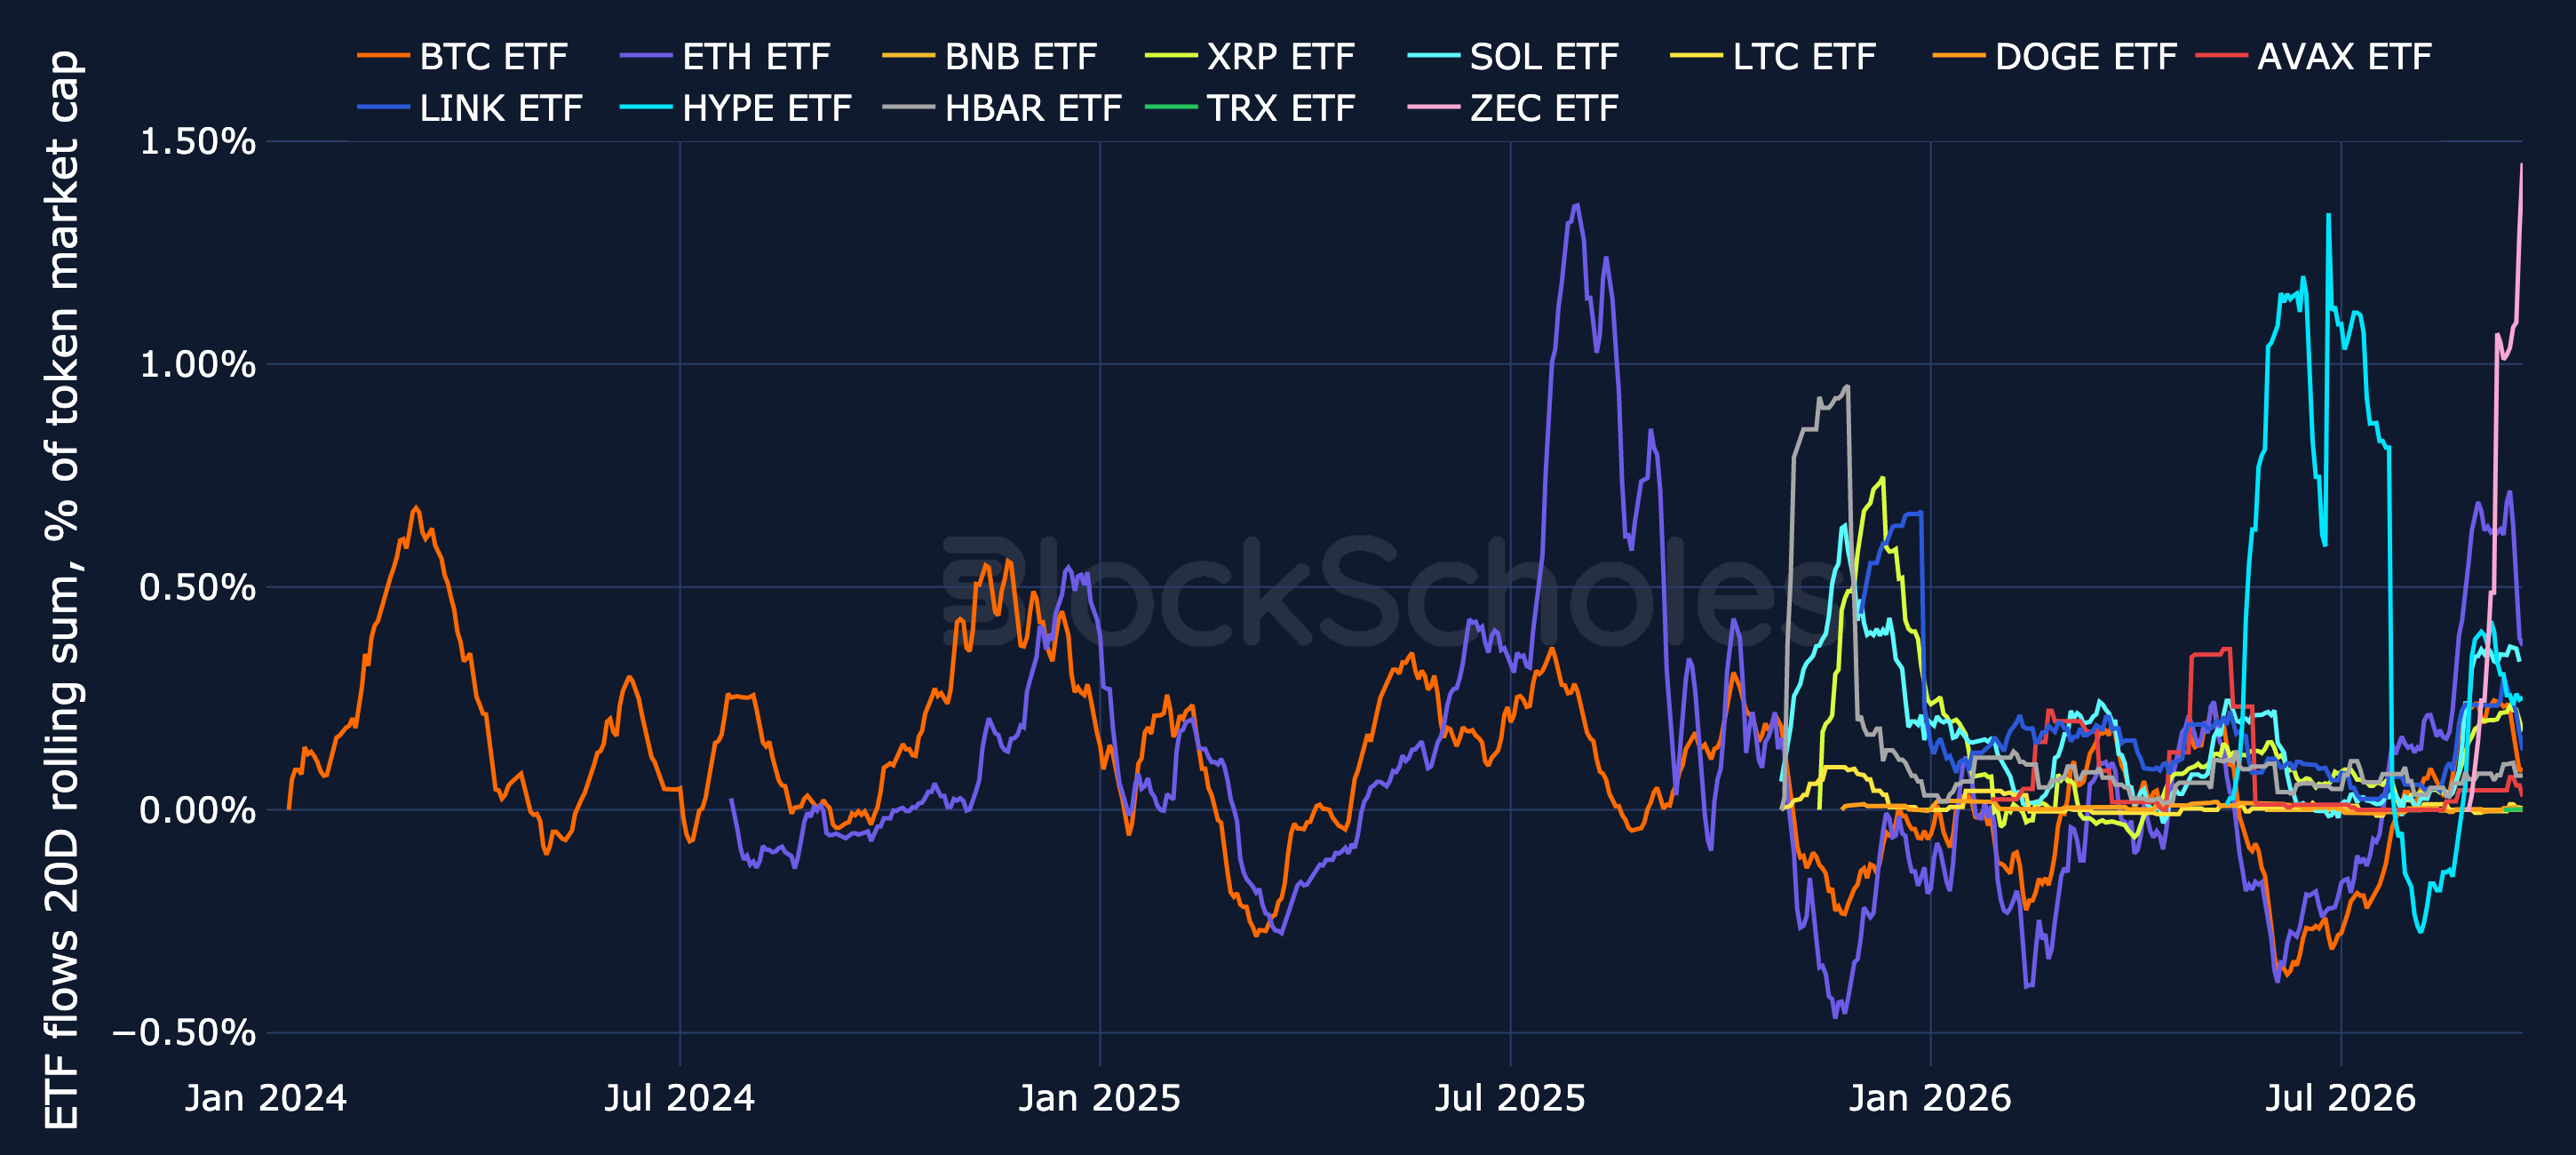
ETF net flows: BTC, ETH & Altcoins (20-day rolling, % of market cap)

Figure 16. Net flows into spot BTC, ETH and altcoin ETFs, 20-day rolling sum as a percentage of each token's market cap. Source: SoSoValue, CoinGecko, Block Scholes.
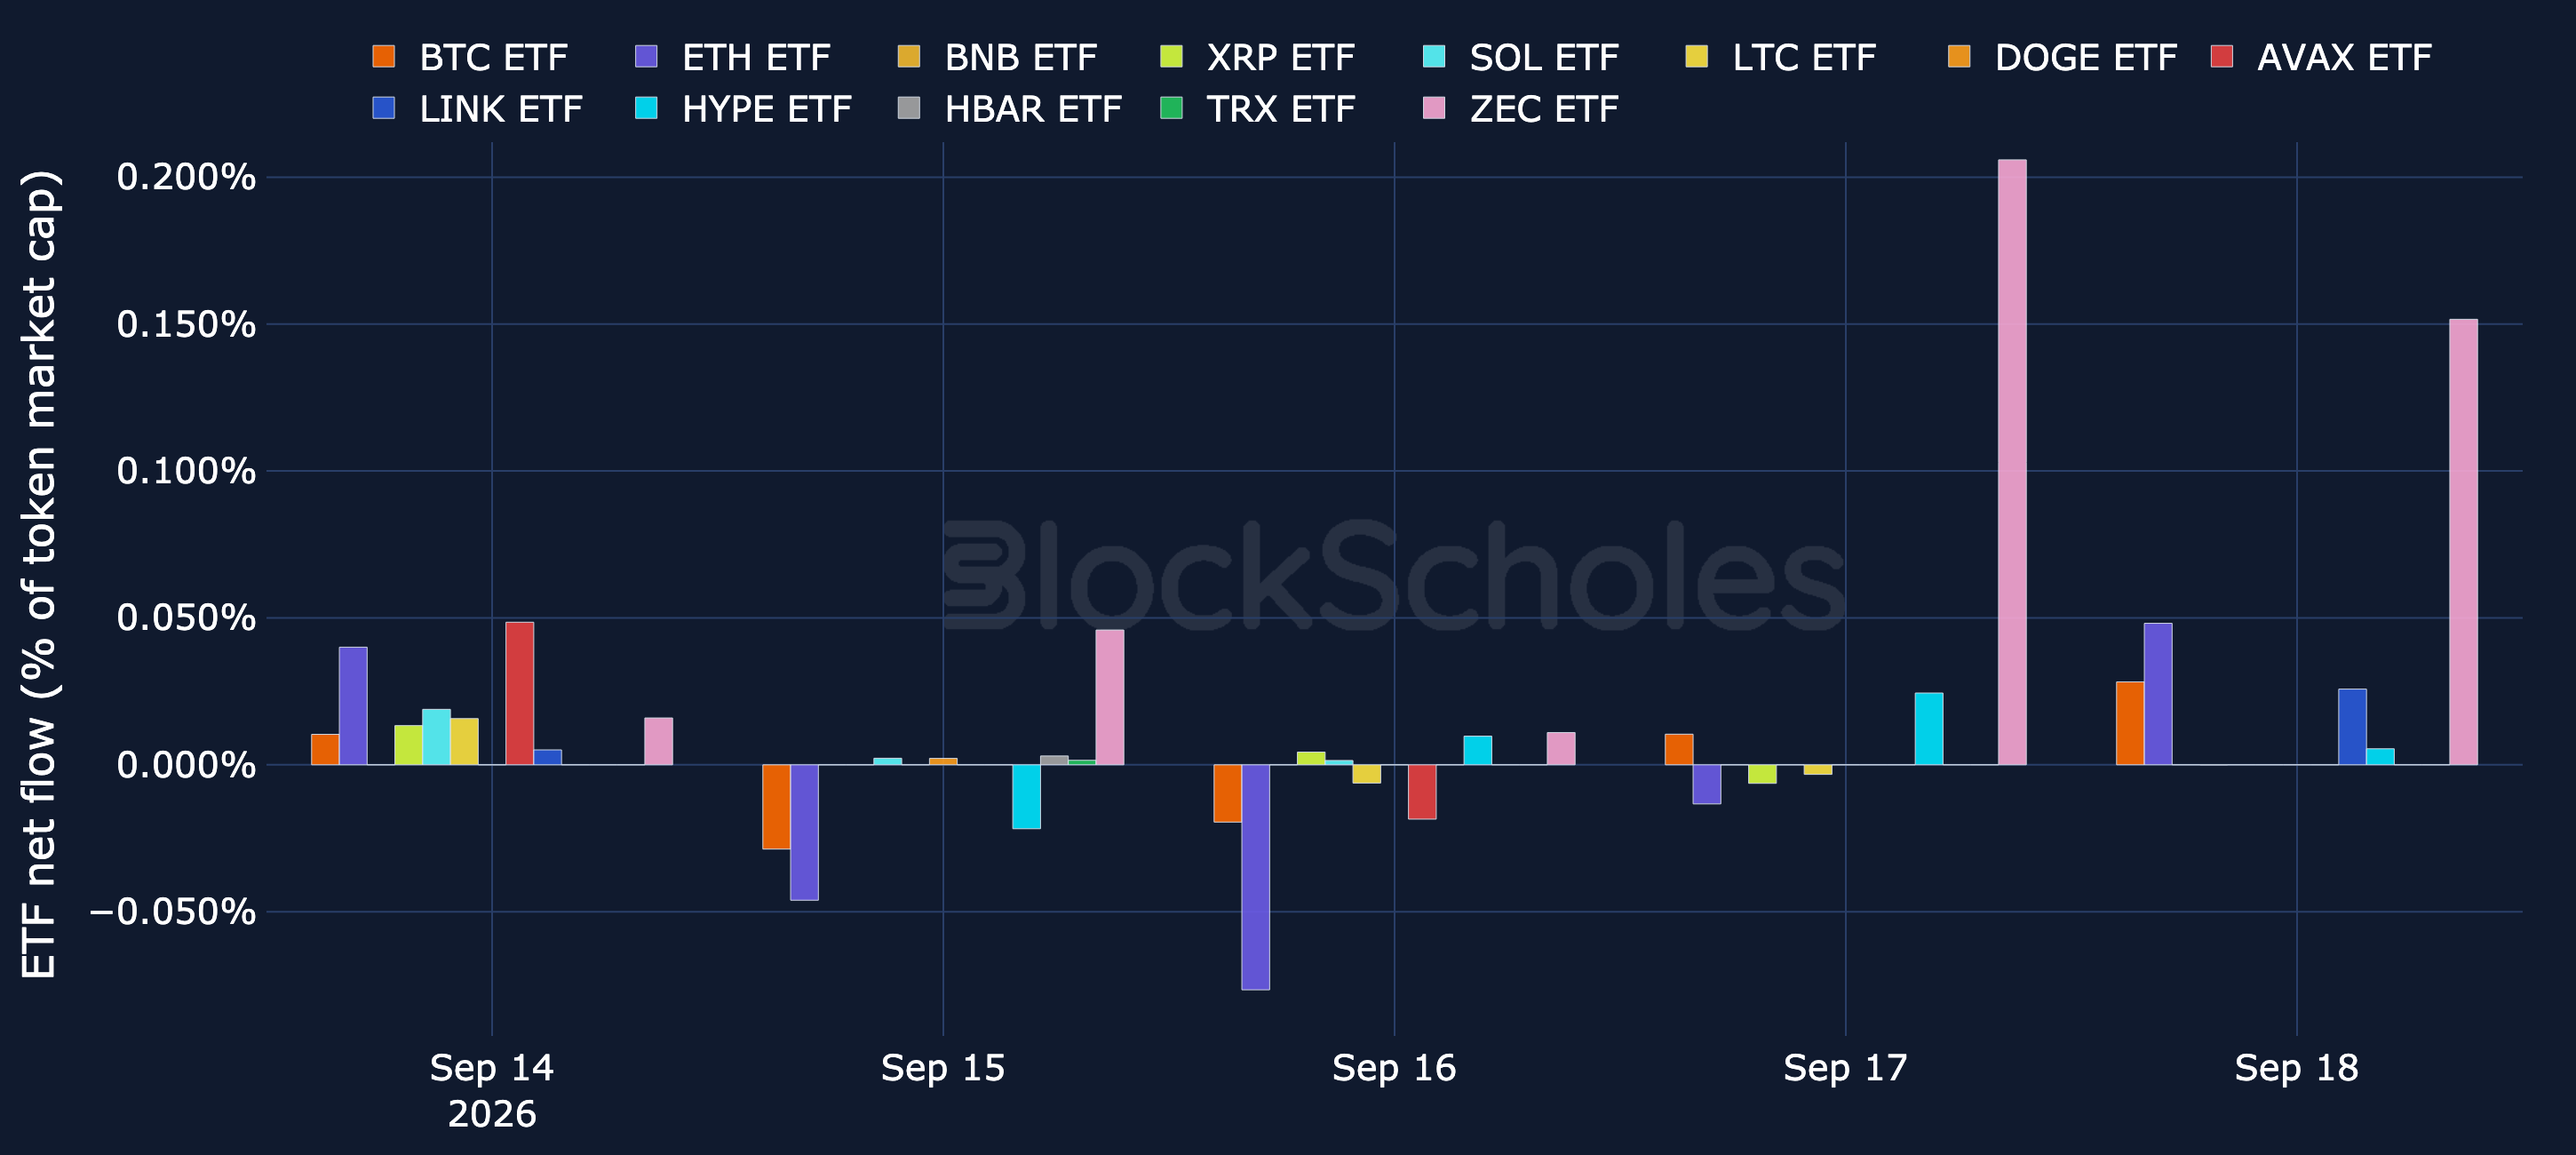
Figure 16. Net flows into spot BTC, ETH and altcoin ETFs, 20-day rolling sum as a percentage of each token's market cap. Source: SoSoValue, CoinGecko, Block Scholes.

ETF net flows: BTC, ETH & Altcoins (latest week, % of market cap)

Figure 17. Net flows into spot BTC, ETH and altcoin ETFs over the latest week, as a percentage of each token's market cap. Source: SoSoValue, CoinGecko, Block Scholes.
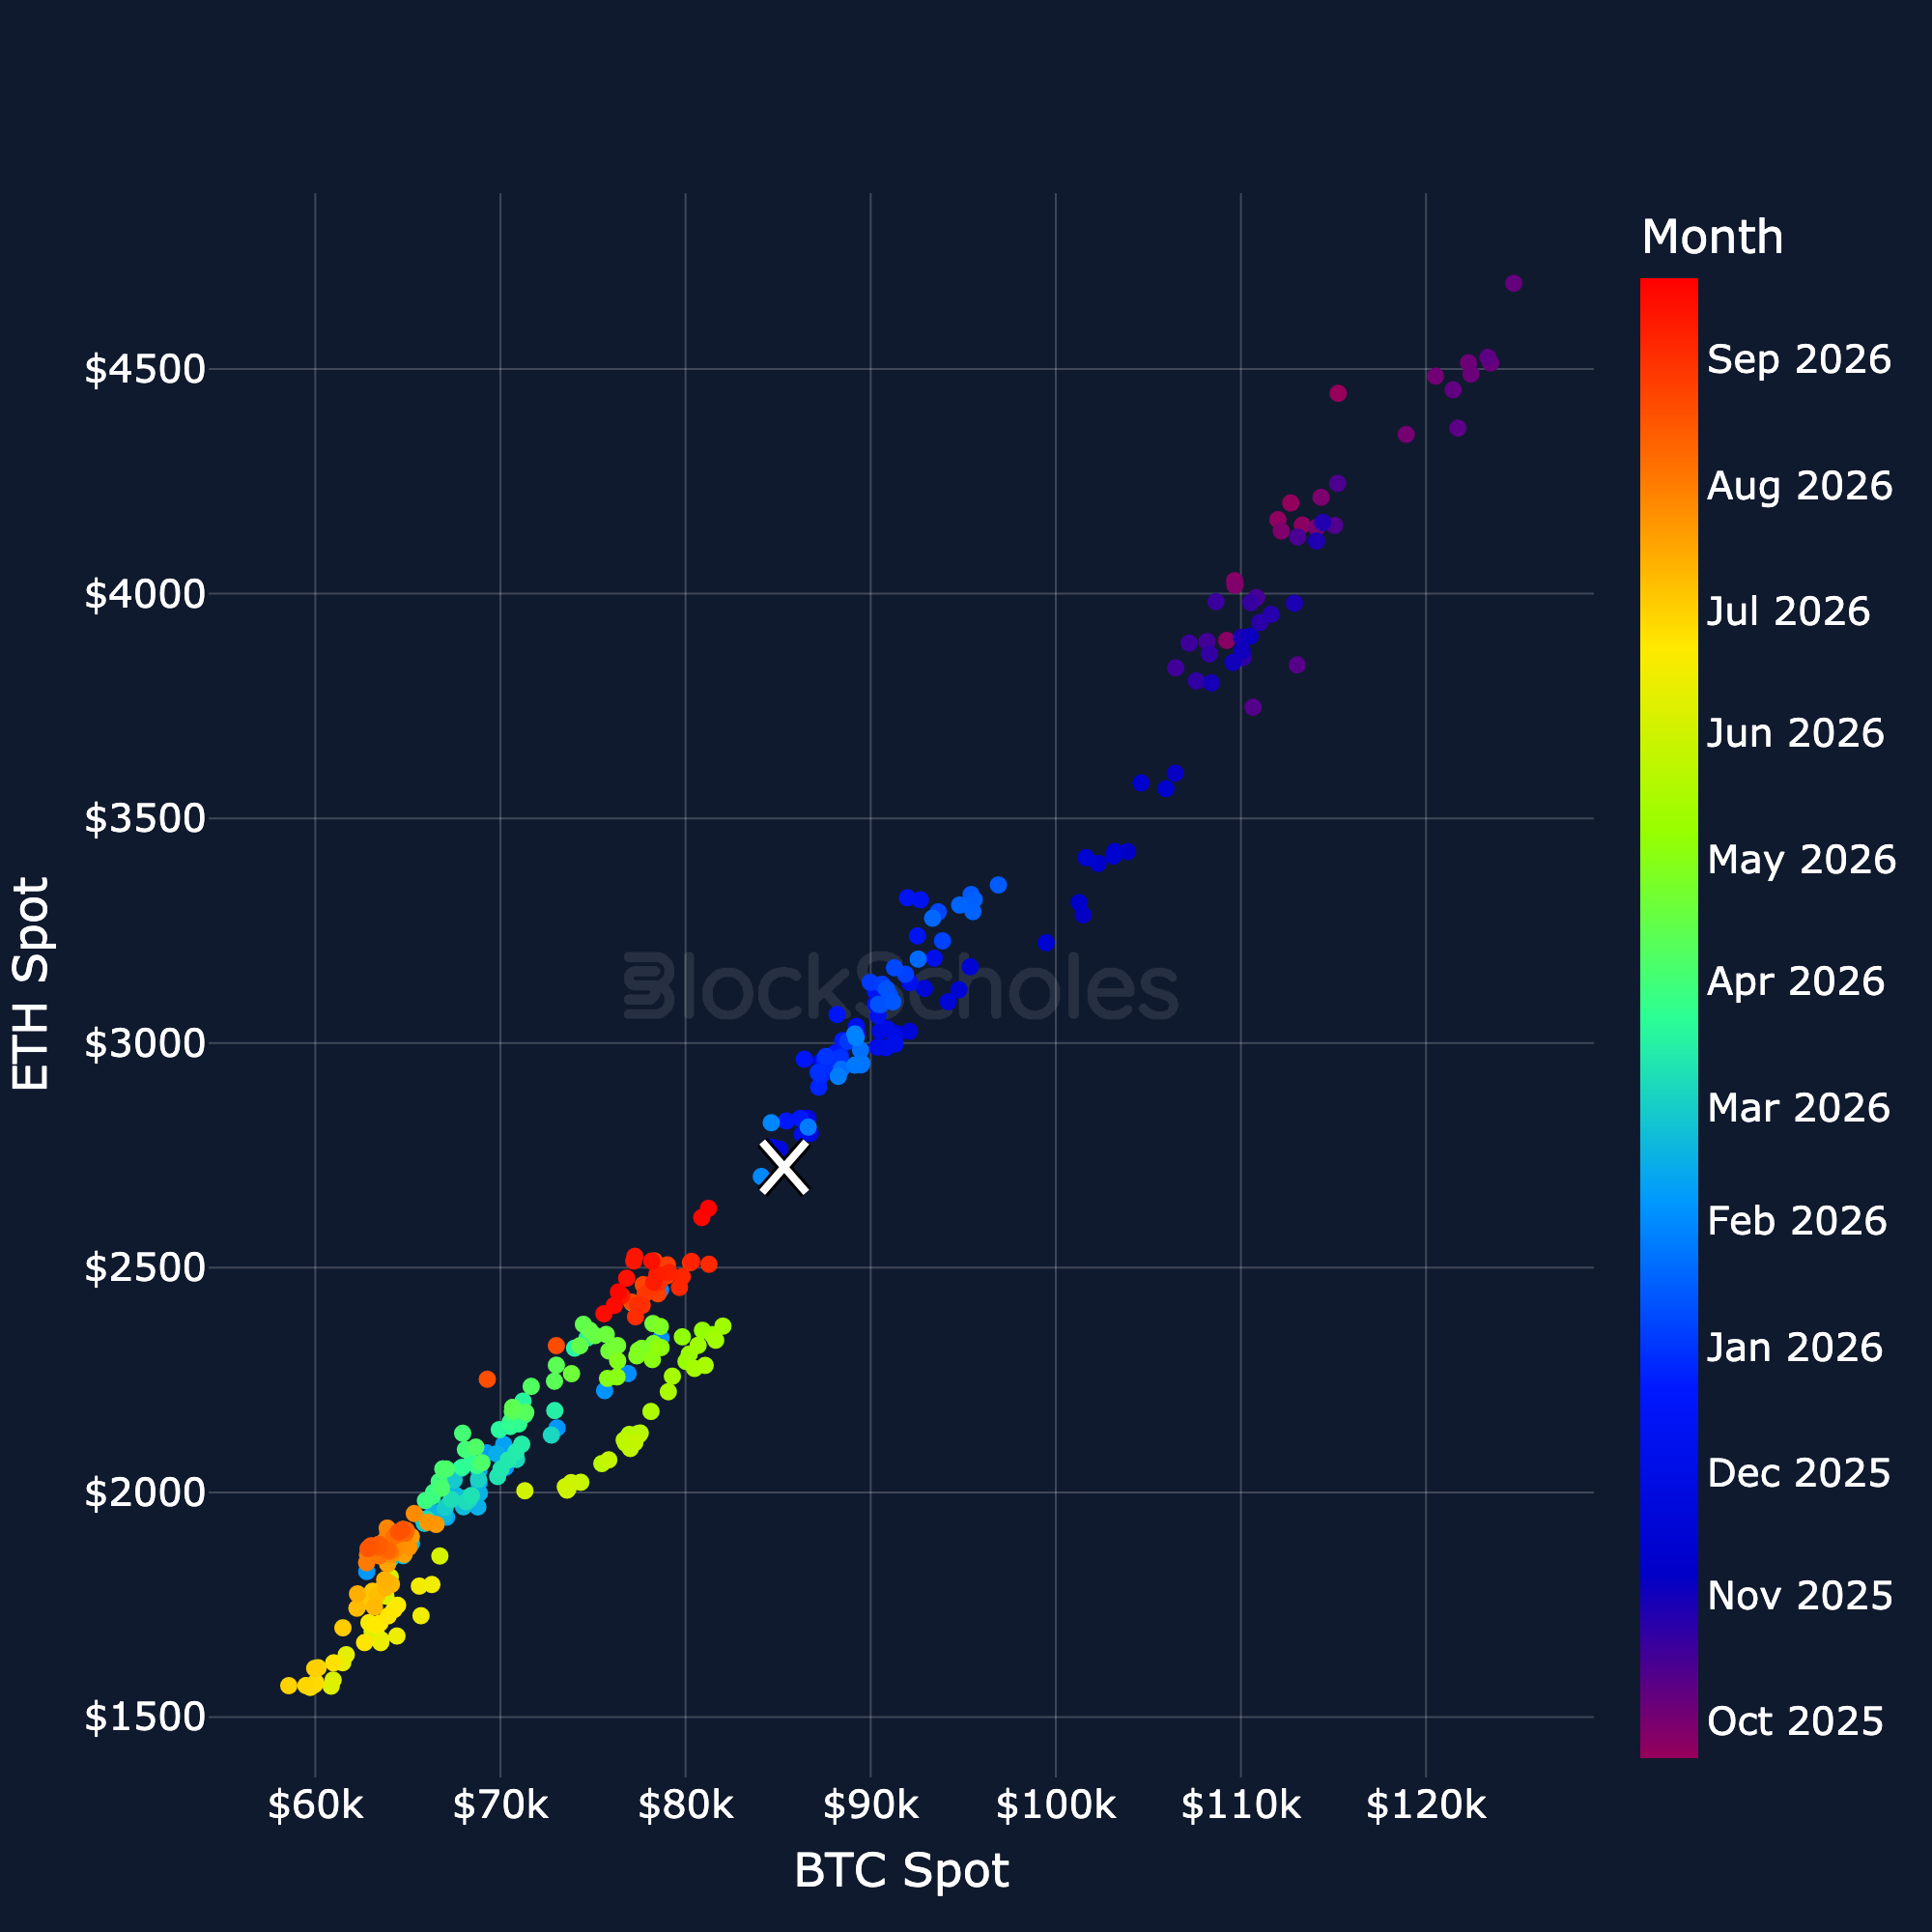
Figure 17. Net flows into spot BTC, ETH and altcoin ETFs over the latest week, as a percentage of each token's market cap. Source: SoSoValue, CoinGecko, Block Scholes.

Regression-Based Valuation vs BTC

ETH Spot vs BTC Spot regression

Figure 18. ETH spot price against BTC spot price: daily closes coloured by month, latest day marked with a cross. Source: CoinGecko, Block Scholes.
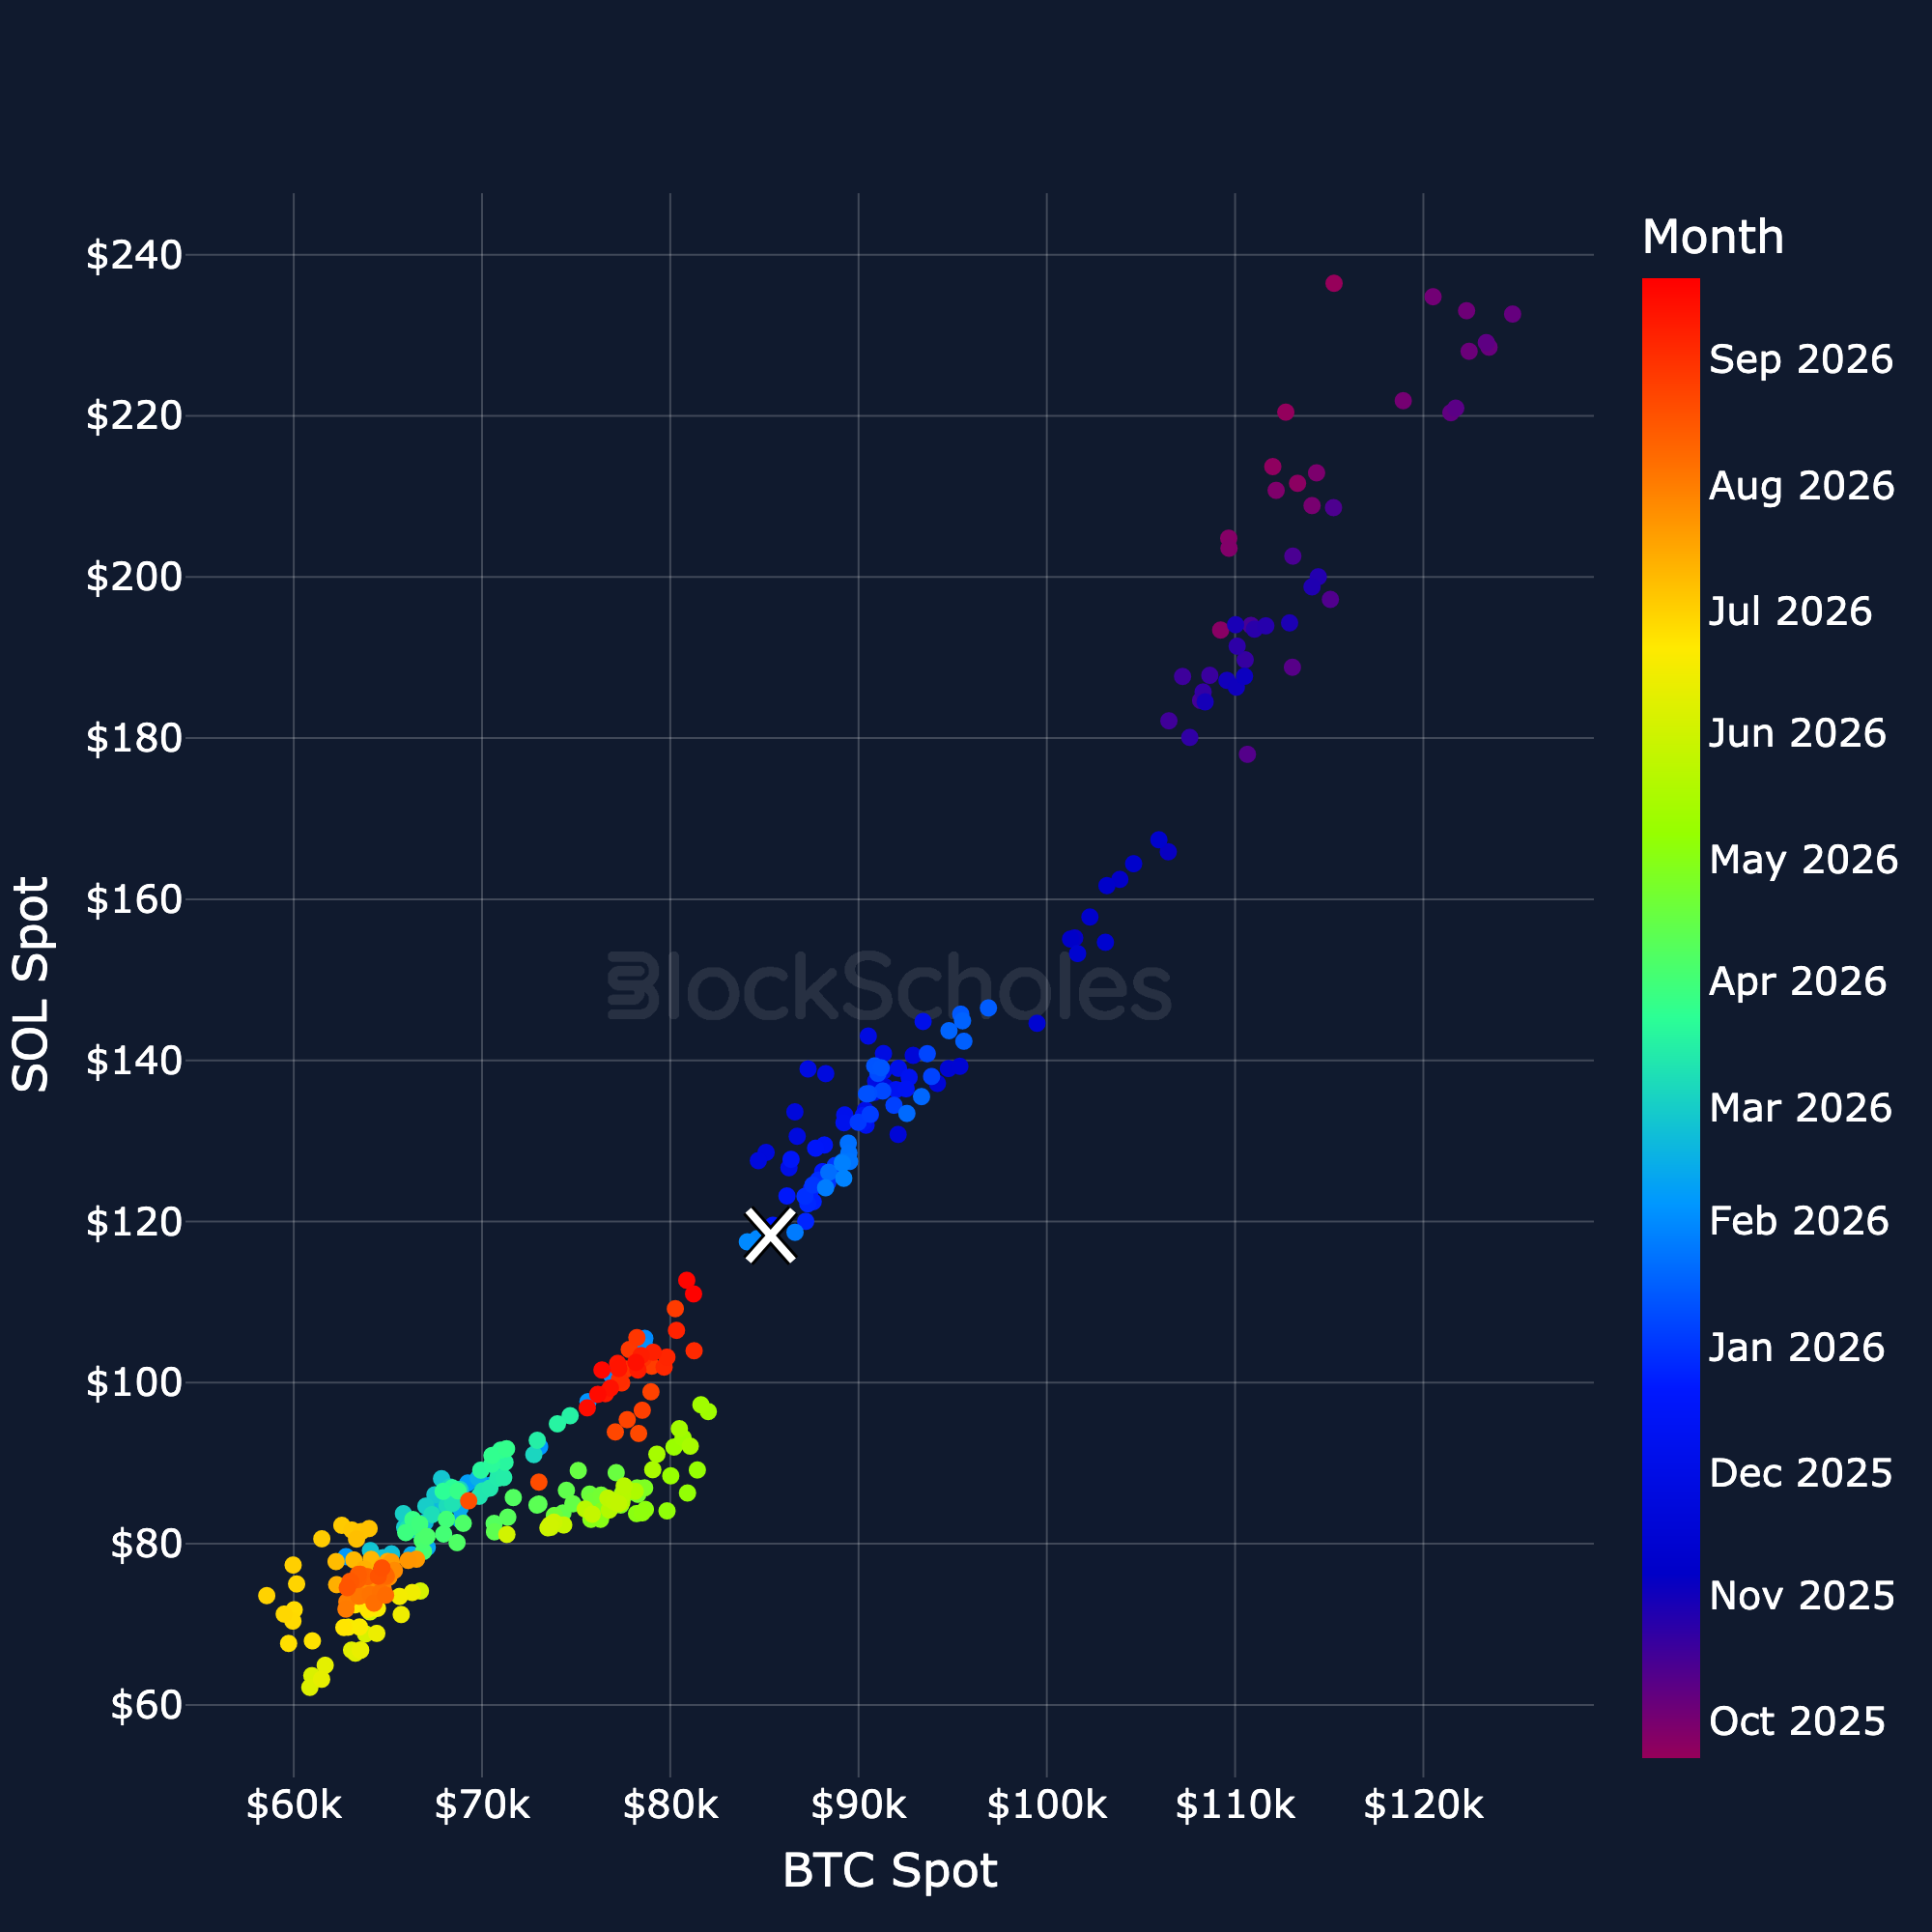
Figure 18. ETH spot price against BTC spot price: daily closes coloured by month, latest day marked with a cross. Source: CoinGecko, Block Scholes.
SOL Spot vs BTC Spot regression

Figure 19. SOL spot price against BTC spot price: daily closes coloured by month, latest day marked with a cross. Source: CoinGecko, Block Scholes.
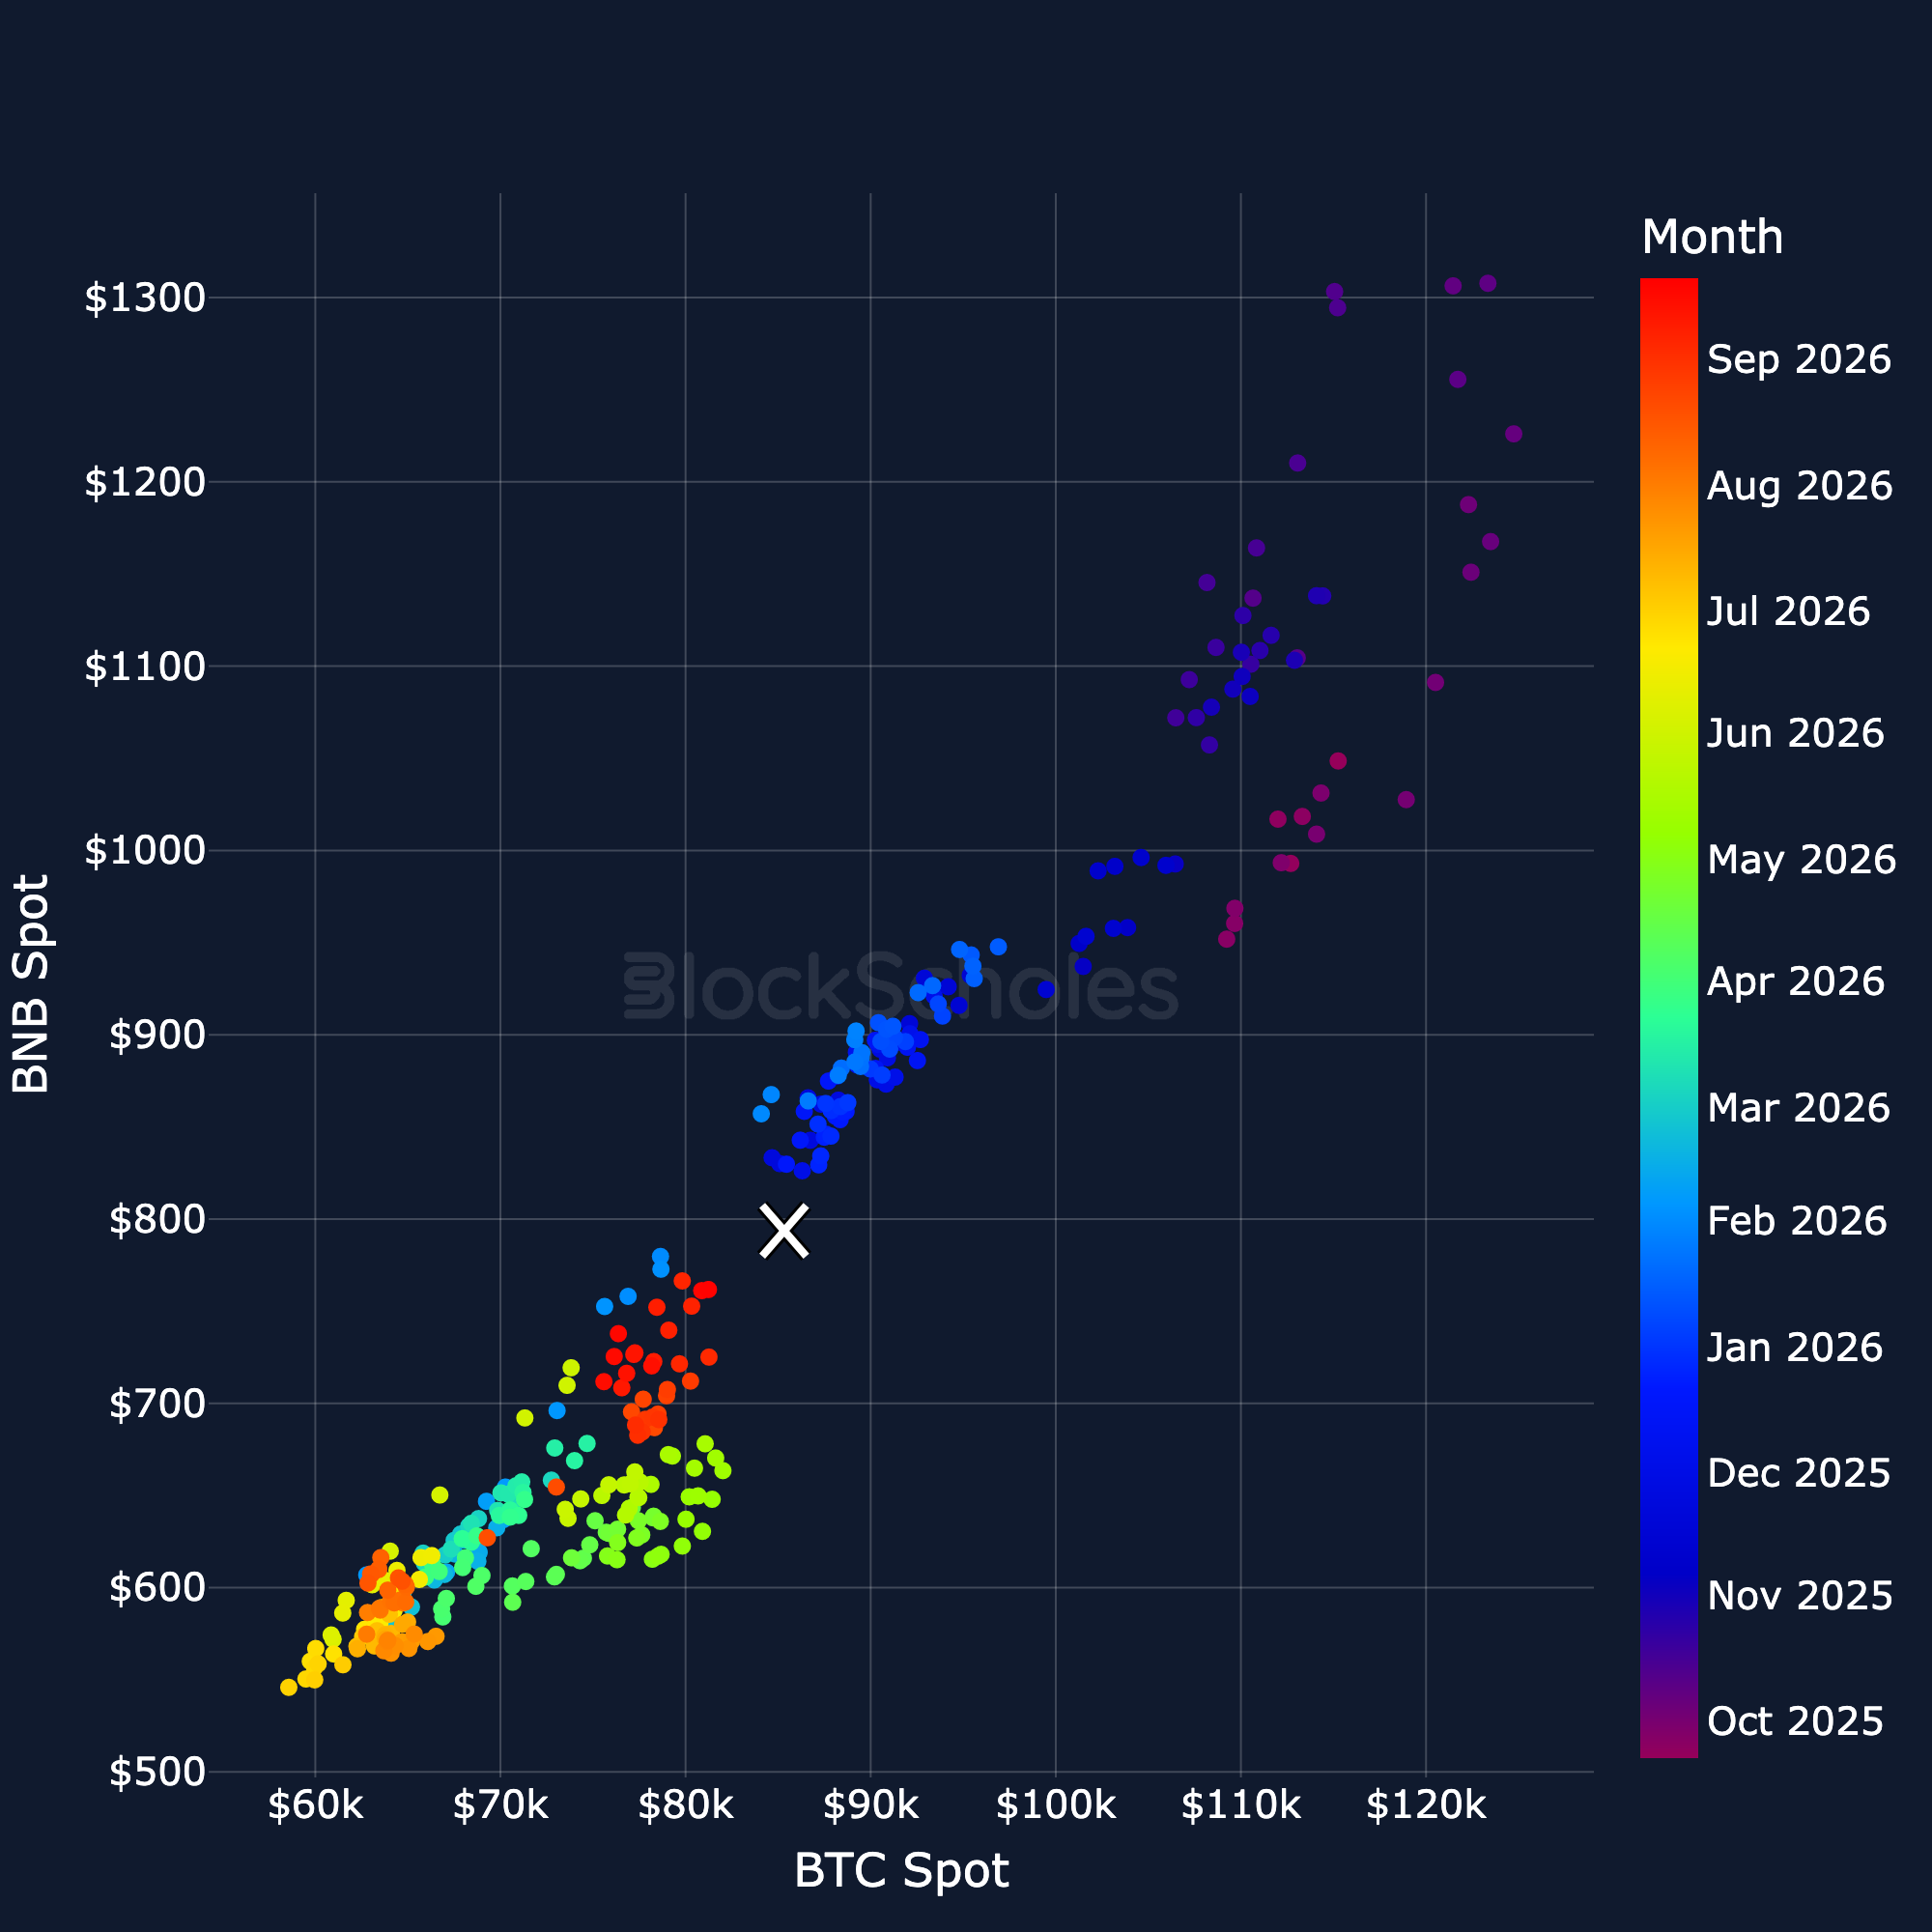
Figure 19. SOL spot price against BTC spot price: daily closes coloured by month, latest day marked with a cross. Source: CoinGecko, Block Scholes.


XRP Spot vs BTC Spot regression

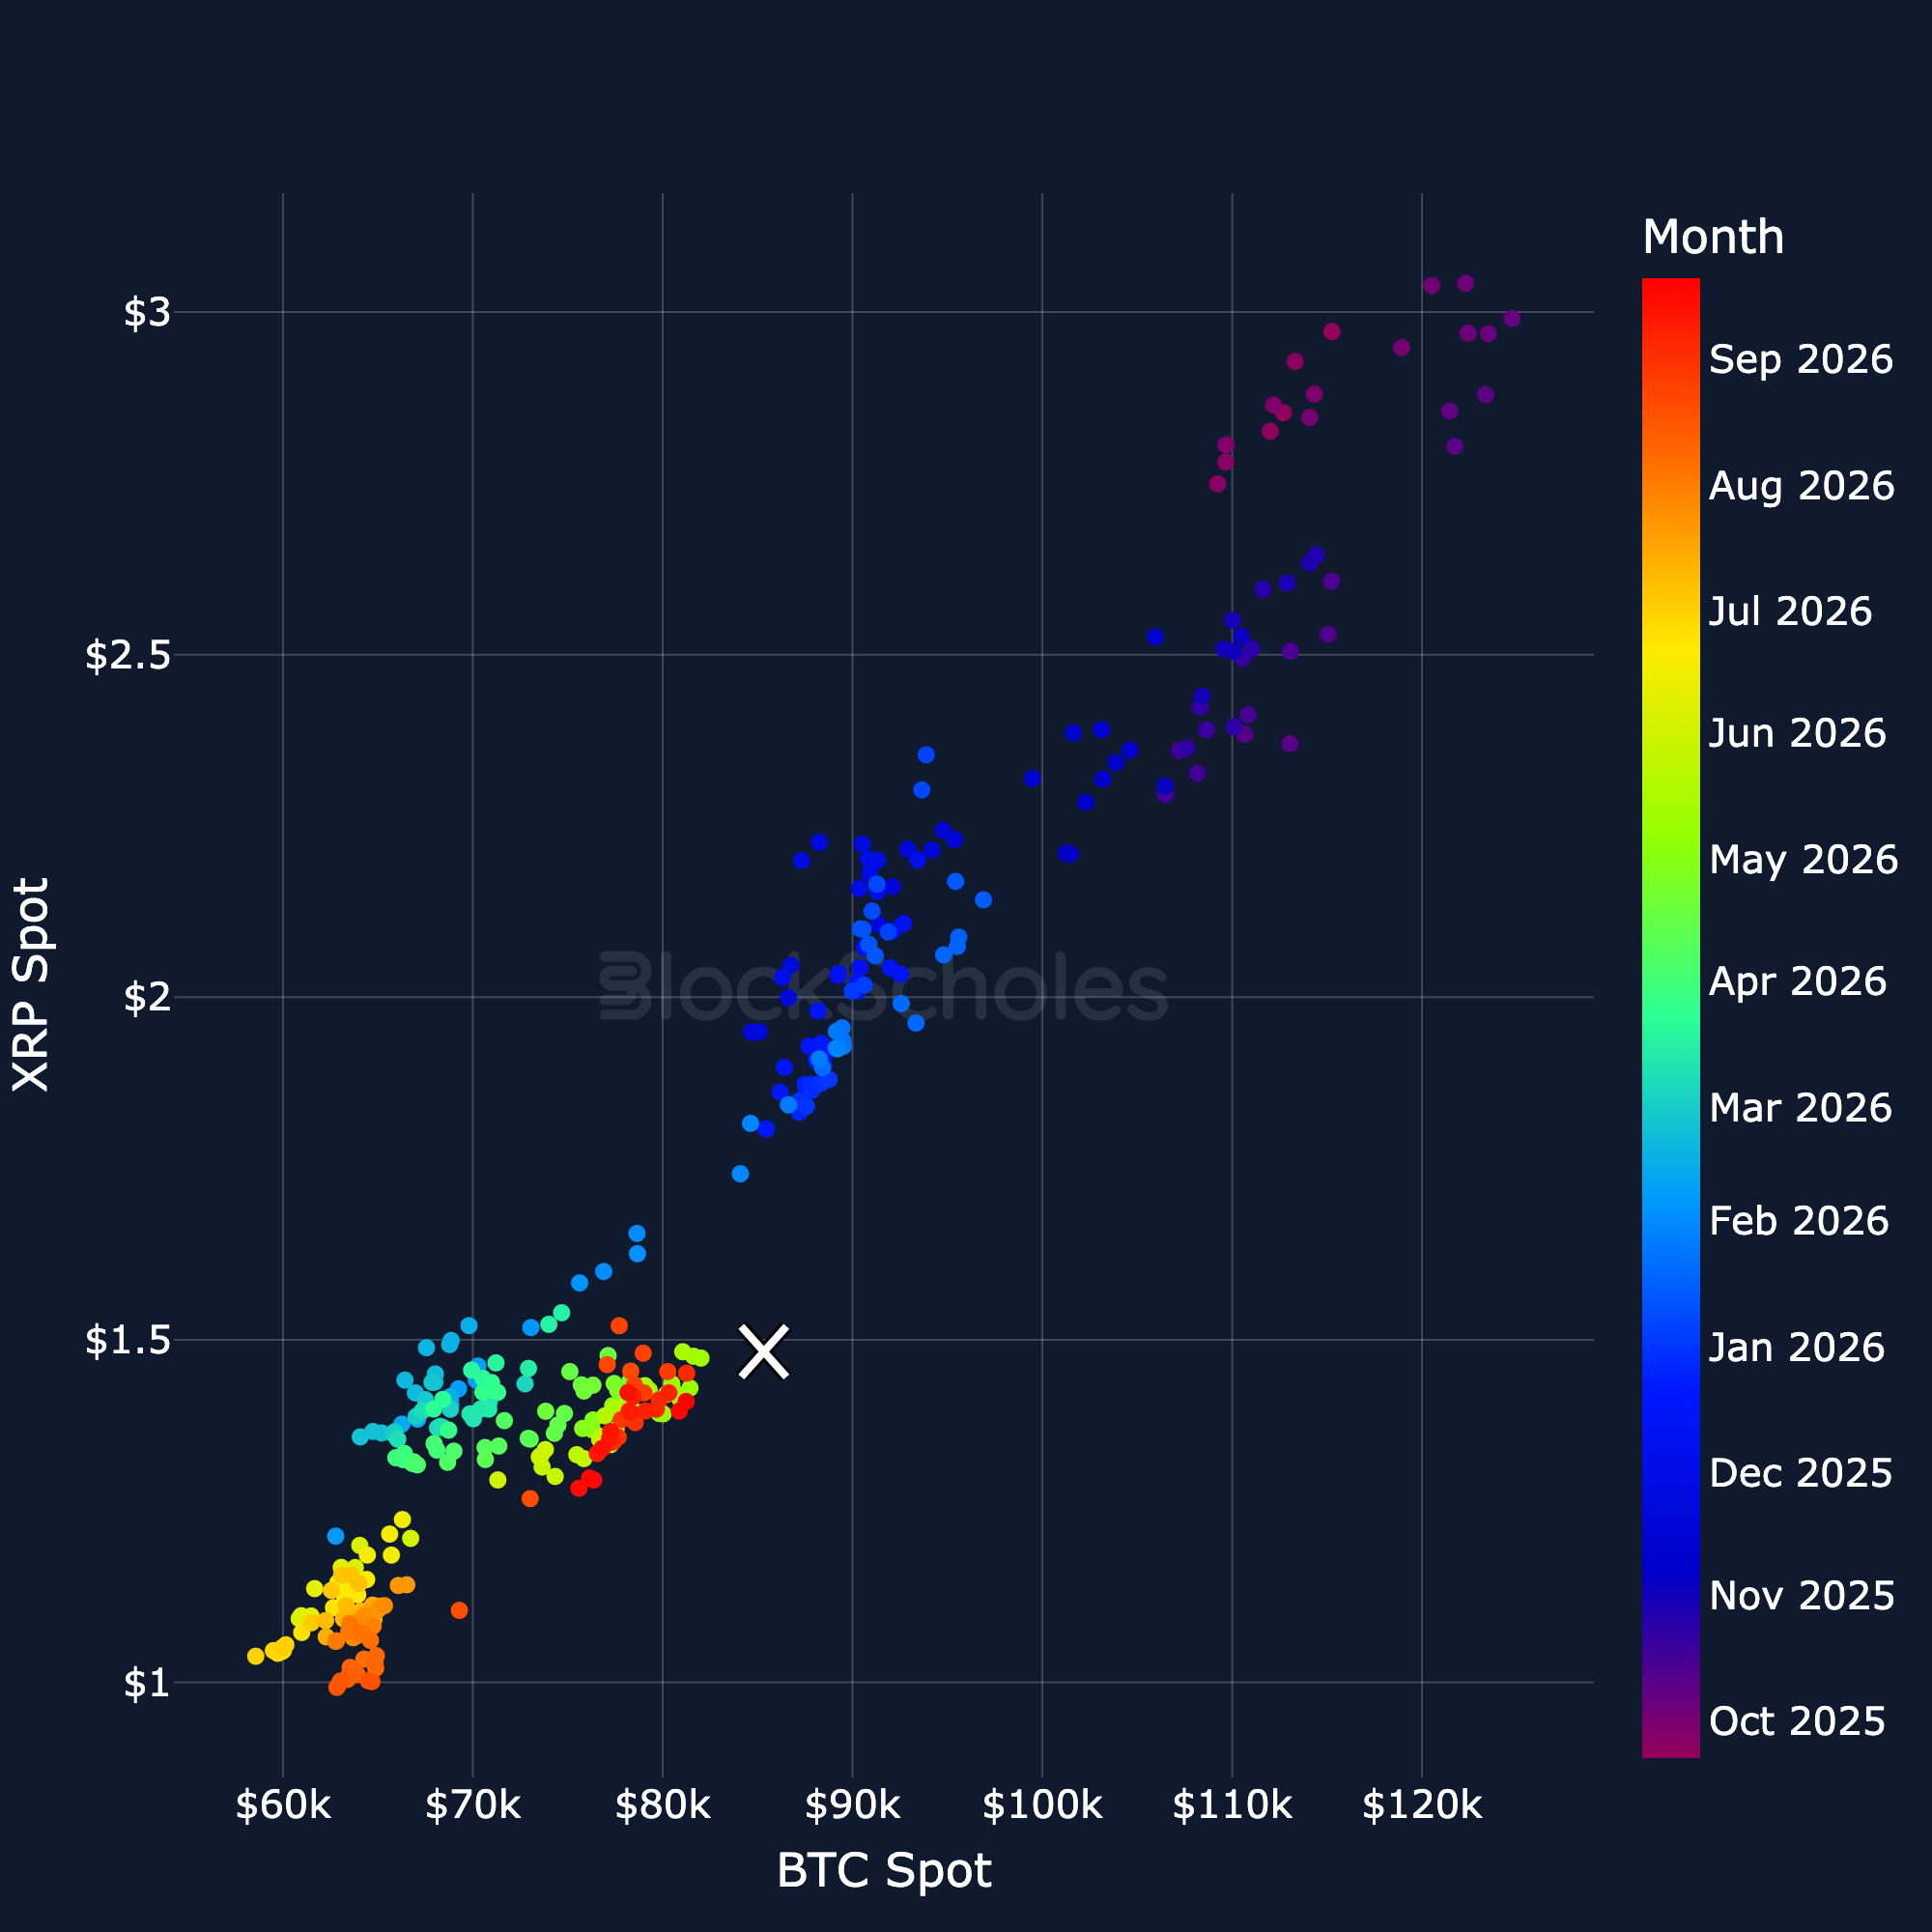
Figure 20. XRP spot price against BTC spot price: daily closes coloured by month, latest day marked with a cross. Source: CoinGecko, Block Scholes.

Figure 20. XRP spot price against BTC spot price: daily closes coloured by month, latest day marked with a cross. Source: CoinGecko, Block Scholes.

BNB Spot vs BTC Spot regression

Figure 21. BNB spot price against BTC spot price: daily closes coloured by month, latest day marked with a cross. Source: CoinGecko, Block Scholes.

Figure 21. BNB spot price against BTC spot price: daily closes coloured by month, latest day marked with a cross. Source: CoinGecko, Block Scholes.

Share this post
Copy URL
https://www.blockscholes.com/premium-research/altcoins-analytics-21st-september-2026

BTC & Altcoin Dominance

BTC Dominance

Figure 1. Bitcoin's market capitalisation as a share of the total crypto market capitalisation. Source: CoinGecko, Block Scholes.

Figure 1. Bitcoin's market capitalisation as a share of the total crypto market capitalisation. Source: CoinGecko, Block Scholes.

Altcoin Dominance

Figure 2. Market capitalisation of altcoins, excluding BTC and stablecoins, as a share of the total crypto market capitalisation. Source: CoinGecko, Block Scholes.

Figure 2. Market capitalisation of altcoins, excluding BTC and stablecoins, as a share of the total crypto market capitalisation. Source: CoinGecko, Block Scholes.

Altcoin Season Gauge (90-day lookback)

Figure 3. Share of the top-50 altcoins (current constituents) whose trailing 90-day return beats BTC's; slow-moving by construction. Source: CoinGecko, Block Scholes.

Figure 3. Share of the top-50 altcoins (current constituents) whose trailing 90-day return beats BTC's; slow-moving by construction. Source: CoinGecko, Block Scholes.

Drawdown from all-time high: BTC + top-20 altcoins by market cap

Figure 4. Percentage drawdown from each asset's all-time high for BTC and the top-20 altcoins by market cap. Source: CoinGecko, Block Scholes.

Figure 4. Percentage drawdown from each asset's all-time high for BTC and the top-20 altcoins by market cap. Source: CoinGecko, Block Scholes.

Altcoins / BTC Spot Crosses

Altcoin spot prices denominated in BTC: ETH

Figure 5. ETH spot price denominated in BTC (the ETH/BTC cross). Source: CoinGecko, Block Scholes.

Figure 5. ETH spot price denominated in BTC (the ETH/BTC cross). Source: CoinGecko, Block Scholes.

Altcoin spot prices denominated in BTC: SOL

Figure 6. SOL spot price denominated in BTC (the SOL/BTC cross). Source: CoinGecko, Block Scholes.

Figure 6. SOL spot price denominated in BTC (the SOL/BTC cross). Source: CoinGecko, Block Scholes.

Altcoin spot prices denominated in BTC: XRP

BTC & Altcoin Dominance

BTC Dominance

Figure 1. Bitcoin's market capitalisation as a share of the total crypto market capitalisation. Source: CoinGecko, Block Scholes.

Figure 1. Bitcoin's market capitalisation as a share of the total crypto market capitalisation. Source: CoinGecko, Block Scholes.

Altcoin Dominance

Figure 2. Market capitalisation of altcoins, excluding BTC and stablecoins, as a share of the total crypto market capitalisation. Source: CoinGecko, Block Scholes.

Figure 2. Market capitalisation of altcoins, excluding BTC and stablecoins, as a share of the total crypto market capitalisation. Source: CoinGecko, Block Scholes.

Altcoin Season Gauge (90-day lookback)

Figure 3. Share of the top-50 altcoins (current constituents) whose trailing 90-day return beats BTC's; slow-moving by construction. Source: CoinGecko, Block Scholes.

Figure 3. Share of the top-50 altcoins (current constituents) whose trailing 90-day return beats BTC's; slow-moving by construction. Source: CoinGecko, Block Scholes.

Drawdown from all-time high: BTC + top-20 altcoins by market cap

Figure 4. Percentage drawdown from each asset's all-time high for BTC and the top-20 altcoins by market cap. Source: CoinGecko, Block Scholes.

Figure 4. Percentage drawdown from each asset's all-time high for BTC and the top-20 altcoins by market cap. Source: CoinGecko, Block Scholes.

Altcoins / BTC Spot Crosses

Altcoin spot prices denominated in BTC: ETH

Figure 5. ETH spot price denominated in BTC (the ETH/BTC cross). Source: CoinGecko, Block Scholes.

Figure 5. ETH spot price denominated in BTC (the ETH/BTC cross). Source: CoinGecko, Block Scholes.

Altcoin spot prices denominated in BTC: SOL

Figure 6. SOL spot price denominated in BTC (the SOL/BTC cross). Source: CoinGecko, Block Scholes.

Figure 6. SOL spot price denominated in BTC (the SOL/BTC cross). Source: CoinGecko, Block Scholes.

Altcoin spot prices denominated in BTC: XRP