Tazmina Rashid
Research Analyst
This week's edition of our Crypto Altcoins Analytics.

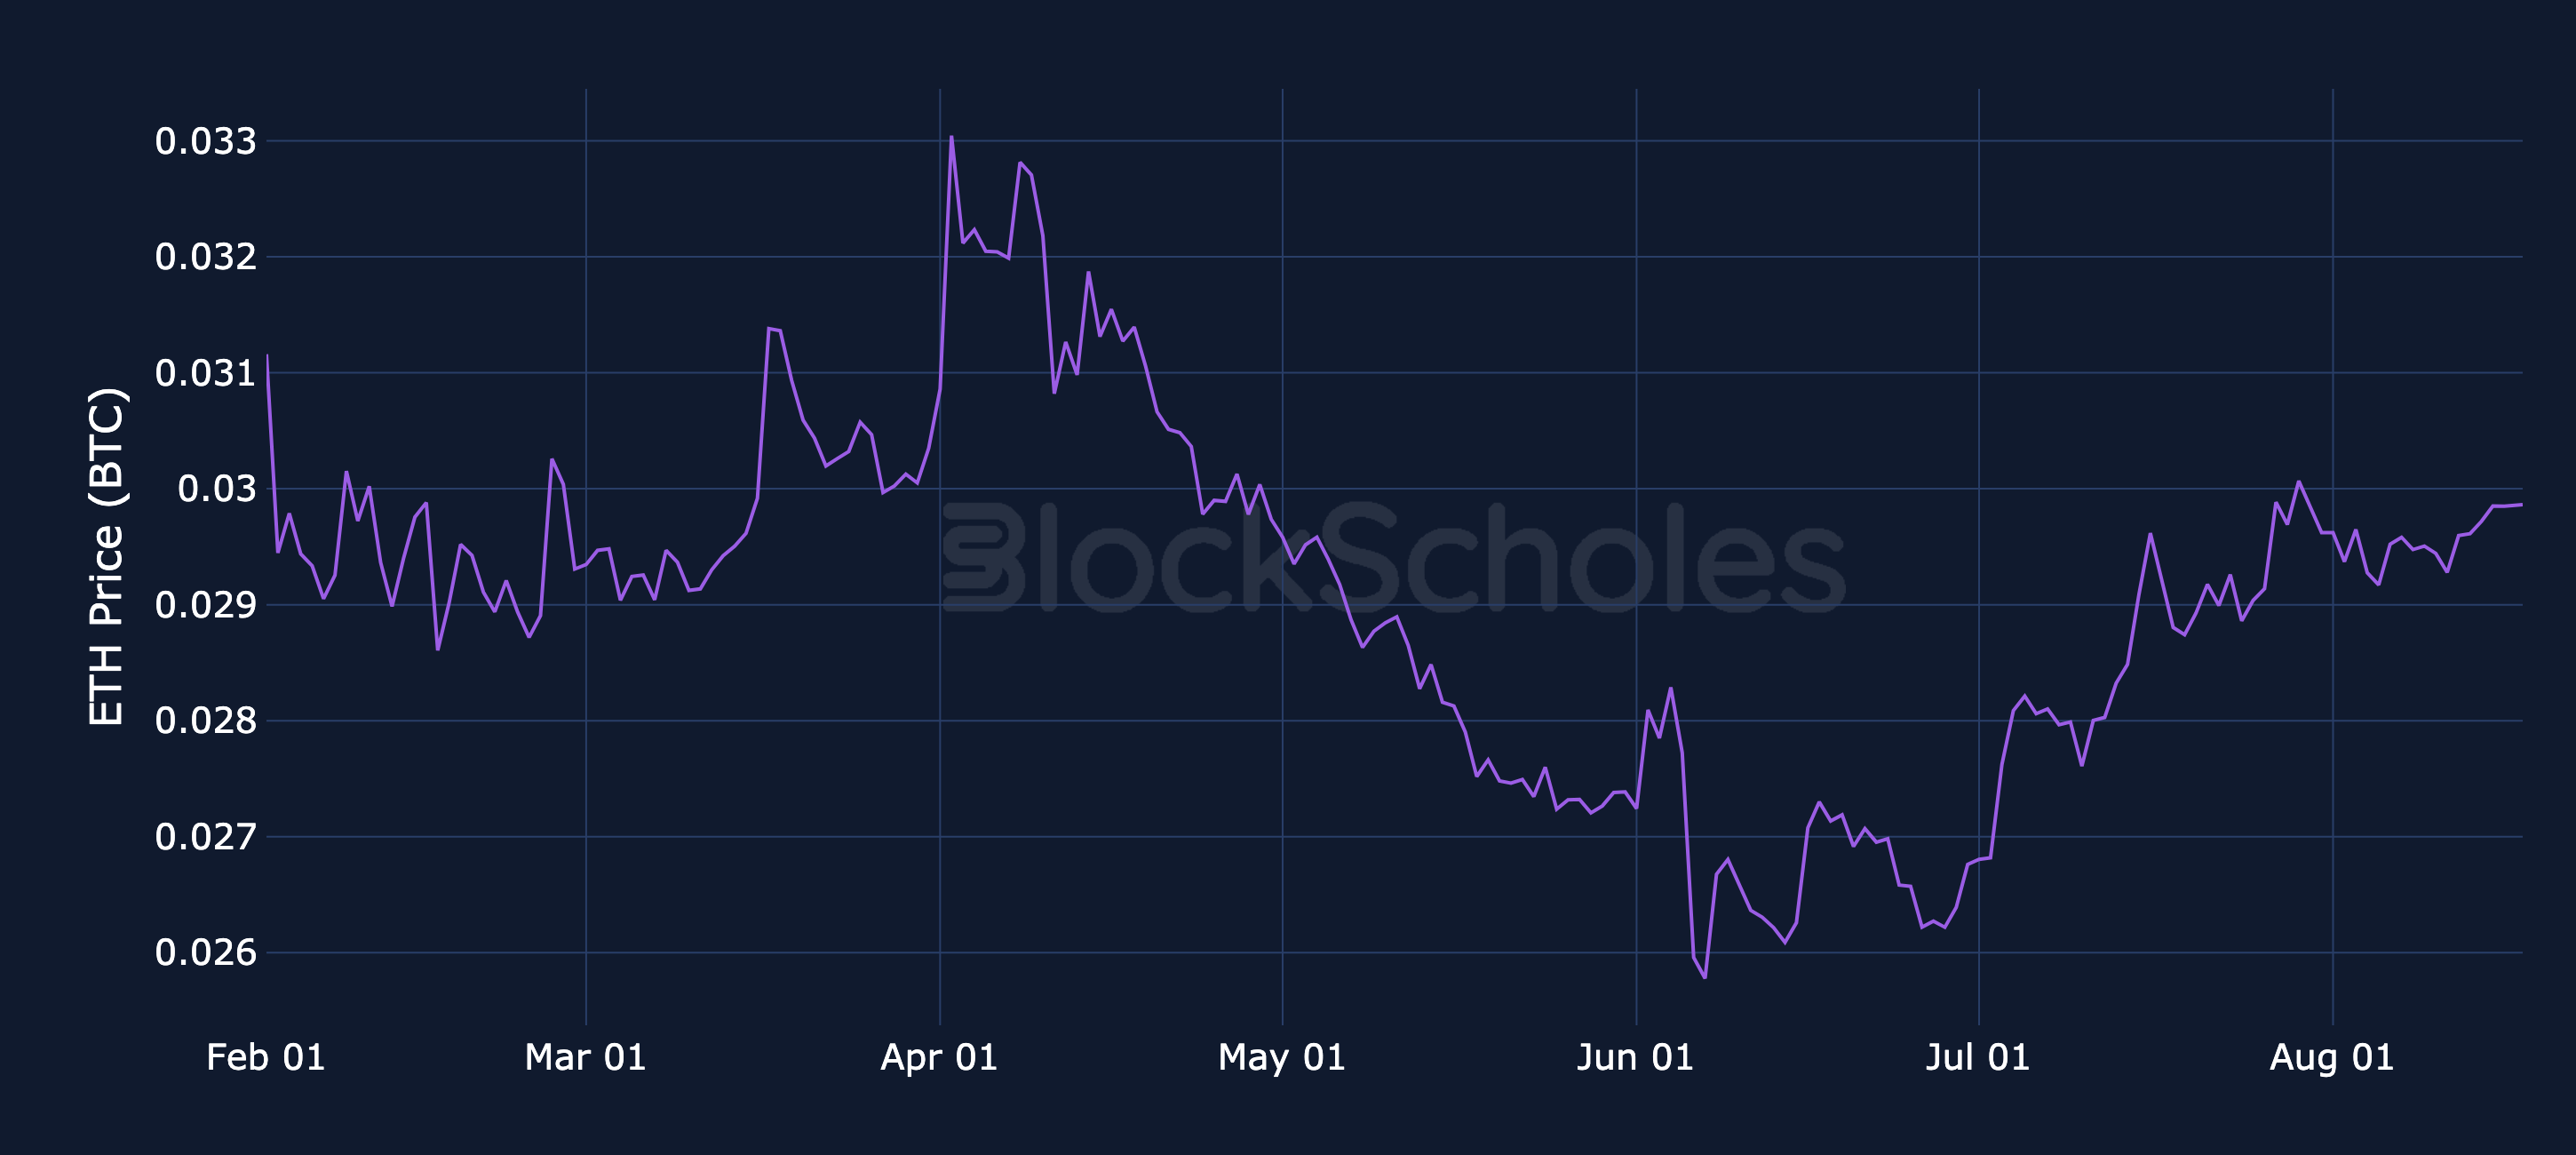
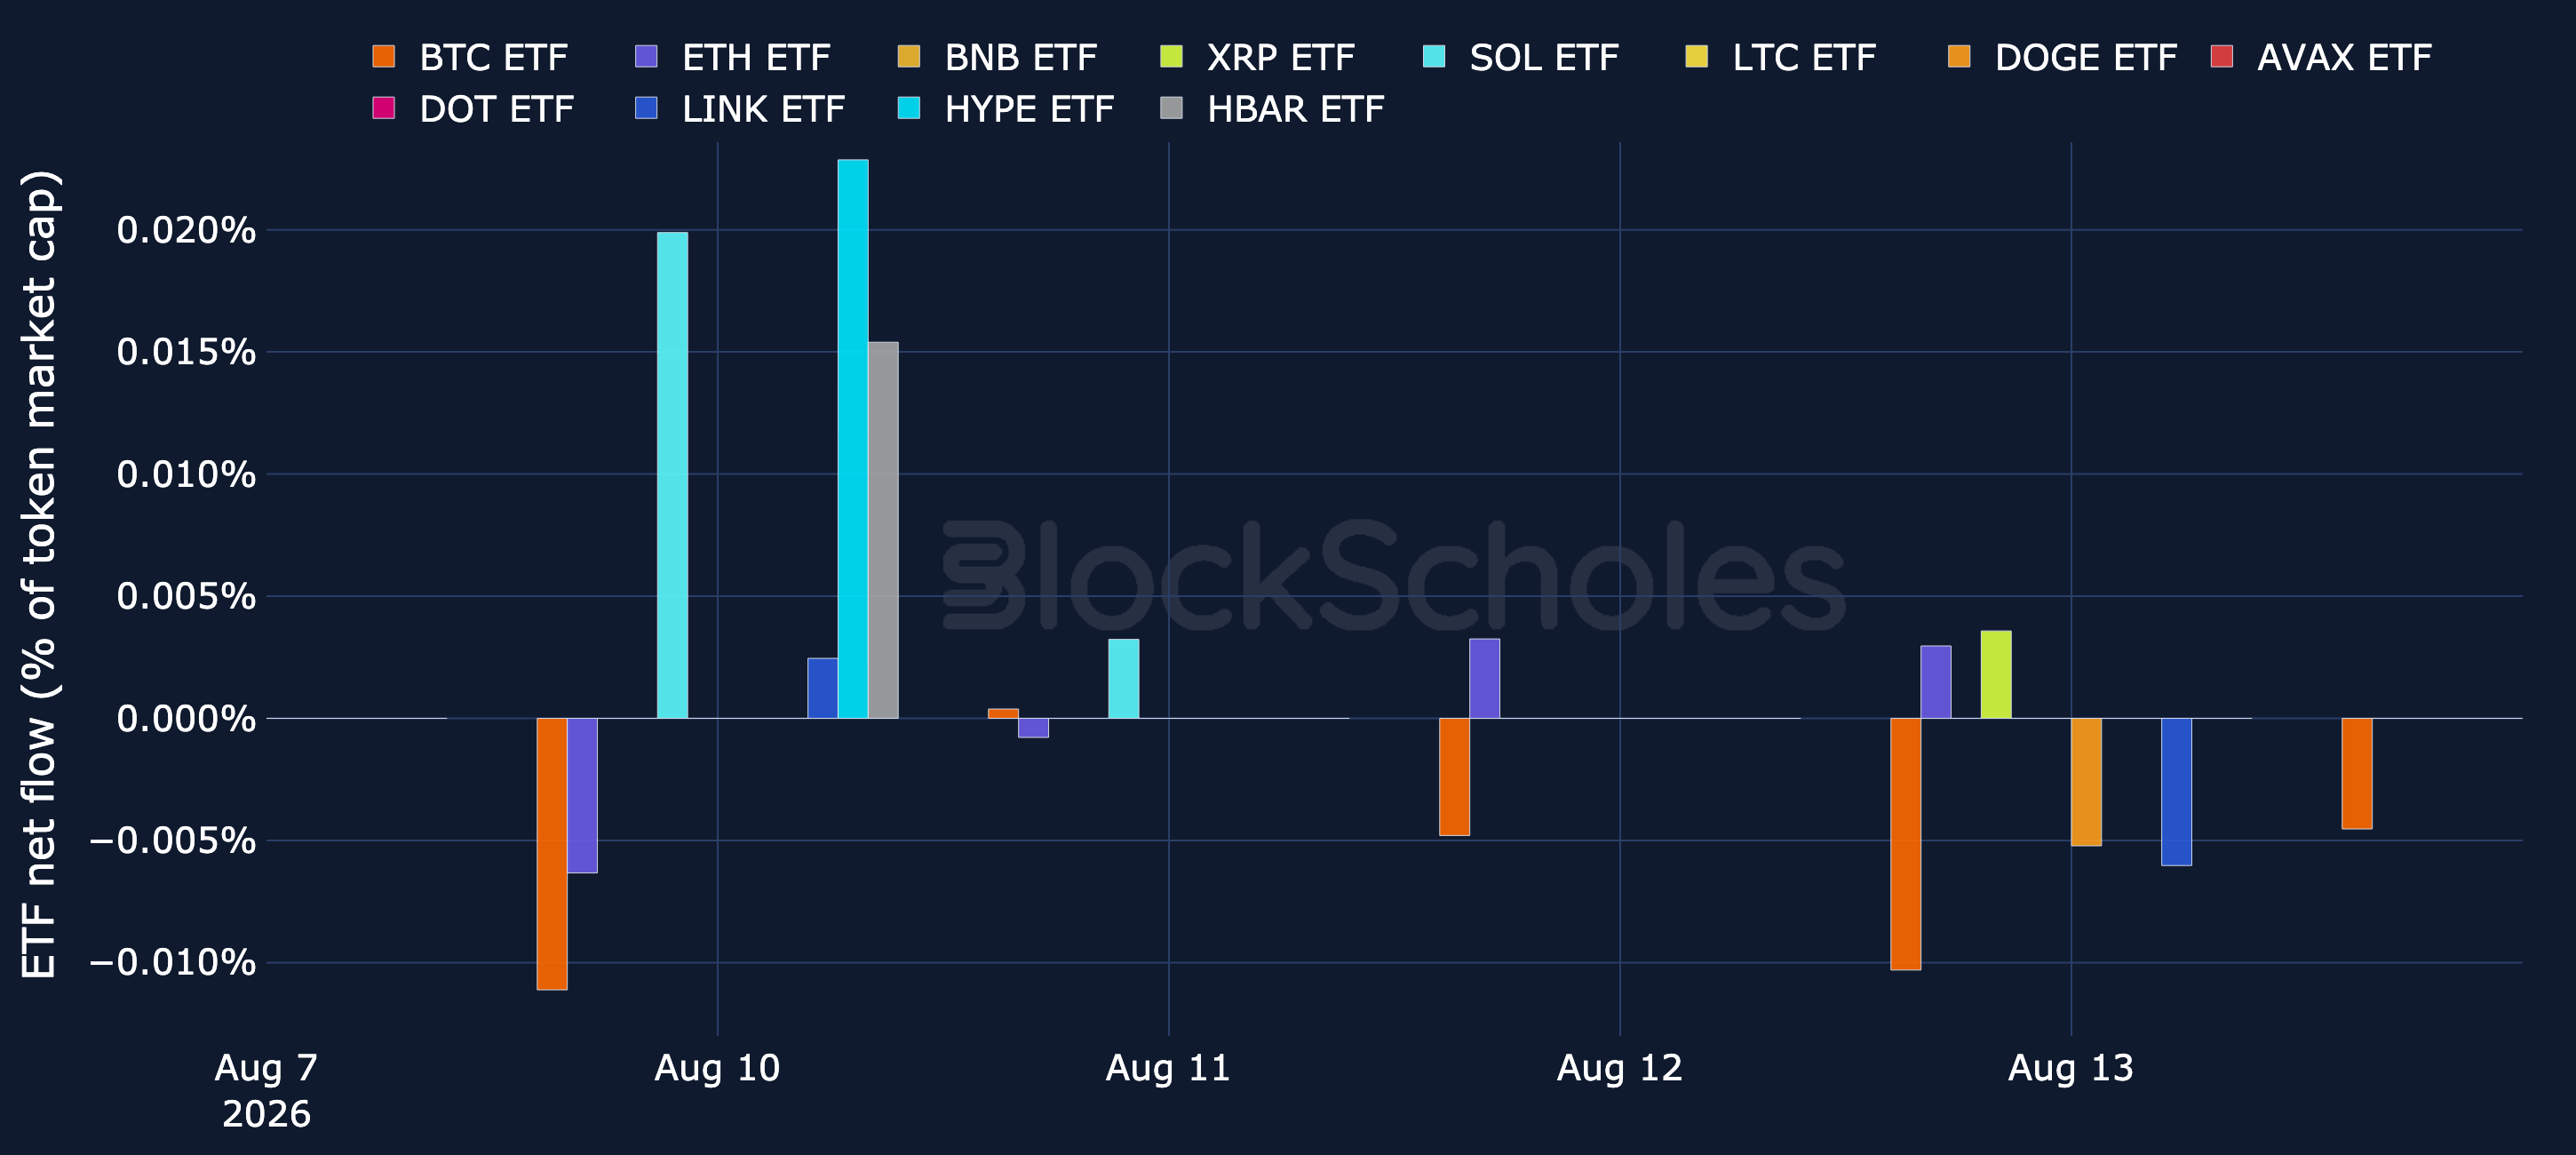
ETF Flows – BTC ETFs remain in a net-outflow regime. In the 69 trading days since cumulative flows peaked on 6th May, spot BTC ETFs have posted net inflows on just 24 of them, shedding a cumulative $7.98B. The past week (10th August–14th August) added $390M of outflows, with 11th August's $4.89M inflow the only positive session. ETH ETFs followed a similar path, shedding $734M over the same stretch, with a further $2.26M of outflows in the past week.
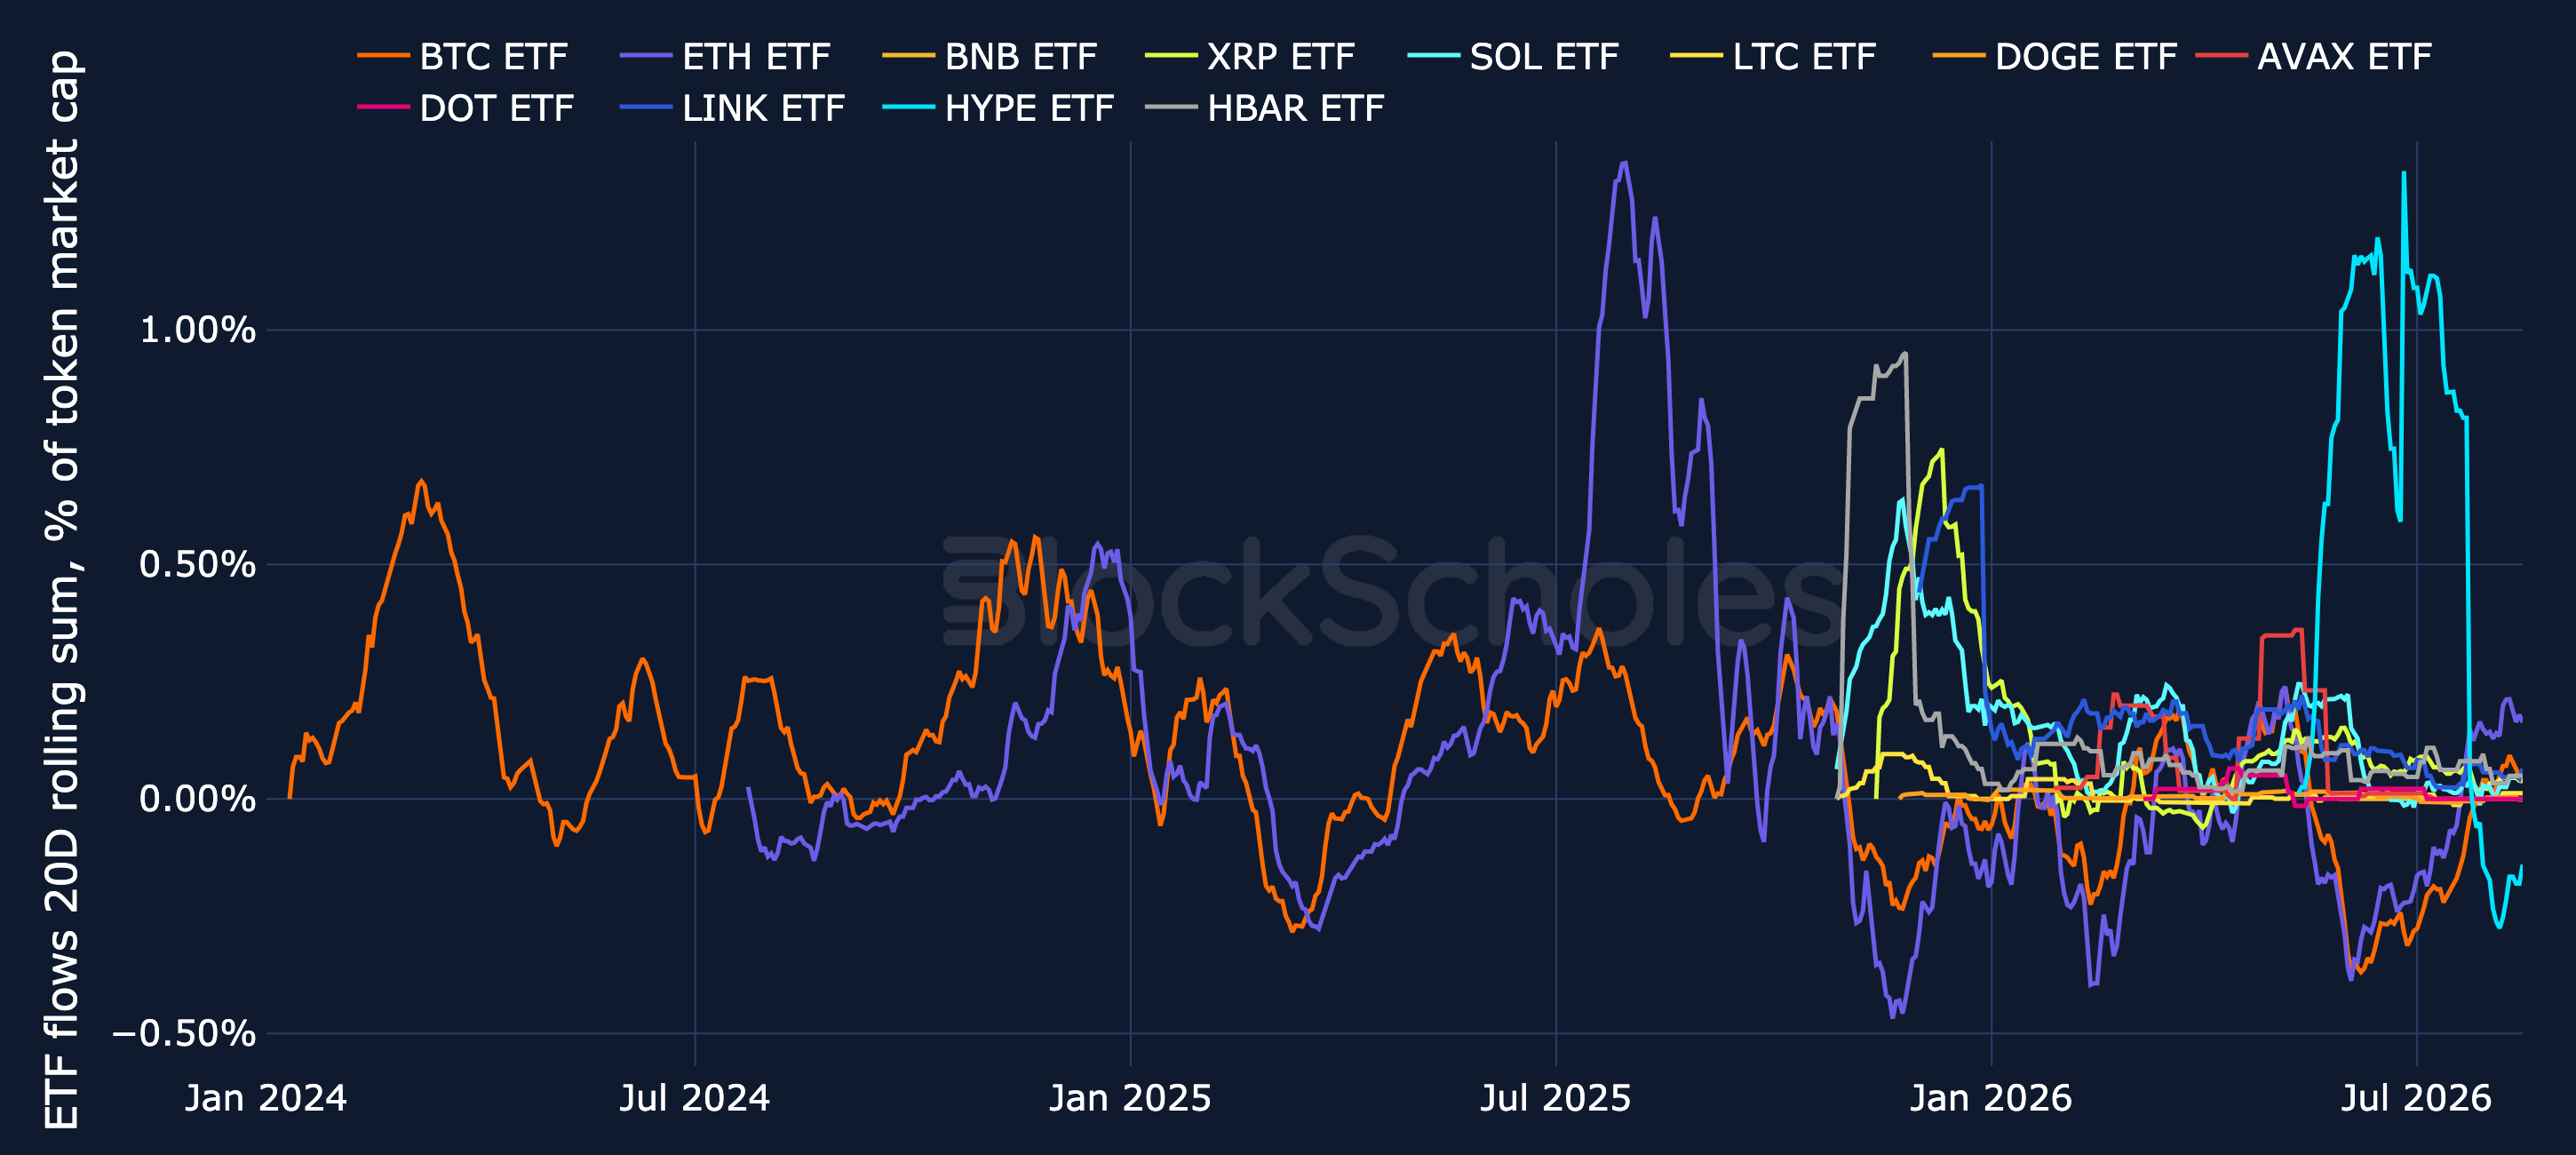
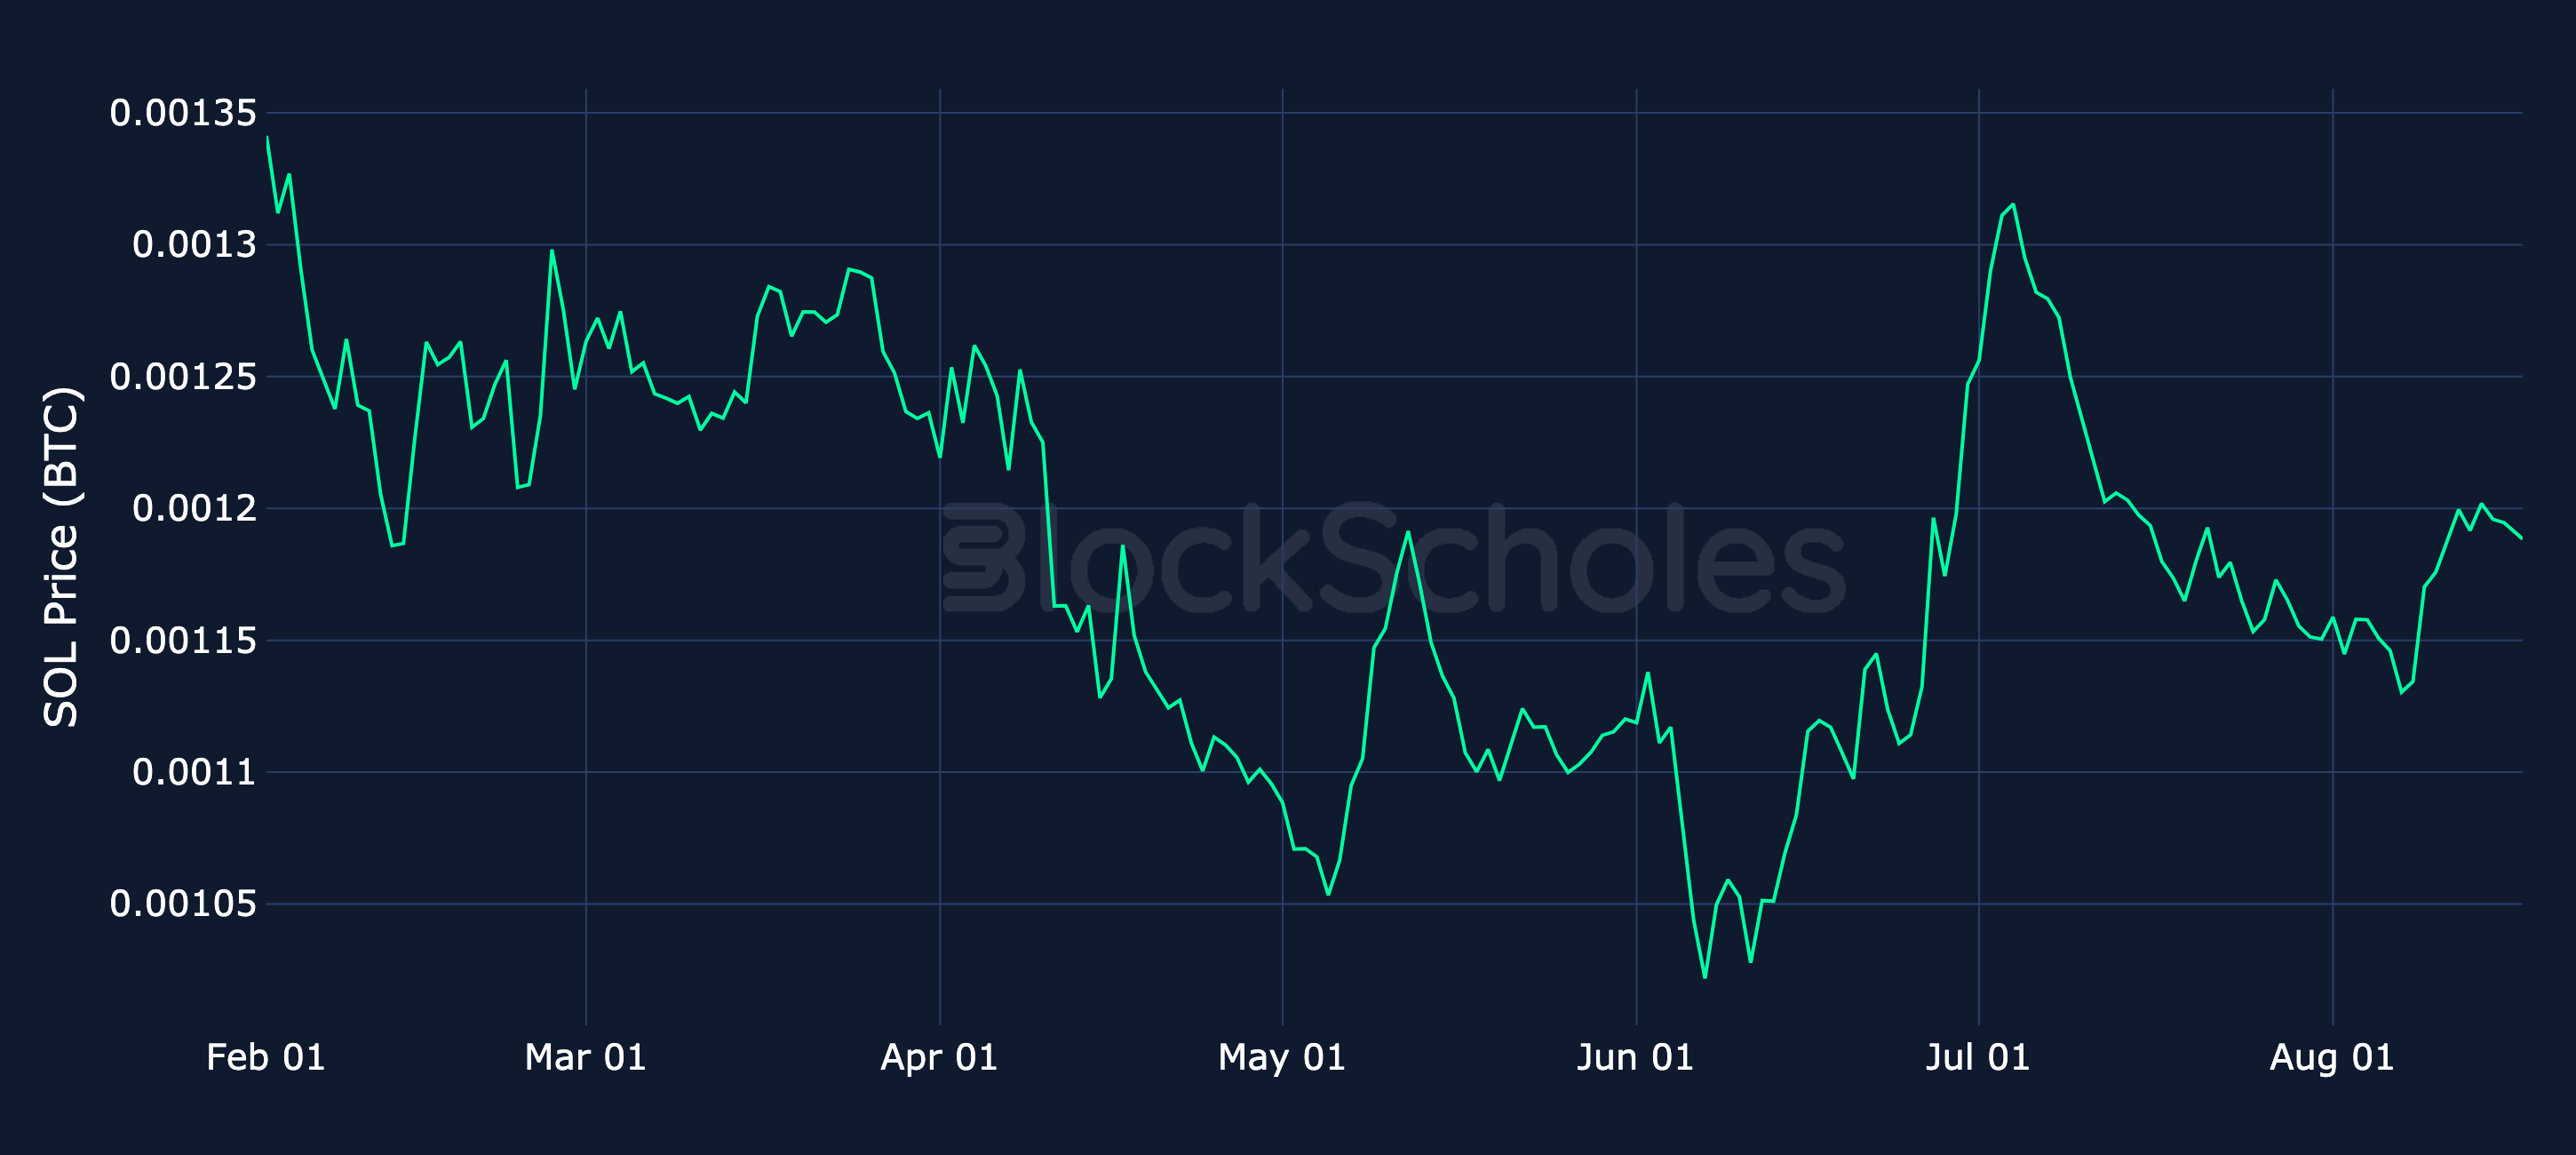
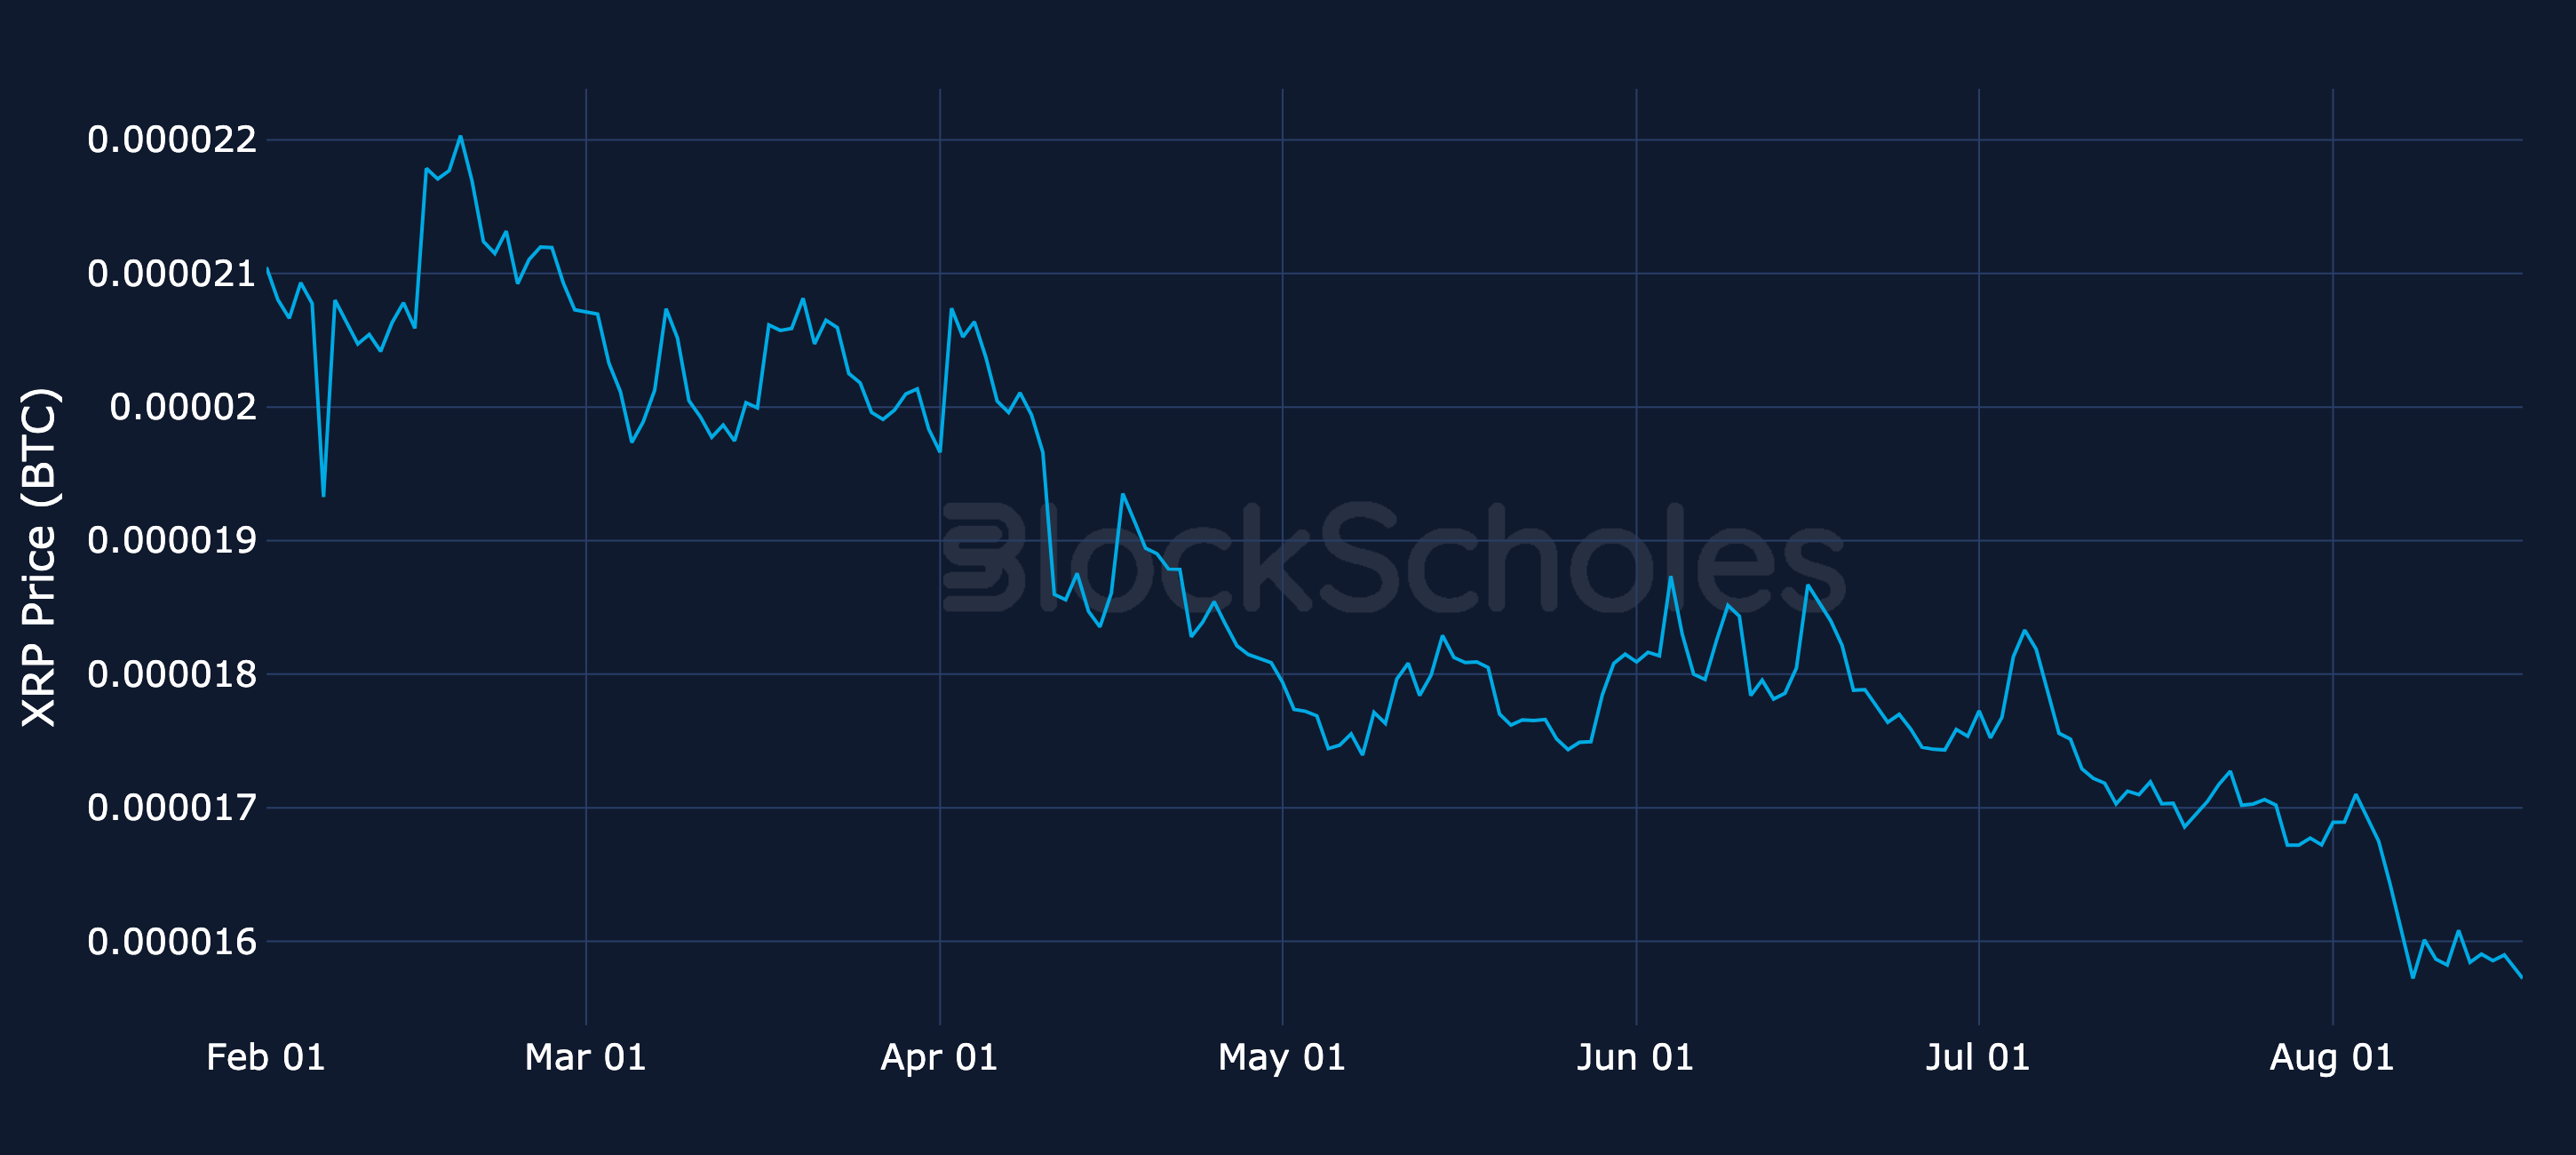
Over the past week, altcoin ETFs showed a more mixed picture. SOL led inflows at $10.3M, followed by HYPE at $2.74M, XRP at $2.25M, LINK at $1.23M, and HBAR at $462K. DOGE recorded a net $565K outflow. DOGE's outflow reflects a fading one-off: a single $345K net inflow on 21st July, which had lifted it to the top of the market-cap-adjusted table in prior weeks, has now rolled out of the 20-day window, leaving recent sessions in modest net redemptions. SOL's flows were entirely inflows rather than outflows over the week, with net inflows on 2 of 5 trading days and no net-outflow sessions, though the daily pace eased from $8.83M on 10th August to $1.43M on 11th August. Any downturn in its 20-day rolling line therefore reflects this slower pace of inflows, and earlier and larger inflows rolling out of the 20-day window, rather than net outflows.
Adjusted for market cap, LINK has the largest 20-day rolling ETF flow, at around 0.06% of token market cap (as of 14th August).