Tazmina Rashid
Research Analyst
This week's edition of our Crypto Altcoins Analytics.



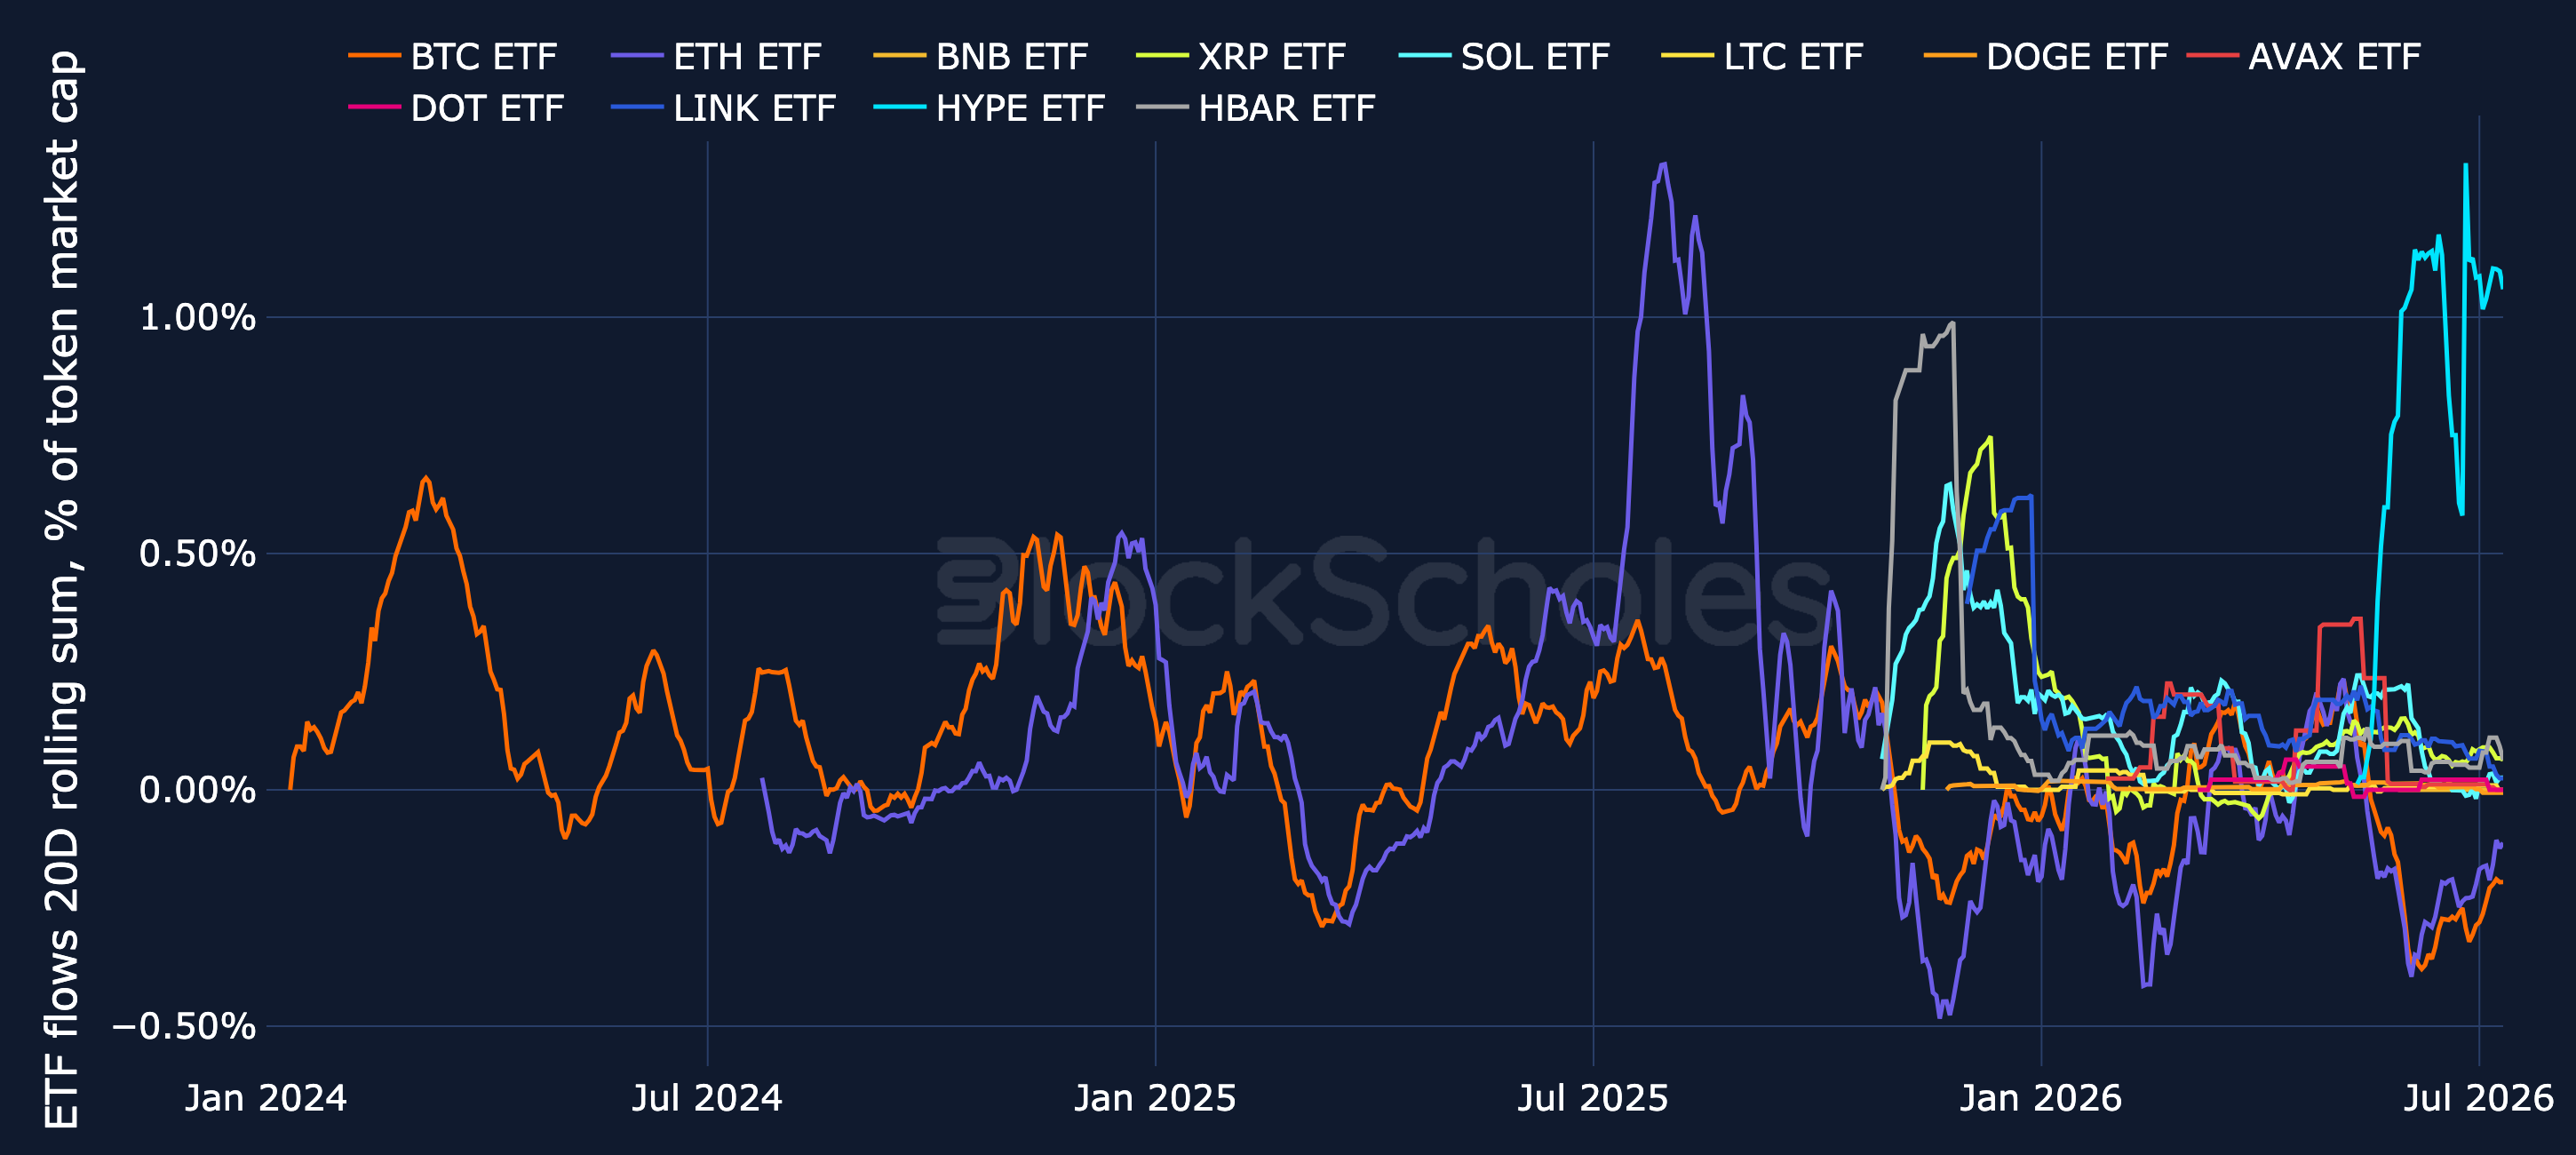
ETF Flows – BTC ETFs remain in a net-outflow regime. Since cumulative flows peaked on 6th May, spot BTC ETFs have posted net inflows on just 9 of 44 trading days, shedding a cumulative $8.49B. The past week (6th July–10th July) added $197M of inflows. ETH products have been comparably soft, with $1.21B of net outflows over the same stretch and $84.4M of inflows in the past week.
Over the past week, altcoin ETFs showed a more mixed picture. HYPE led inflows at $10.4M, followed by HBAR at $1.01M, SOL at $930K, and LINK at $640K. Net outflows came from XRP ($7.18M) and LTC ($430K). HYPE, despite leading inflows, still saw 1 net-outflow session during the week.
HYPE screens highest on a market-cap-adjusted basis, with its 20-day rolling ETF flow (as of 10th July) at around 1.06% of token market cap — but that is a single $108M creation on 25th June (more than the window's other inflows combined), not steady or delayed accumulation; HYPE's 20-day rolling line will fall mechanically once that day rolls out of the 20-day window.