User Guide
Data APIA Guide to Crypto Implied Volatility and Volatility Surfaces
17 Jun 2026
Key Takeaways
- Implied Volatility (IV) is a market-implied expectation of how much an asset price is likely to fluctuate before the contract expires.
- A higher IV implies larger expected dispersion of future prices, which increases the likelihood of extreme outcomes. As option prices are highly sensitive to this dispersion, traders typically quote and compare options in terms of IV, a standardised measure that reflects relative value. For this reason, IV is often interpreted as the “price” of crypto options.
- IV cannot be directly observed, but it can be derived mathematically from inverting a derivatives pricing model such as the Black Scholes model.
- The implied volatility surface is a continuous representation of IVs across three dimensions: moneyness, time to expiry and volatility points. It provides a consistent view of how market prices uncertainty across different option contracts and serves as a key reference system for pricing, hedging and relative value analysis.
- IV has significant use-cases in back-testing trading strategies and calculating margins on an exchange.
Part I: Why Think About Implied Volatility?
A European options contract gives the buyer the right, but not the obligation to buy or sell an asset at a predetermined strike price at expiry. The payoffs are asymmetric: the maximum loss is capped at the market value of the option (known as the premium), whereas the potential gains are in theory unlimited, depending on how far the prices drift away from the strike.
Understanding the factors that matter when pricing options is a crucial step to grasping their market dynamics. Implied volatility (IV) is the central variable to be considered, expressing the market-implied expectation of future price diffusion in the underlying asset.
Options and IV 101
In option markets, IV has become one of the most closely monitored metrics to the extent that it has replaced the spotlight traditionally taken by price. To see why this is the case, imagine a stylized example of 2 stocks trading at $100, with call options struck at $110. The first option A and second option B have an IV of 2%, and 10% respectively. B has a higher IV than A, reflecting a larger expected dispersion of future underlying prices. As a result, the probability of extreme outcomes increases, making B more valuable and expensive than A. This example is reflective of a broader intuition that the price of an option tends to be substantially, though partially, driven by IV. Traders are willing to pay more when the distribution of possible outcomes is wider, as this increases the possibility of more significant moves that can generate larger profits.
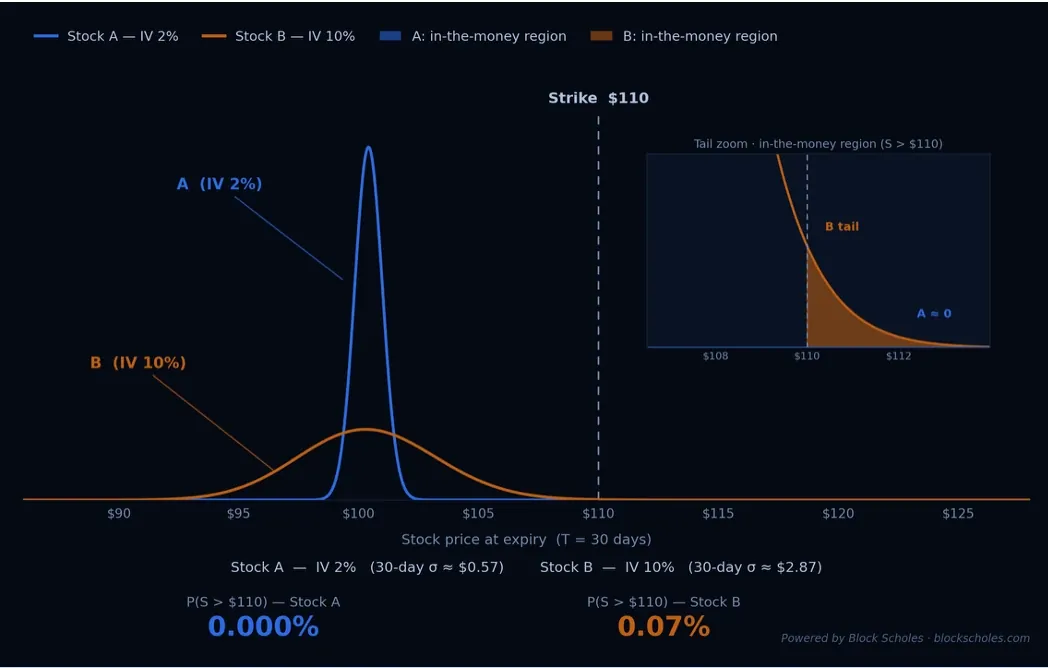
As a rule of thumb, implied volatility, option demand, premium (option price) and the market sentiment tend to be positively correlated. Higher IV typically corresponds to contracts that are more desirable as there is potential for larger profits. In consequence, the premium increases in puts and conveys a bearish market sentiment.
| IV | Demand | Price | Sentiment |
|---|---|---|---|
| ↑ | ↑ | ↑ | Bearish |
| ↓ | ↓ | ↓ | Bullish |
IV as a Quotation Mark
IV is the preferred quotation mark for pricing crypto contracts because it has an intuitive, standardised interpretation that can theoretically strip the noise away. The premium of $100 tells you very little about the desirability of A and B without further information, whereas the 2% and 10% IVs reflect relative value under a unique figure that is comparable across strikes, expiries and different asset classes.
This can be seen in the fact that IV is often the primary variable in trading communication and order book listings on option trading platforms. Options are quoted and traded in IV terms, rather than in premium or dollar terms (“options trades at 60% IV”). When a trader says an option is “cheap” or “expensive”, they typically mean relative to IV, not to its dollar price.
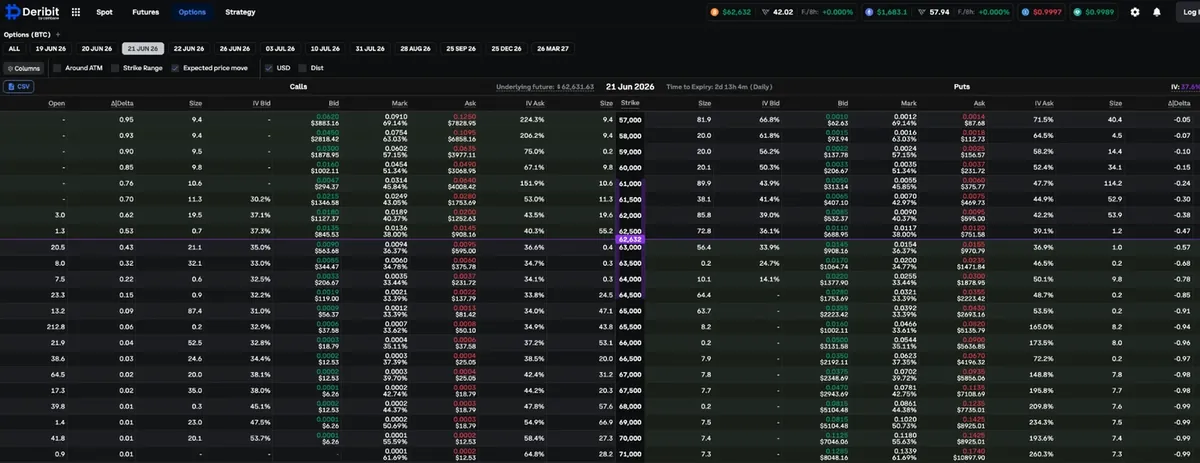
Note: IV is displayed as a key quoting metric