Thahbib Rahman
Research Analyst
In September 2025, Bitget UEX launched equity-linked perpetual futures contracts: USDT-margined perps designed to track traditional US equities. These perps gave crypto traders the opportunity to gain crypto-native synthetic exposure to movements in selected US equities, ETFs and commodities, within the same crypto wallet they used to trade crypto-native assets. Since the September launch, Bitget now offers more than 30 US stock-related perps. In this report we explore the state of liquidity depth for Bitget’s tokenised RWA (real-world assets (RWAs) perps and how Bitget’s UEX platform positions itself as a venue that can support the institutional-grade trading of tokenised perps.

In September 2025, Bitget UEX launched equity-linked perpetual futures contracts: USDT-margined perps designed to track traditional US equities. These perps gave crypto traders the opportunity to gain crypto-native synthetic exposure to movements in selected US equities, ETFs and commodities, within the same crypto wallet they used to trade crypto-native assets. Since the September launch, Bitget now offers more than 30 US stock-related perps.
As part of its TradFi (traditional finance) offering, Bitget then launched precious metal perpetual futures contracts — a supplement to their lineup of stock perps. Together, this provided traders with full access to a universe of equities and commodities that could be: traded 24-7 without being limited by traditional market trading hours, used in hedging against geopolitical volatility and used to speculate on long and short positions with up to 100x leverage.
In this report we explore the state of liquidity depth for Bitget’s tokenised RWA (real-world assets (RWAs) perps and how Bitget’s UEX platform positions itself as a venue that can support the institutional-grade trading of tokenised perps.
We focus on four key RWA perp contracts listed on Bitget: XAU-USDT, SPY-USDT, NVDA-USDT and QQQ-USDT that track Gold, the SPDR S&P 500 ETF Trust, Nvidia stock, and the Invesco QQQ Nasdaq 100 ETF tracker respectively.
Liquidity metrics in this report are calculated using a combination of Bitget public API snapshots and historical order book data provided by Bitget. Bid-ask spread is calculated as the difference between the best ask and best bid divided by the mid price, expressed in basis points. Order book depth is measured as visible resting notional within specified percentage bands around the mid price. Slippage is modelled by walking the visible order book for market orders of specified notional sizes.
Unless otherwise stated, slippage estimates exclude trading fees, funding payments, hidden liquidity, order book replenishment, cancellations and execution algorithms. Depth figures refer to visible resting liquidity and should be interpreted as point-in-time or sample-period estimates rather than guaranteed executable liquidity.
What is liquidity and how do we measure it?
Liquidity is defined as the ease with which an asset can be traded (bought or sold) without exerting a material effect on its price. Markets have optimal liquidity when there are myriad buyers and sellers ready to transact at price levels close to the current market rate. This results in a ‘deep’ order book, where orders across many different price levels can be filled without moving prices substantially.
Retail traders and institutions alike have many reasons to seek high liquidity in the assets they wish to trade. Institutions require confidence that the market can absorb large trades without big moves in price and require consistent liquidity to carry out different trade strategies. Additionally, highly liquid markets are more resistant to manipulative trades and ensure competitive execution costs, which matters to both retail and institutional participants.
We assess liquidity through a number of complementary lenses, including:
We begin with a live snapshot of the order book's depth (taken on 13:33 UTC on 18 May, 2026, just as the US market opened), then compare snapshots across time to examine spread and slippage, for four of Bitget’s headline RWA perps: NVDA, SPY, QQQ and gold.
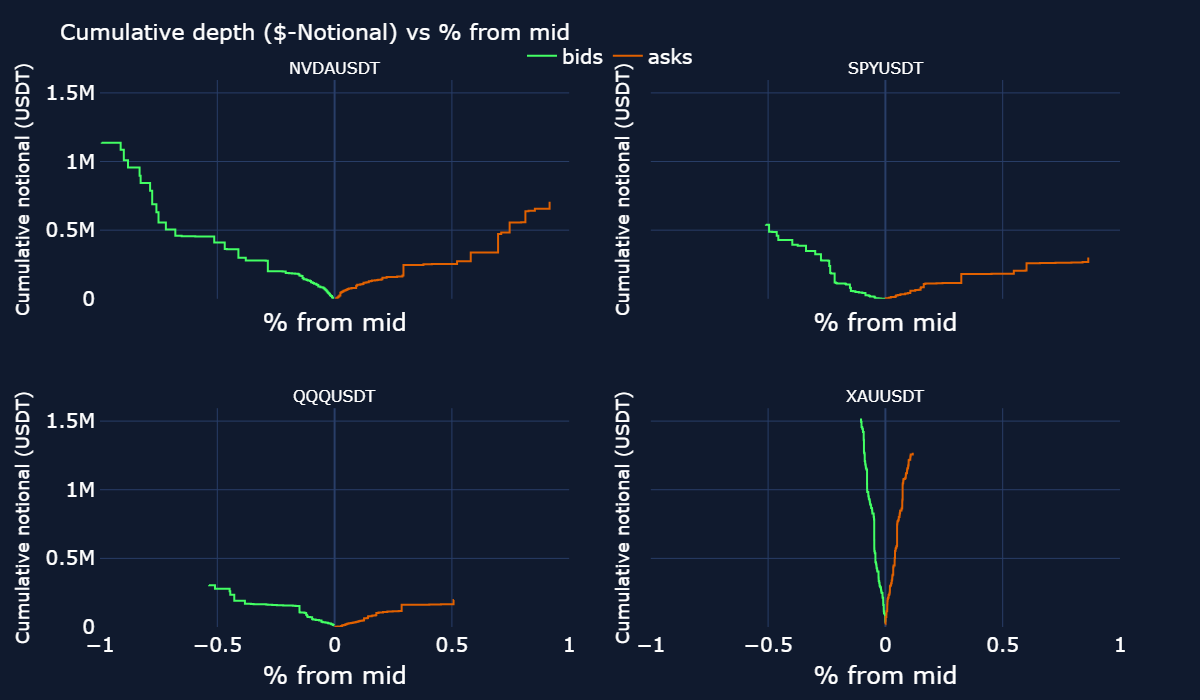
At any instant in time, each perp has a stack of resting limit orders: bids (traders willing to buy at prices below mid) and asks (traders willing to sell at prices above mid). The bid-ask spread is the gap between the two, and the mid is the midpoint between the best bid and best ask price.
The x-axis in the figure above reflects different price levels (rebased as their percentage distance away from the mid price), and the y-axis is measured as cumulative dollar notional available at that price level or better. For example, a $0.5M cumulative notional at -0.5% from the mid for NVDA-USDT means that a trader can sell a total of $0.5M units of the NVDA-USDT perp at bid prices within half a percent below the mid price total $0.5M. The implication is that a market sell order of $0.5M would push NVDA's price down by 0.5% after hitting those bids.
Thus, the steepness of the curve is a direct measure of liquidity — the steeper and taller the curve is at a price level close to 0, the deeper the order book. From the snapshot taken on 13:33 UTC on 18 May, 2026 above, gold perps are the most liquid of the four assets: a single-sell order of $1.5M would only push the perp price down by 0.1% by moving through the available bid liquidity.
We can compare snapshots of the order book at different times to further explore the bid-ask spread, as well as slippage.
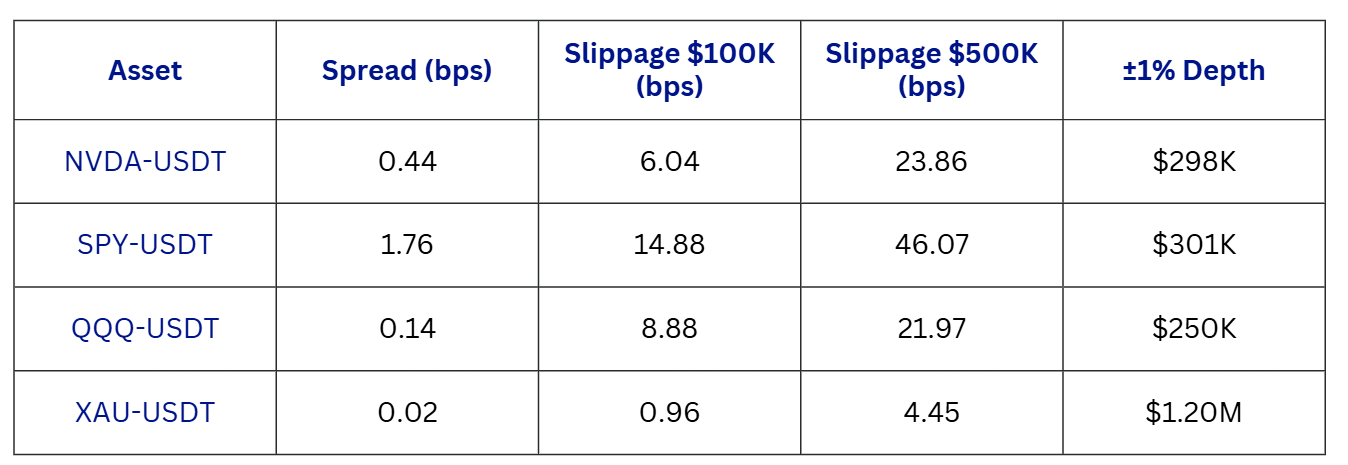
Order-book snapshot: 2026-05-18 13:33 UTC (≈3 min into the US equity session)
Order-book snapshot: 2026-05-18 14:21 UTC (≈1h into the US equity session)
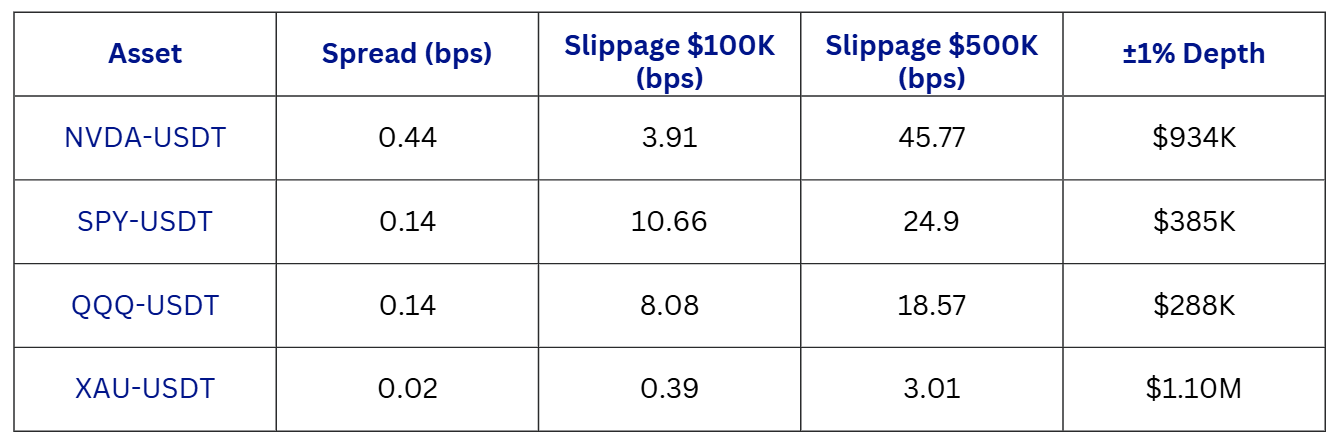
The two tables above capture the same four order books roughly an hour apart from each other on 18 May 2026: the first at 13:33 UTC, three minutes into the US equity market’s trading and the second at 14:21 UTC, close to an hour into the TradFi equity session.
At the open, SPY-USDT quoted a relatively wide spread of 1.76 bps; within the hour this tightened significantly to 0.14 bps. NVDA-USDT maintained a 0.44 bps bid-ask spread across the snapshots and the spread on gold perps was the narrowest (0.02 bps).
Slippage extends this picture from the spread between the best bid or ask to orders of larger size. Here we measure it as the volume-weighted cost of executing a market order of a given notional. Slippage occurs when a trader places a trade that is executed at a worse price than expected (i.e. buying higher or selling lower). This happens when there aren’t enough resting orders on the book at the best market price level and thus, the rest of their order must be filled by liquidity sitting on a less favourable price for the trader.
For SPY-USDT, a $100,000 market buy order cost 14.88 bps of slippage at the market open but only 10.66 bps once the market had settled; while a $500,000 buy order improved even more sharply, from 46.07 bps to 24.90 bps. Equivalently, a $500,000 buy order on gold perps moves price by just 4.45 bps at the open of US equity trading hours and 3.01 bps in the second snapshot.
Naturally, single snapshots of the order book can be noisy. Additionally, they don’t confirm the consistency of available liquidity over time — a property quintessential for institutions trading with size. To analyse this, we can look at market depth over time. The figure below plots, for each tracked Bitget equity perp since January 2026, the resting dollar notional within 1% of the mid price, averaged across the bid and ask sides.
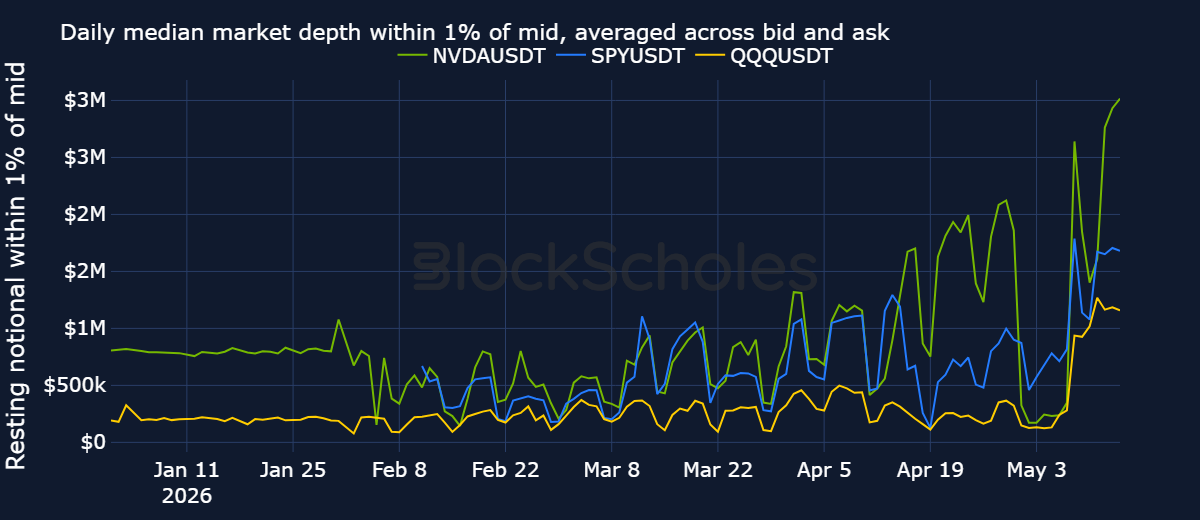
Two features stand out: market depth on Bitget equity perps has structurally deepened over time, particularly since late April, with NVDA perps consistently carrying the deepest book among the tracked equity perps. According to data from Bitget, on May 14, 2026 the daily median resting depth within 2% of the mid price for NVDA — averaged across the bid and ask sides — was $4.1M. For comparison, a CoinGecko snapshot of Bitget's BTC/USDT spot market on May 21, 2026 put the equivalent ±2% depth at $5.5M (averaging the +2% and −2% sides), leaving NVDA's equity perp at roughly three-quarters of the depth of Bitget's most-liquid spot crypto market.
Secondly, and as discussed in the subsequent section, there is a clear weekend bias where depth visibly drops off outside of traditional market hours.
We can take our liquidity analysis further by understanding how liquidity metrics vary depending on the hour of day. The first noticeable trend is a clear weekend liquidity bias. Despite trading 24-7, real-world asset perps still remain highly tethered to the trading hours of their TradFi counterpart.
The chart plots the rolling 24-hour traded volume across Bitget’s gold perp contract. The shaded grey bands represent weekends (in UTC) — when traditional markets are closed. While some weekends in 2026 have seen a higher concentration of geopolitical events relative to the weekdays, in general we find that 24-hour volumes plummet over most weekends.
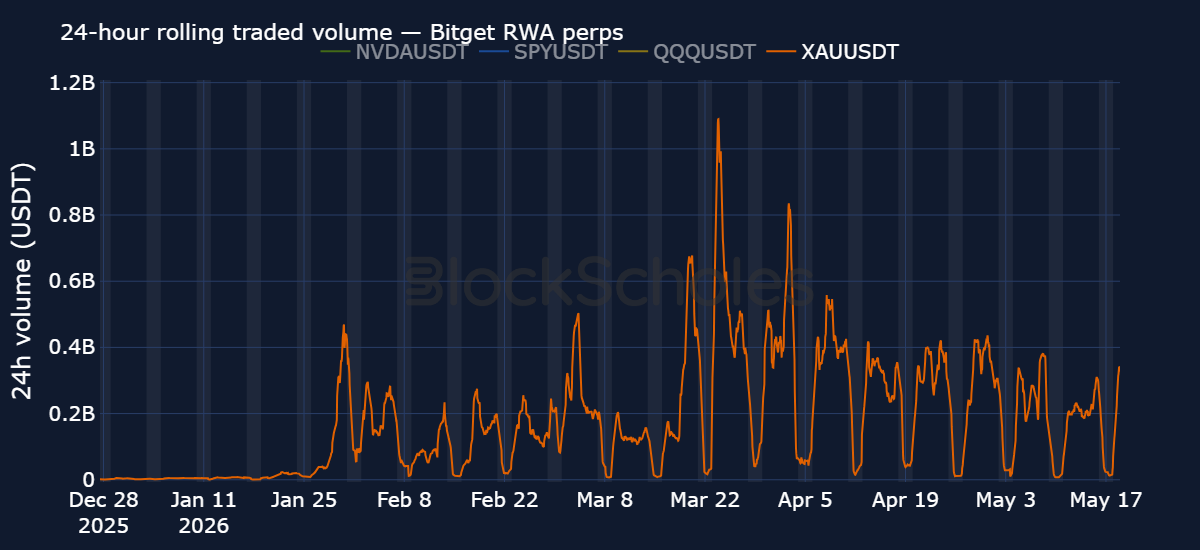
In fact, when we measure weekend volume as a ratio to weekend hours and compare the same metric for the weekday, volumes on the weekend for Bitget's RWA perps collapse by ~65–90% versus weekday levels (NVDA-USDT, −88%, QQQ-USDT −87%, XAU-USDT −69%, SPY-USDT −67%). This ratio is used versus a median or mean of total volume across weekends and weekdays due to the handful of weekend volume spikes driven by macro events that we cover in Section 3.
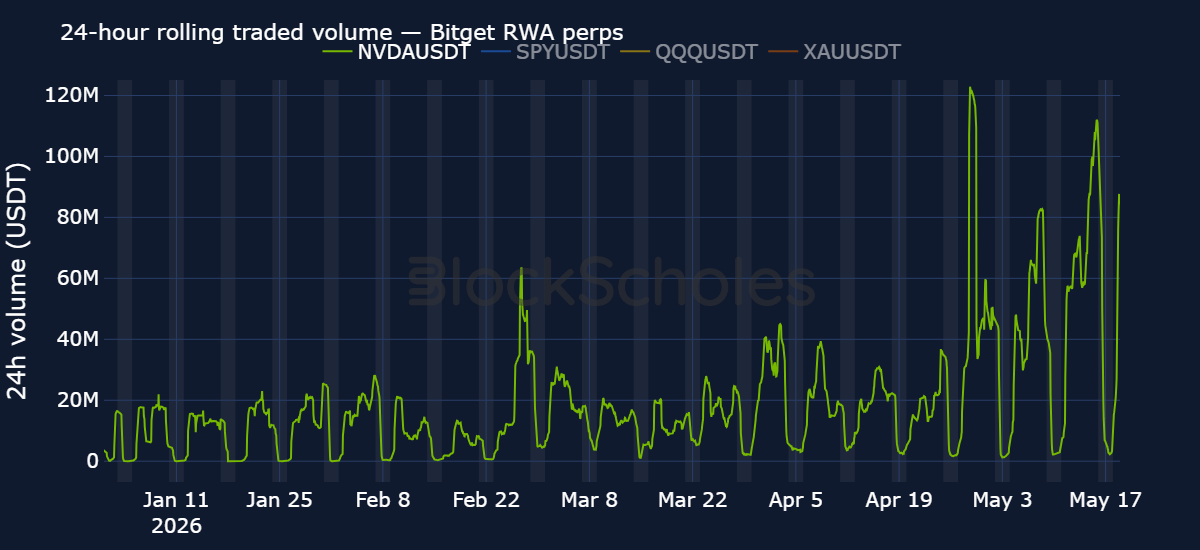
This phenomenon is not just apparent in gold perps either. Below is the equivalent 24-hour rolling volume for NVDA perps.
Despite that sharp drop in weekend volume, there is evidence to suggest that bid-ask spreads across the assets are surprisingly resilient even outside of market hours and even when liquidity thins out.
In the chart below we plot the median bid-ask spread observation at each hour of the week over our sample period of September 2025 to May 2026. The shaded band here represents US equity trading hours (09:30–16:00 ET).
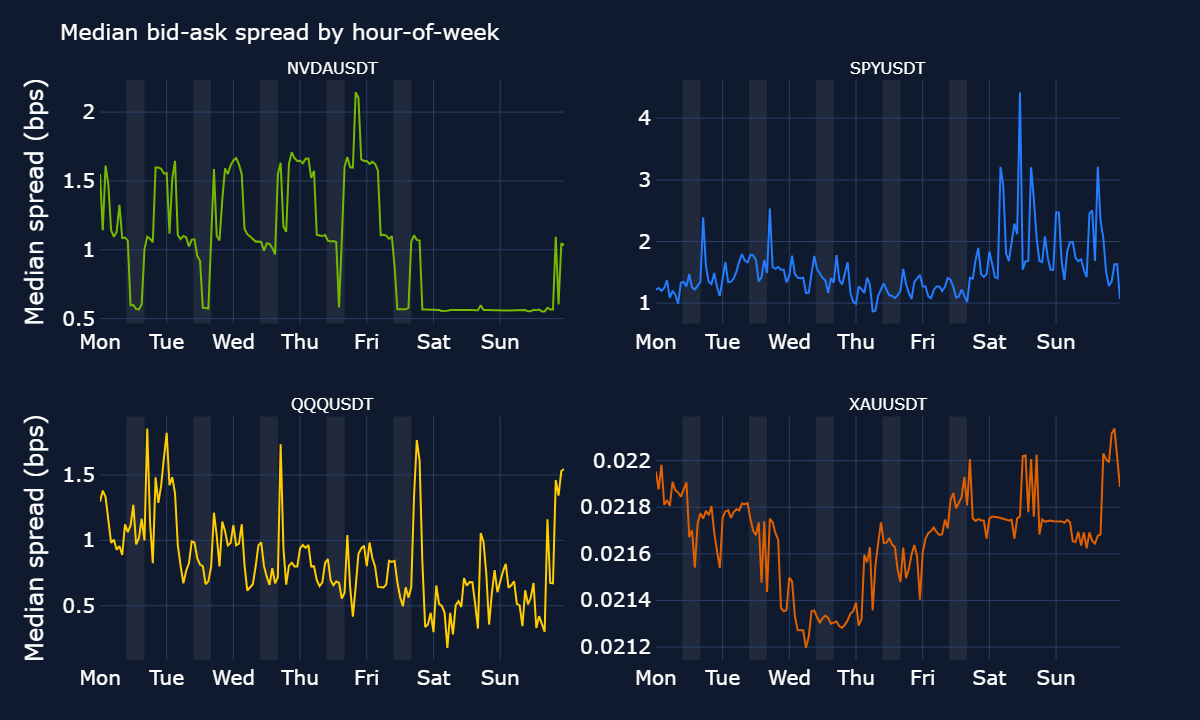
Across the entire week, the typical spread sits at roughly 0.02 bps for gold, 0.8 bps for QQQ, 1.0 bps for NVDA and 1.3 bps for SPY, regardless of the hour. Put against the 65–90% collapse in volume, it shows that even during weekends and overnight thinner liquidity, top-of-book spreads don’t get materially wider — the median trade still crosses the book for about a basis point.
There is nonetheless a mild session effect. For the index perps (SPY and QQQ), the spread is marginally tighter and steadier during US hours. SPY median spread is around 1.3 bps during the US TradFi session versus 1.8 bps at the weekend — perhaps a reflection of market-makers being less able to hedge on-chain positions outside of Nasdaq and CME opening times.
But the magnitude is small: even SPY's worst typical hour of the week is still under 2 bps, and for NVDA and QQQ the weekend median is actually no wider than the weekday. Additionally, the median bid-ask spread for gold is effectively flat at 0.02 bps every hour of every day.
Bitget recently extended its stablecoin infrastructure with USDGO, a USD-backed stablecoin reserved against GENIUS Act-compliant short-duration US Treasury bills, and GO Uncapped, an initiative that pays up to 4.3% APR on USDGO balances held in spot or futures accounts. This adds an additional layer to the UEX wallet initiative — traders can earn yield on idle capital.
This means that within a single UEX wallet, a trader can easily switch between stablecoin holdings to BTC hedges to gold-perp positions or speculative positions on a single-name US equity depending on different market regimes.
Our previous report highlighted one such (ongoing) market regime: geopolitical-driven volatility. In that report we explored how traders were able to hedge against macro volatility using Bitget’s selection of RWA perp and equity offerings. It naturally follows to explore how liquidity held up during periods of acute market stress.
We focus on a geopolitical event which is continuing to be the premier driver of crypto spot action to present: the Feb 28, 2026 announcement that the US had launched pre-emptive strikes against Iran, opening a conflict that has lasted for nearly 3 months.
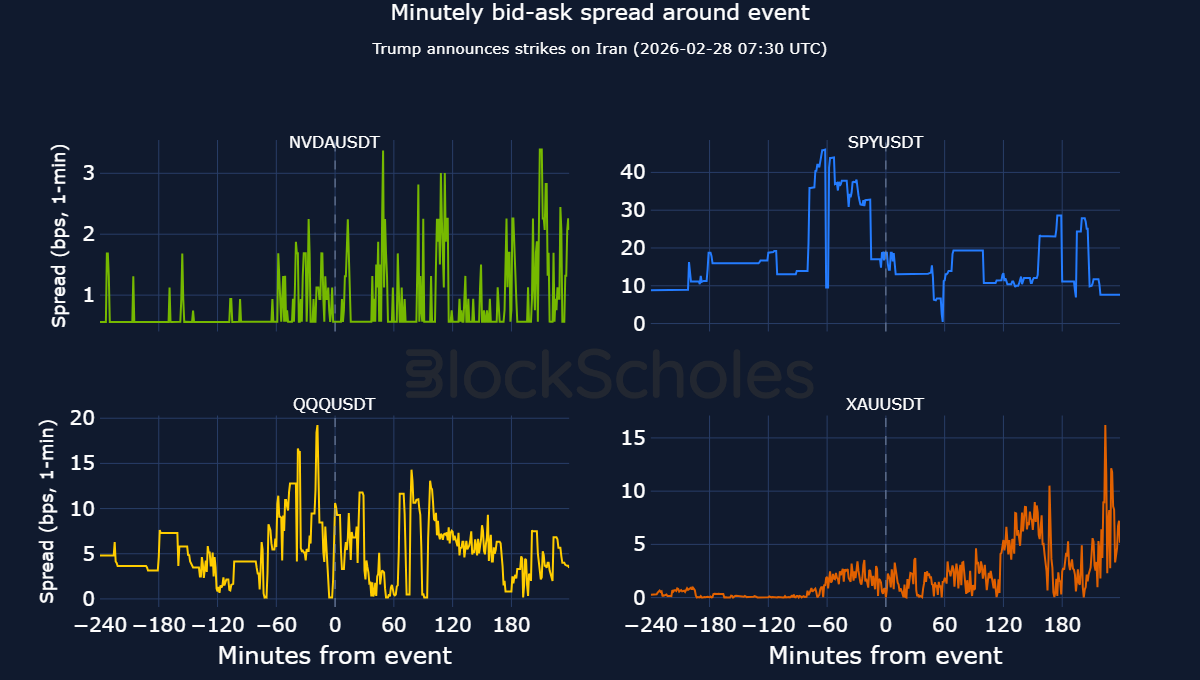
To understand how the order book responded after President Trump’s Truth Social address to the nation that the US had launched strikes against Iran, we start with the most direct metric: the minute-by-minute bid-ask spread across the four RWA perps in the ±4-hour window either side of the 07:30 UTC strike announcement (represented as the vertical dashed line).
Bid-ask spreads widened across all four perps after the announcement, though from different starting points:
The widening was brief however. NVDA's spread was back at its sub-1 bps baseline within minutes, and QQQ's had reverted close to its pre-event level inside the hour. For SPY, the wider spreads are likely a reflection of the perp contracts listing date — SPY-USDT launched on 11 February 2026, just 17 days before the Iran strikes, compared to September 2025 for NVDA-USDT, October 2025 for QQQ-USDT and December 2025 for XAU-USDT.
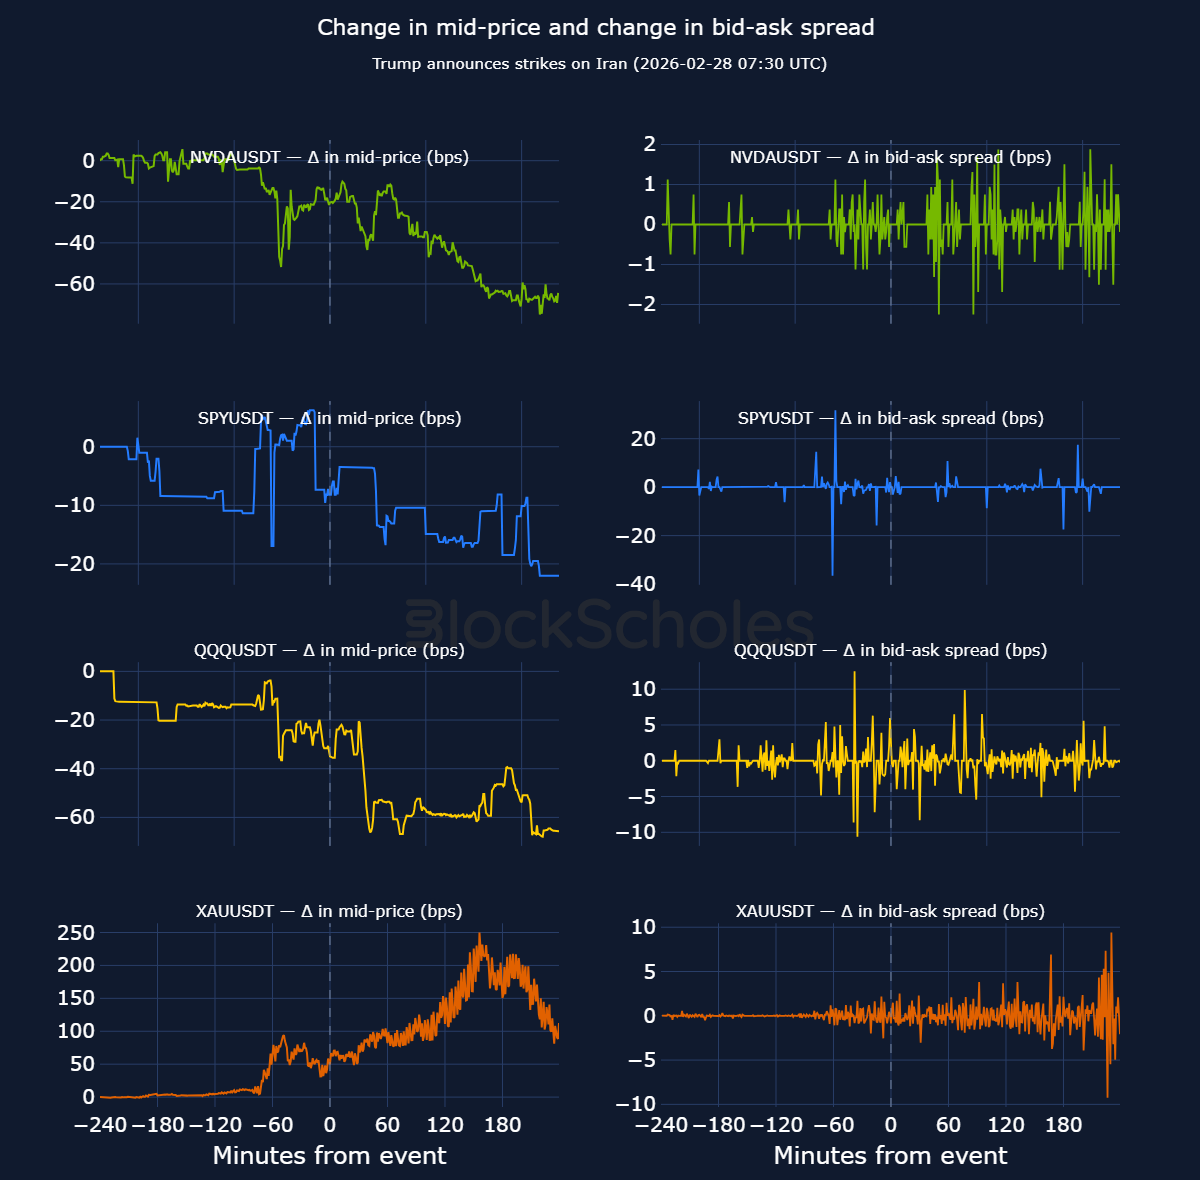
The clearest market reaction, though, was not in the equity perps but in gold (as highlighted in our previous report). From the announcement, XAU's mid price rallied roughly 2% — about 200 bps — to a peak near $5,416 two and a half hours later. The three equity perps, by contrast, only drifted modestly lower over the same window (NVDA −44 bps, QQQ −31 bps, SPY −14 bps). Gold was also by far the most actively traded of the four: roughly $11M of volume compared to $0.4M on NVDA for example.
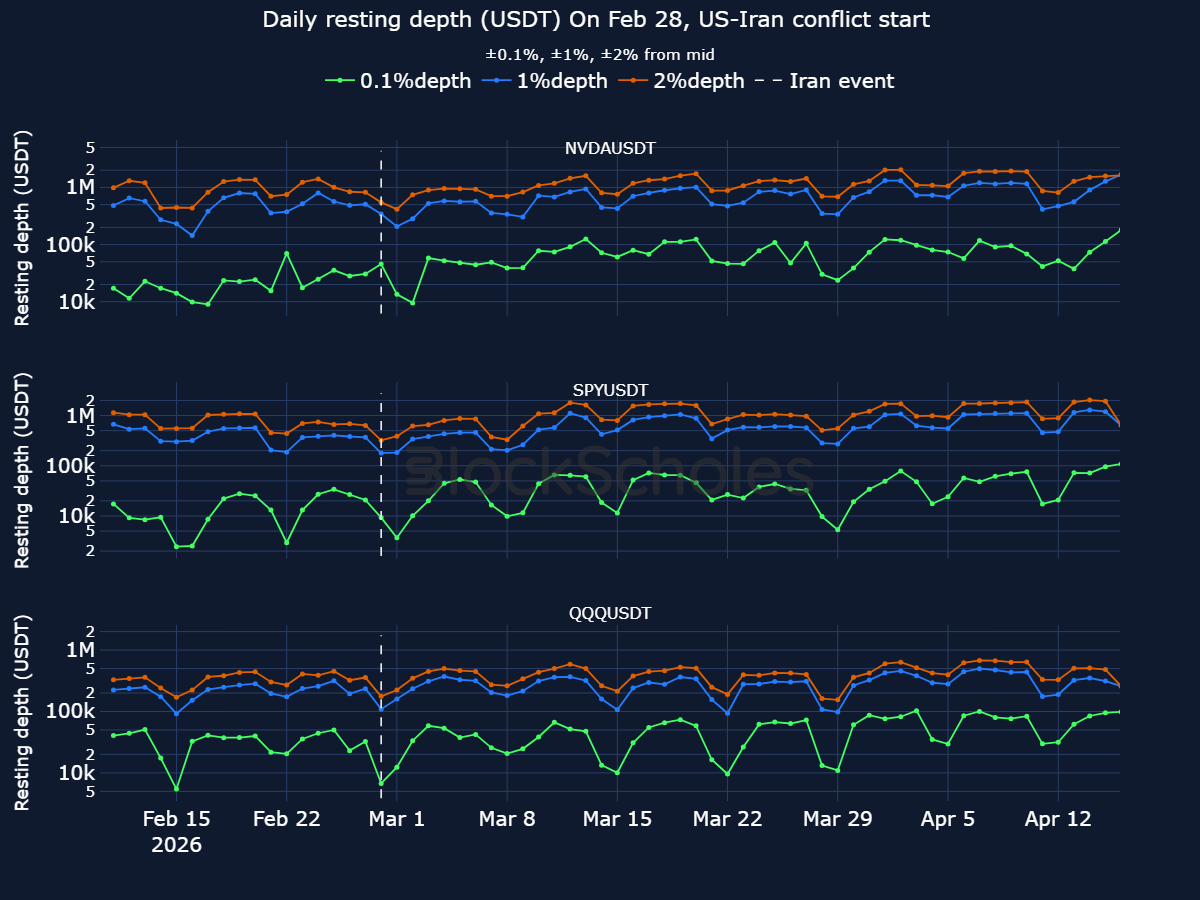
Beyond the top of the order book, it is useful to see how the volume of bids and asks at different price levels — market depth — changed around the beginning of the conflict. Using data provided by Bitget, there is evidence that across the perp contracts, order book depth did visibly decline on the day of the initial strikes.
Between Feb 27 and Feb 28, the median daily resting depth at the ±1% band fell by roughly 32% on NVDA (from $507K to $343K), 52% on SPY (from $369K to $179K) and 54% on QQQ (from $235K to $109K), with a comparable drop at the ±2% band across all three perps.
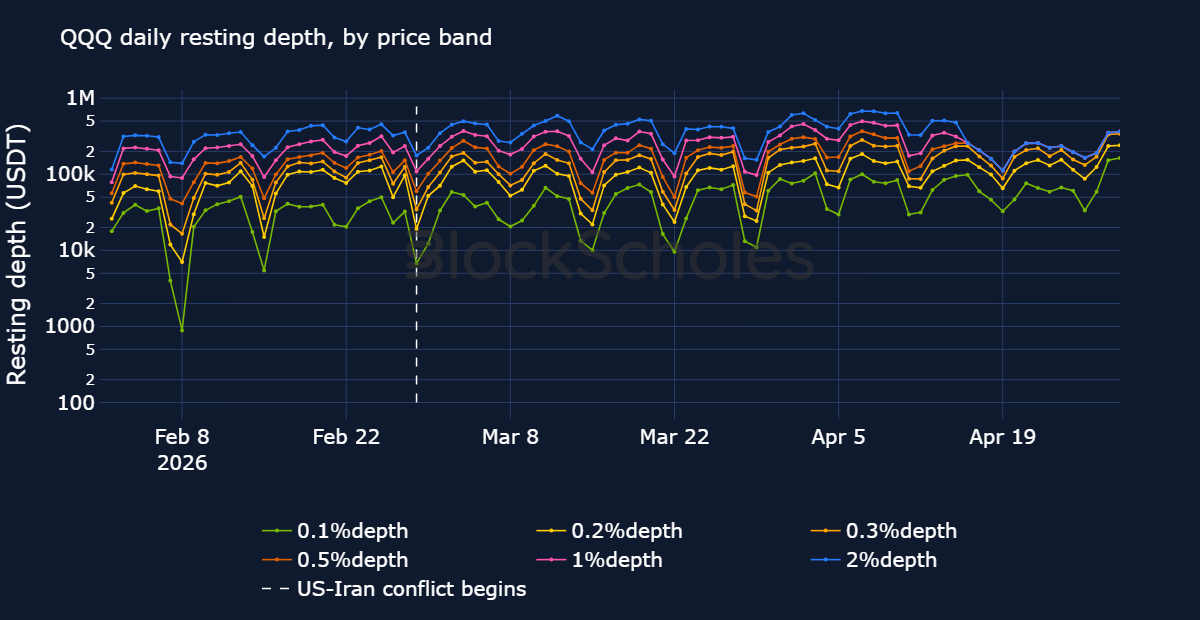
We can see the effect on QQQ for example, more clearly below. The weekend liquidity effect is visible as depth thins out on weekends and the sharp drop in depth across all bands around the beginning of the US-Iran conflict is more noticeable.
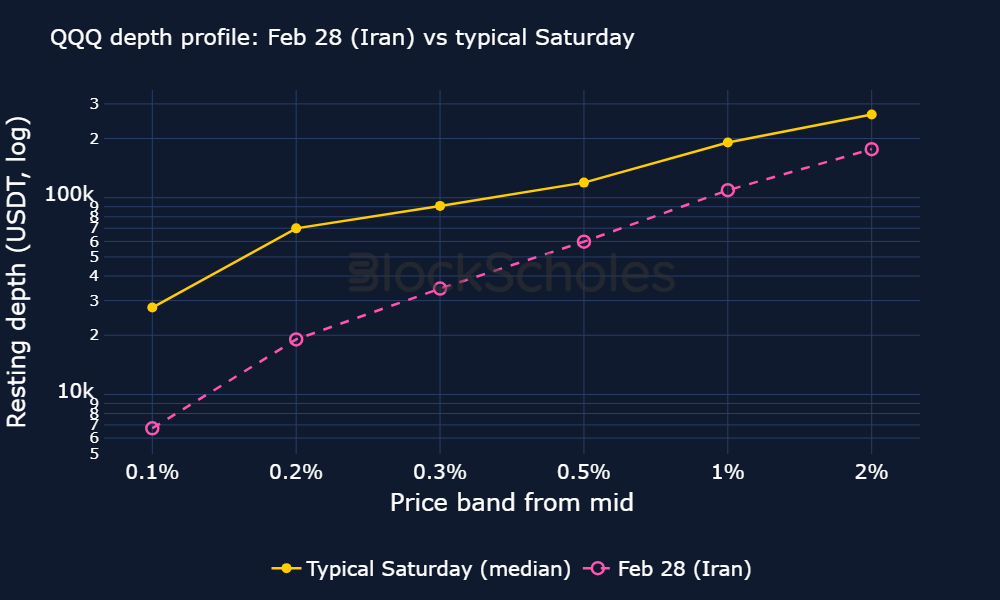
However, how much of the decline in depth on Feb 28 was simply representative of the weekend liquidity bias uncovered in the previous section? To isolate the US-Iran effect, we focus on the order book depth for QQQ-USDT on Sat Feb 28, relative to the 18 other Saturdays in our Jan-May window.
That reveals the drop in order book depth on Feb 28 was not just a weekend driven decline in liquidity. Feb 28 sits below the typical Saturday at every price band. For example, at the 1% of mid-price band, total resting liquidity was $109.2K, relative to a Saturday median of $190.9K. The dislocation was temporary, however. By the following Saturday (Mar 7) QQQ's 1% depth had recovered to $204.3K, back in line with the Saturday median of $190.9K, and has stayed in that range since.
Across this report we have measured Bitget's RWA perp liquidity from four angles: bid-ask spreads at the touch, slippage on size, the depth of the resting order book at multiple price bands, and how each of those held up outside US equity hours and around acute geopolitical stress.
The findings are consistent. In a mid-May snapshot taken an hour into the US session, top-of-book spreads stood at roughly 0.02 bps on gold, 0.14 bps on SPY and QQQ, and 0.44 bps on NVDA — a basis point or less to cross the market on the headline contracts. Slippage on larger order sizes is robust both during traditional US equity trading hours and outside them, such as during weekends. Depth has also structurally deepened over 2026 — by mid-May, NVDA-USDT's resting depth within 2% of mid stood at roughly $4.1M, around three-quarters of the depth of Bitget's BTC/USDT spot market.
Out of traditional market hours, weekend and overnight liquidity behaves cyclically, thinning out though not collapsing. Around the onset of the US-Iran conflict on 28 Feb, 2026 all four perps continued to provide executable markets during and immediately following President Trump's announcement of the strikes. Spreads widened by single-digit bps and quickly recovered to pre-conflict levels. Order book depth thinned more visibly, most of all on QQQ, reflecting both the weekend liquidity bias and an even-specific decline in depth. Again, that did not last long: depth across a number of bands from the mid-price returned to its pre-event range within a week.
Taken together, these results indicate that the liquidity of Bitget's RWA perps remains aligned with traditional US equity trading hours but is not contingent on them: spreads stay narrow absent a discrete shock and order book depth remains resilient.
The findings suggest that Bitget’s UEX infrastructure provides continuous access to crypto-native and traditional-market exposures within a single collateral environment, with execution costs that hold up through out-of-hours trading and geopolitical stress. The introduction of USDGO-based settlement further extends this single-wallet framework by providing a common settlement asset across spot and futures markets.
This report is intended for informational purposes only and does not constitute investment advice. Product availability may vary by jurisdiction.

.jpg)
.jpg)