Tazmina Rashid
Research Analyst
This week's edition of our Crypto Altcoins Analytics.

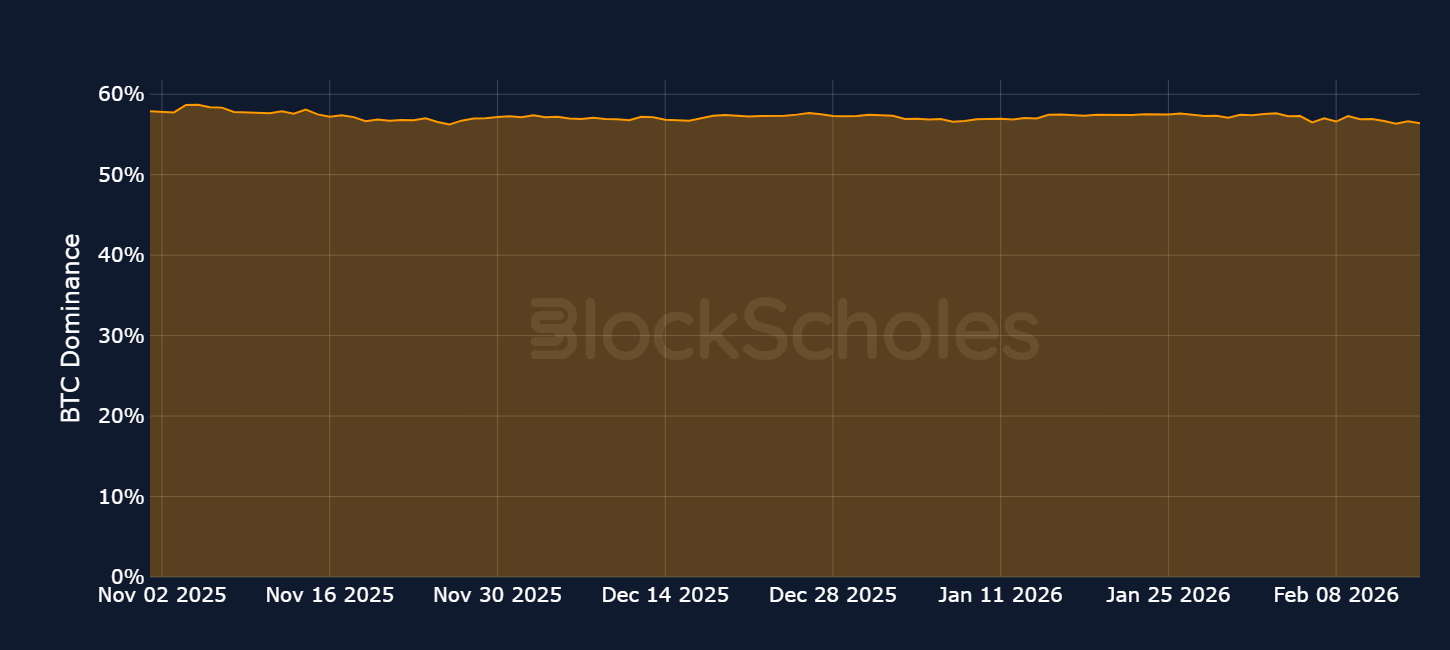
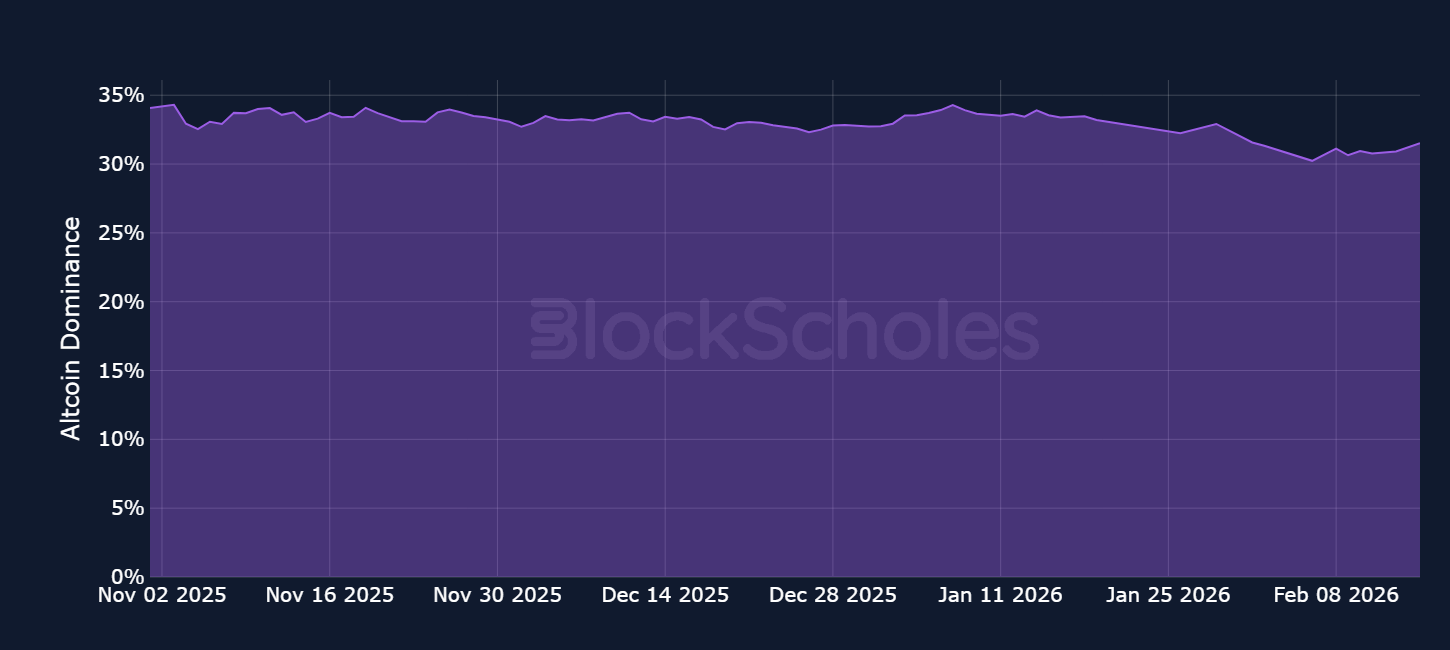
Bitcoin and Altcoin Dominance – As spot prices stabilised this week, altcoin dominance regained nearly 1.5% of the total crypto market cap following its low during the market crash earlier this month. In comparison, Bitcoin dominance has remained steadier, fluctuating between 56% and 58% year to date.
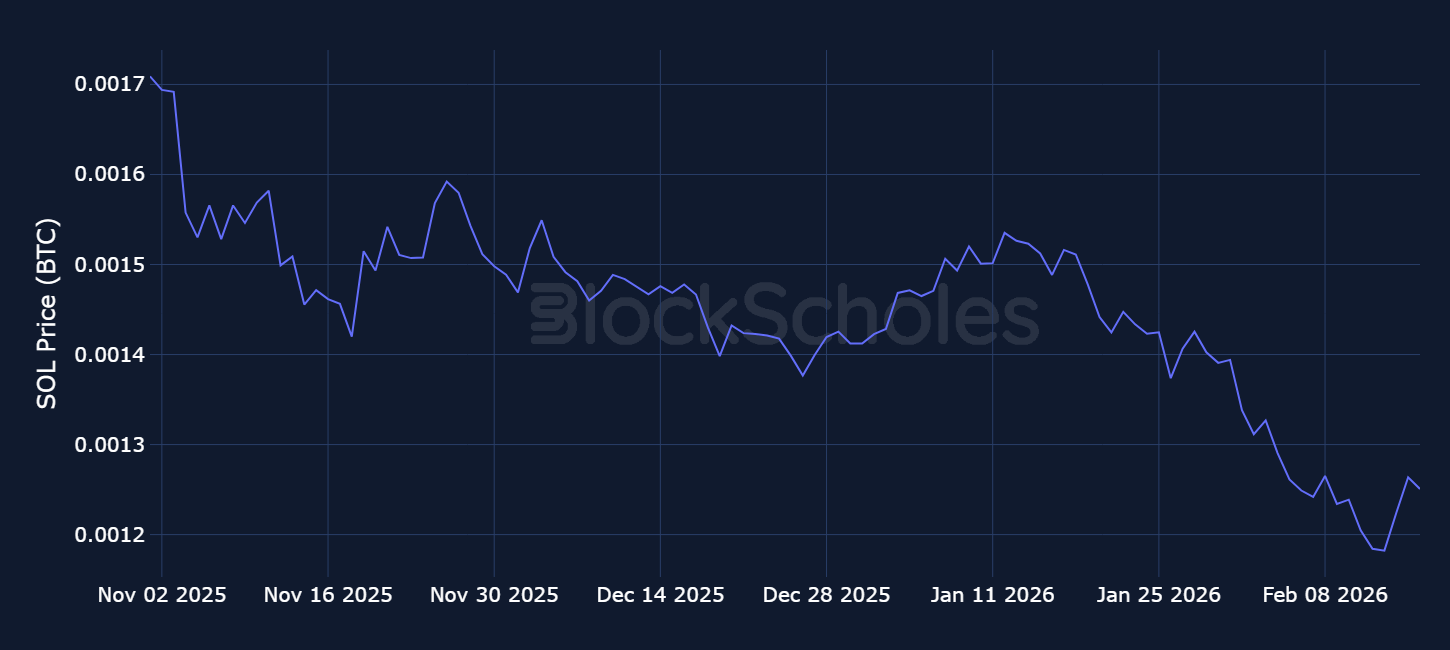
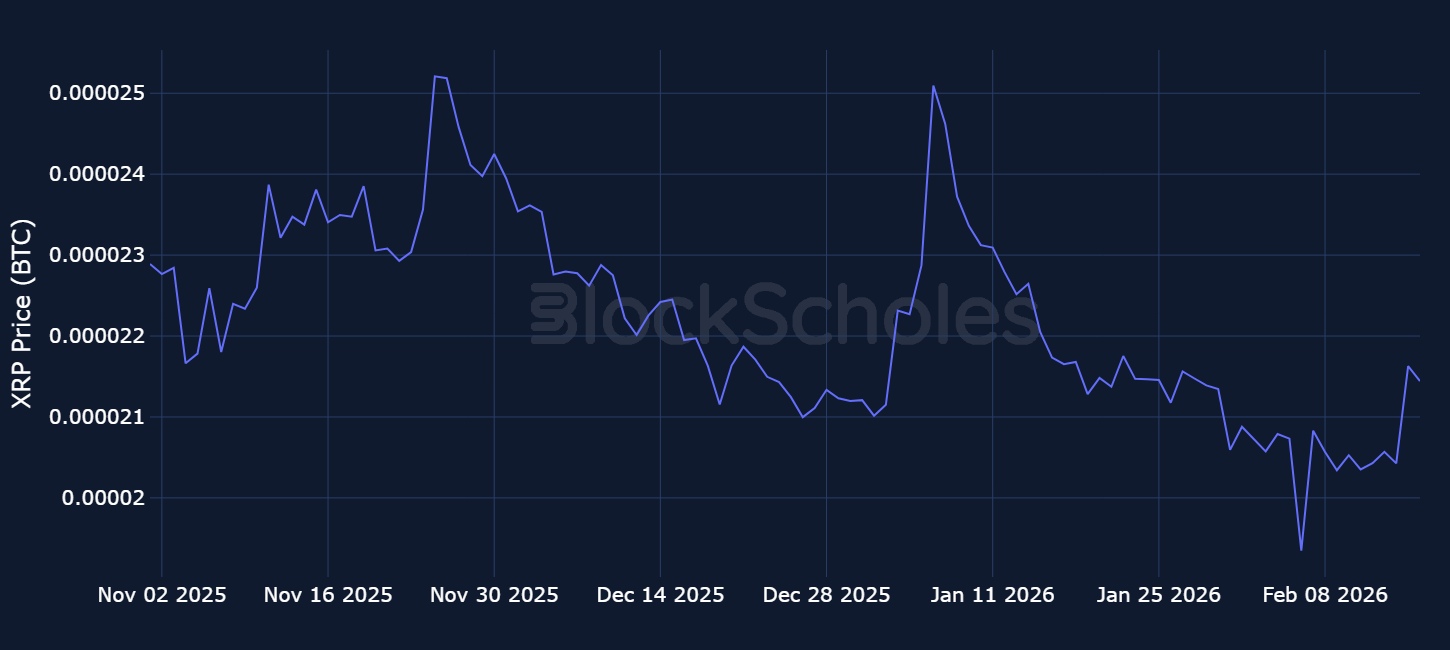
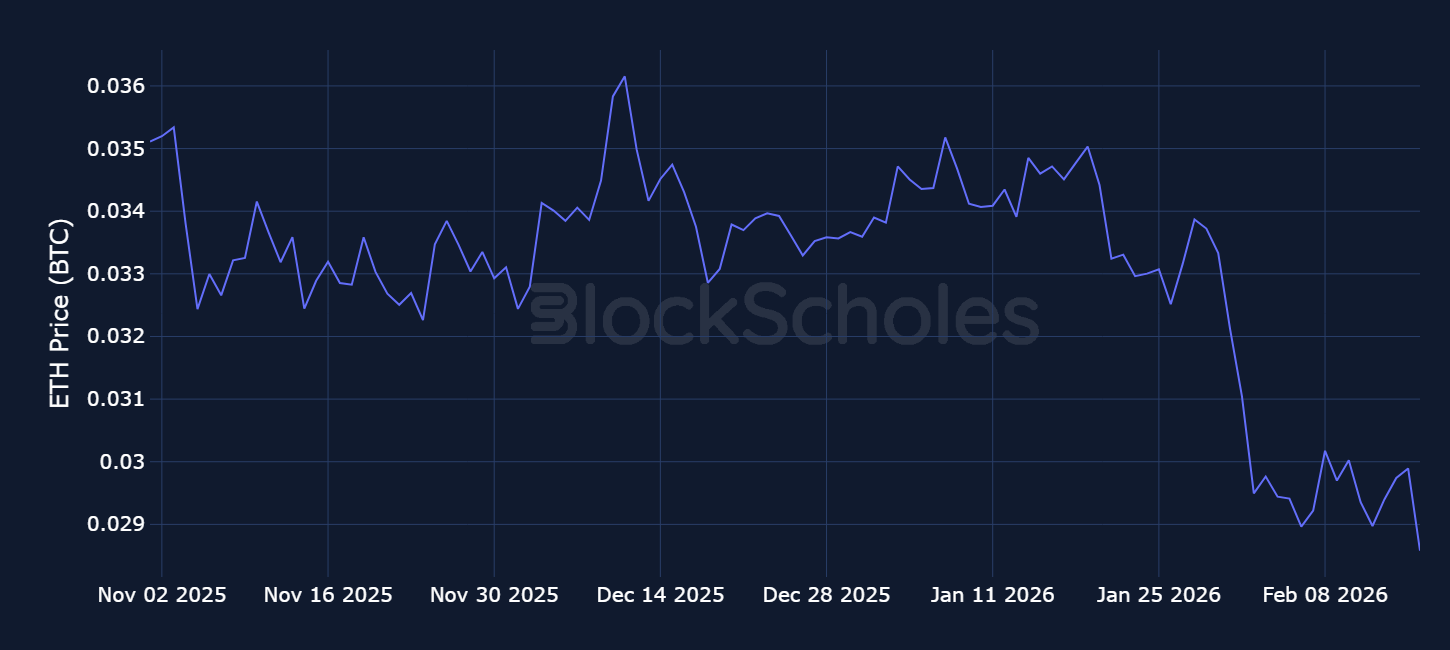
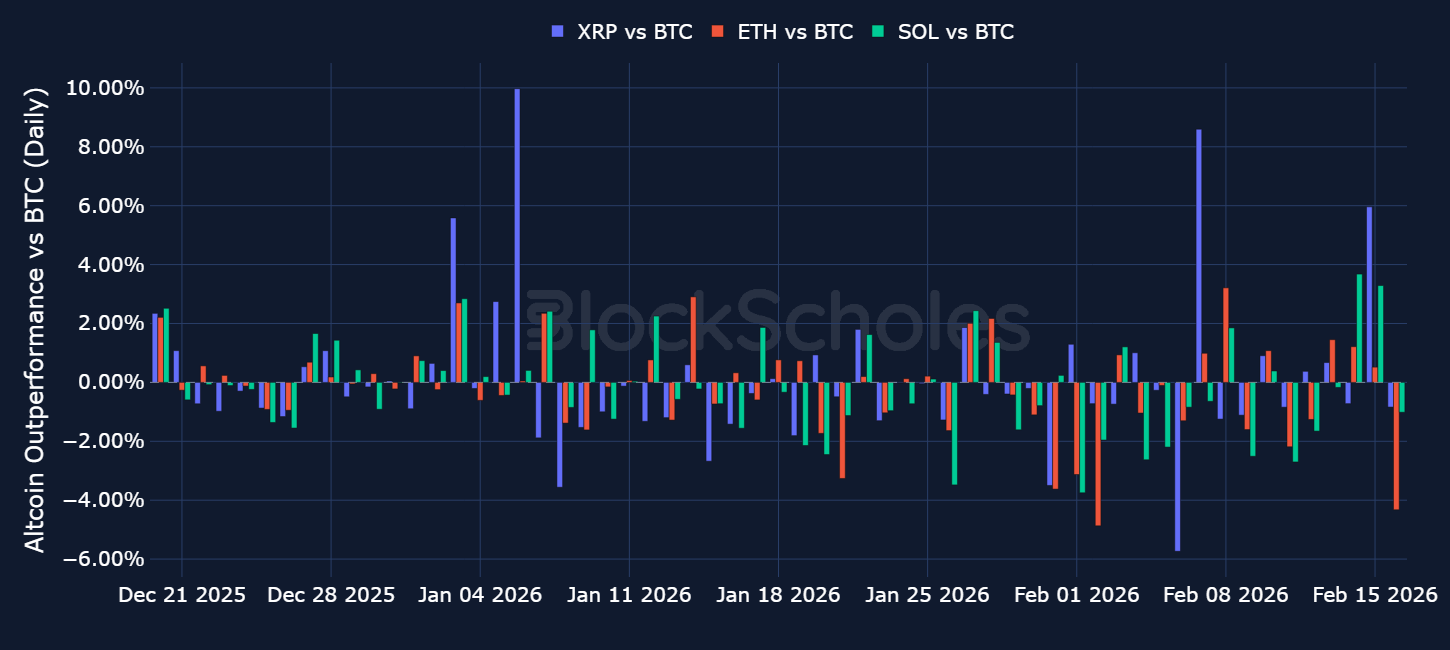
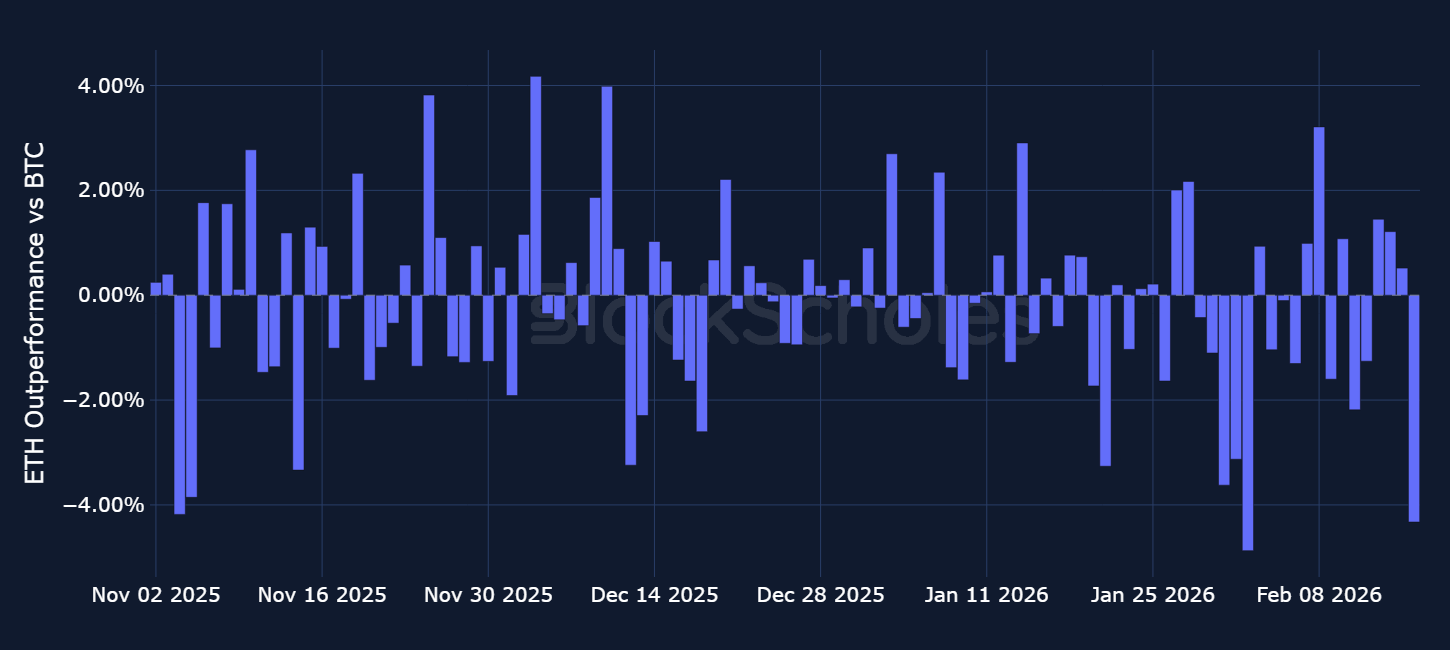
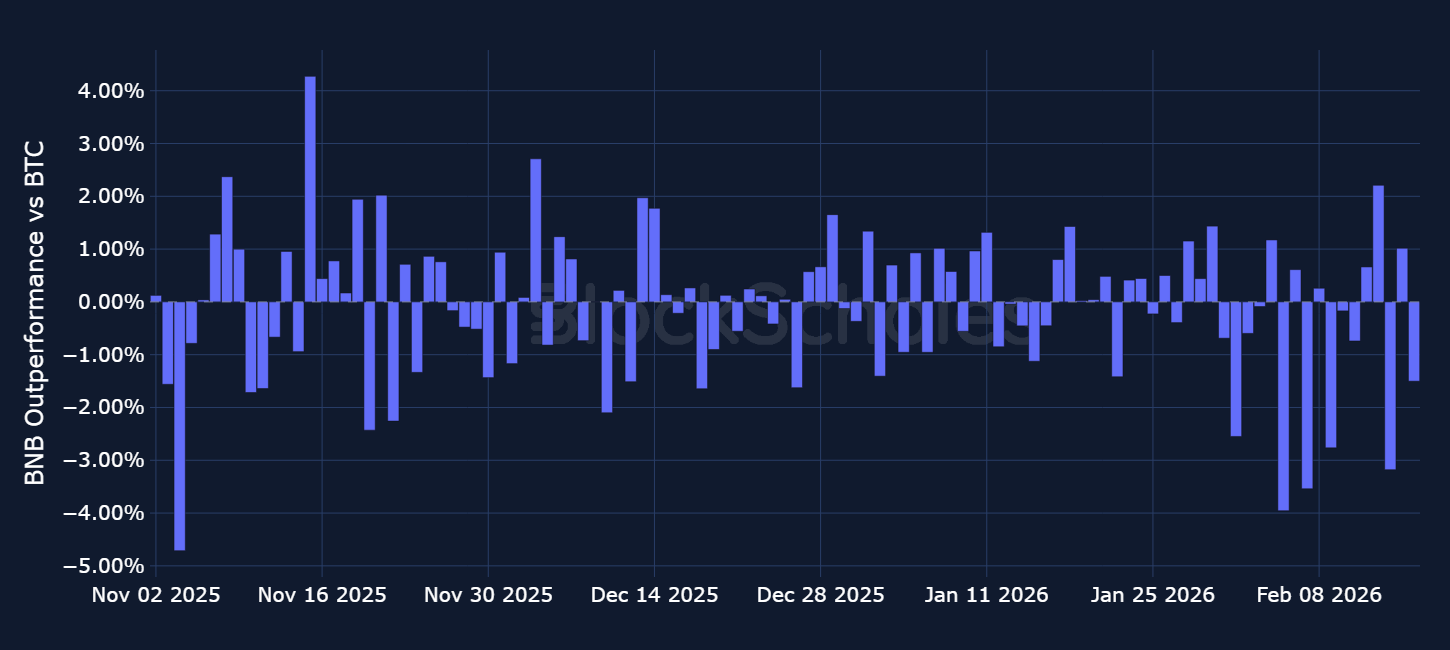
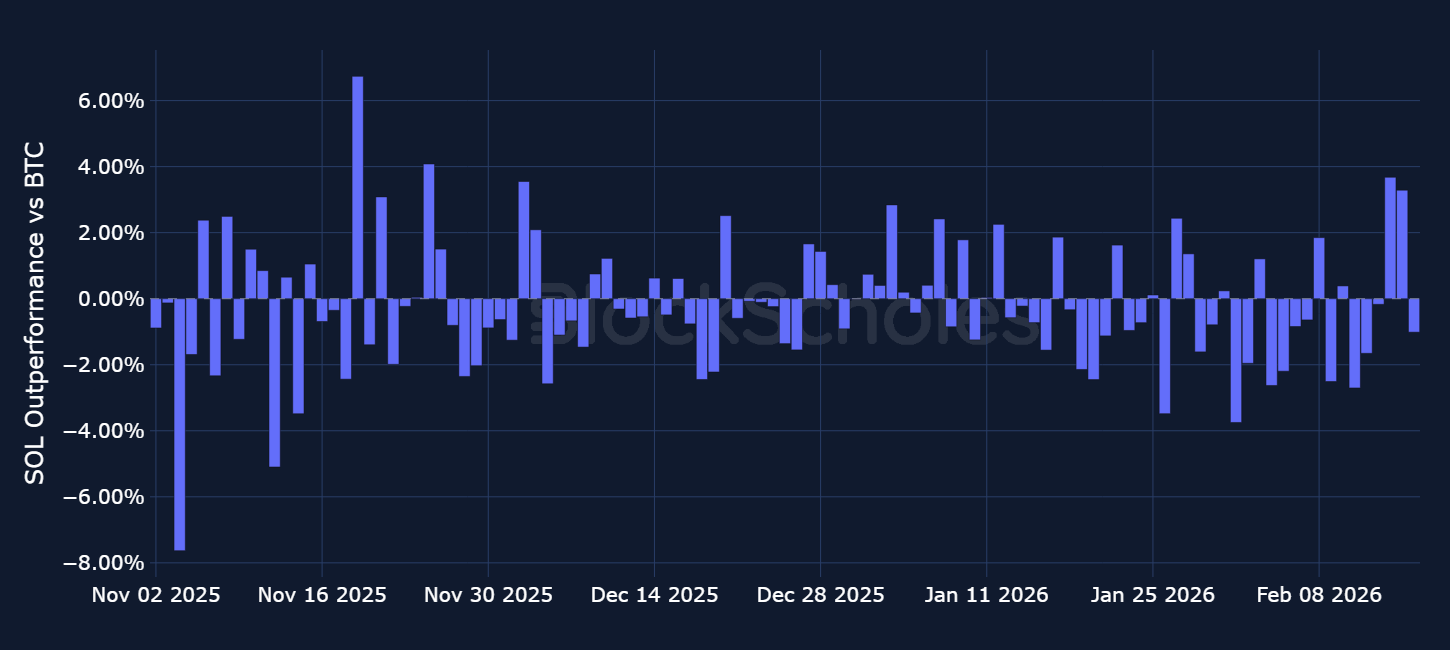
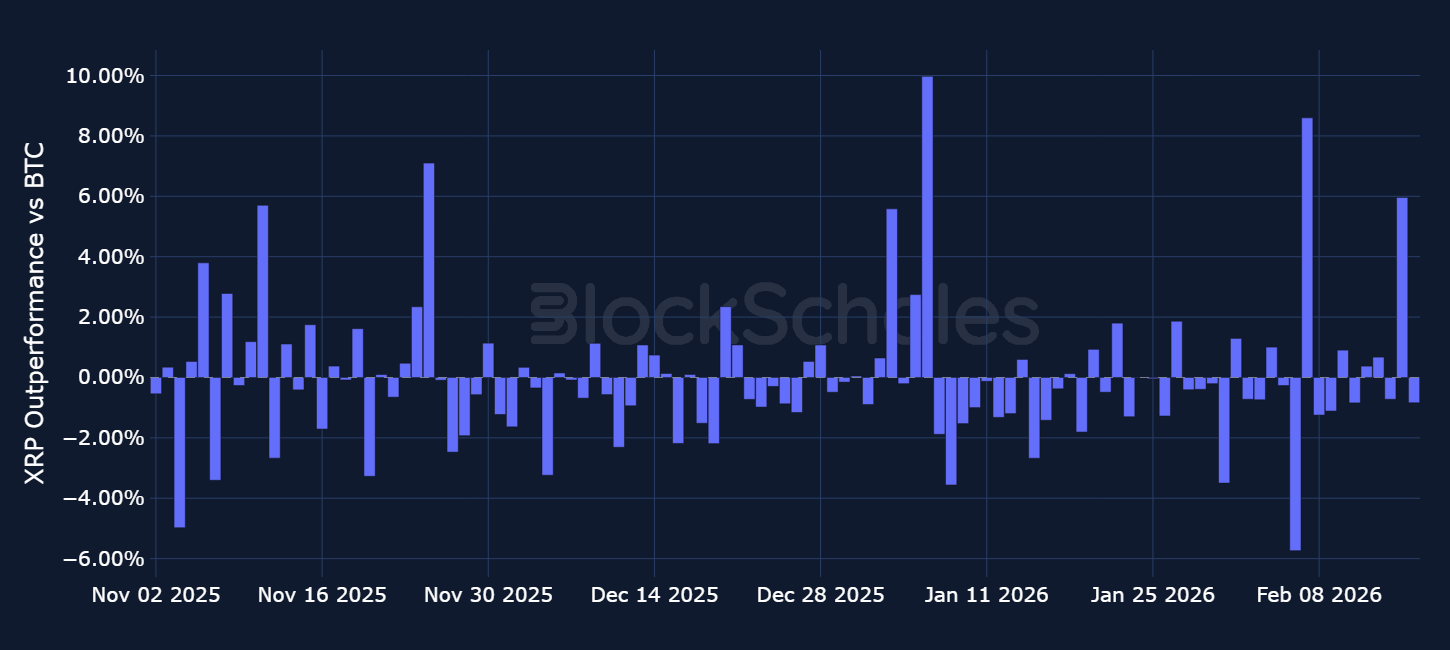
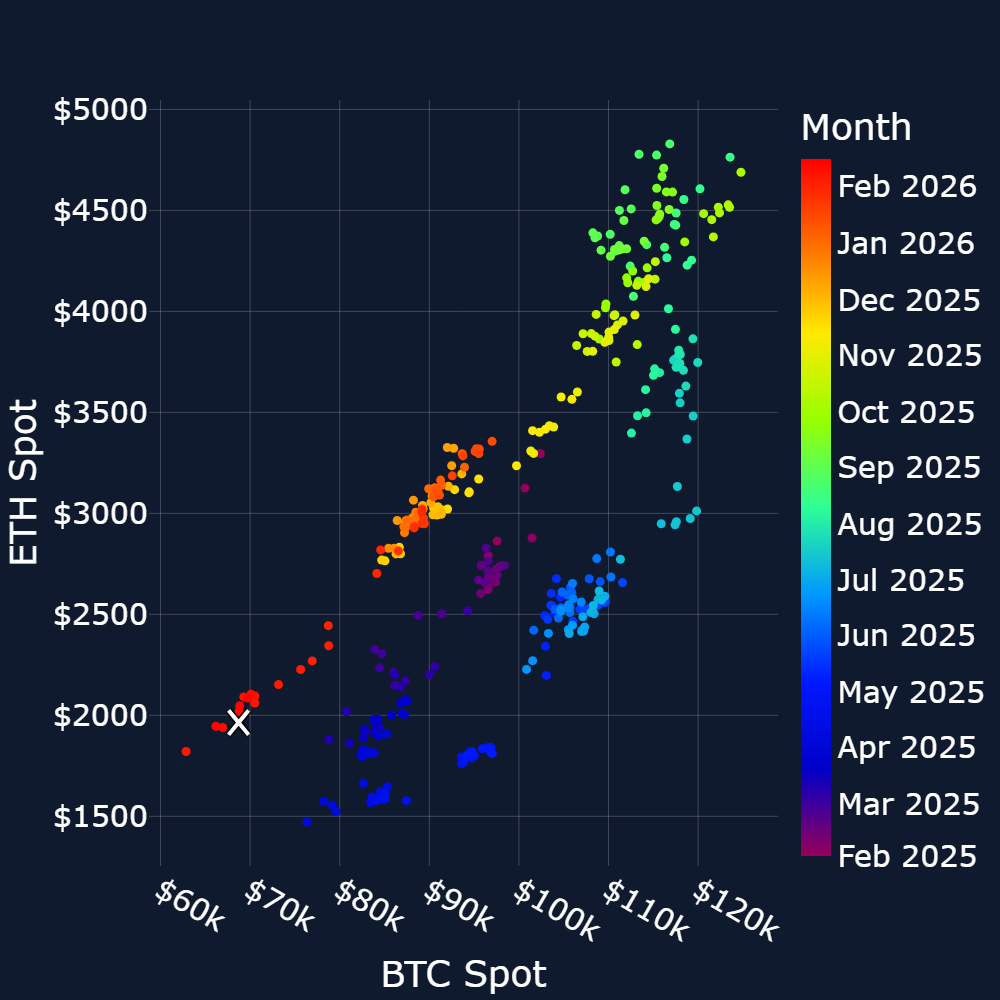
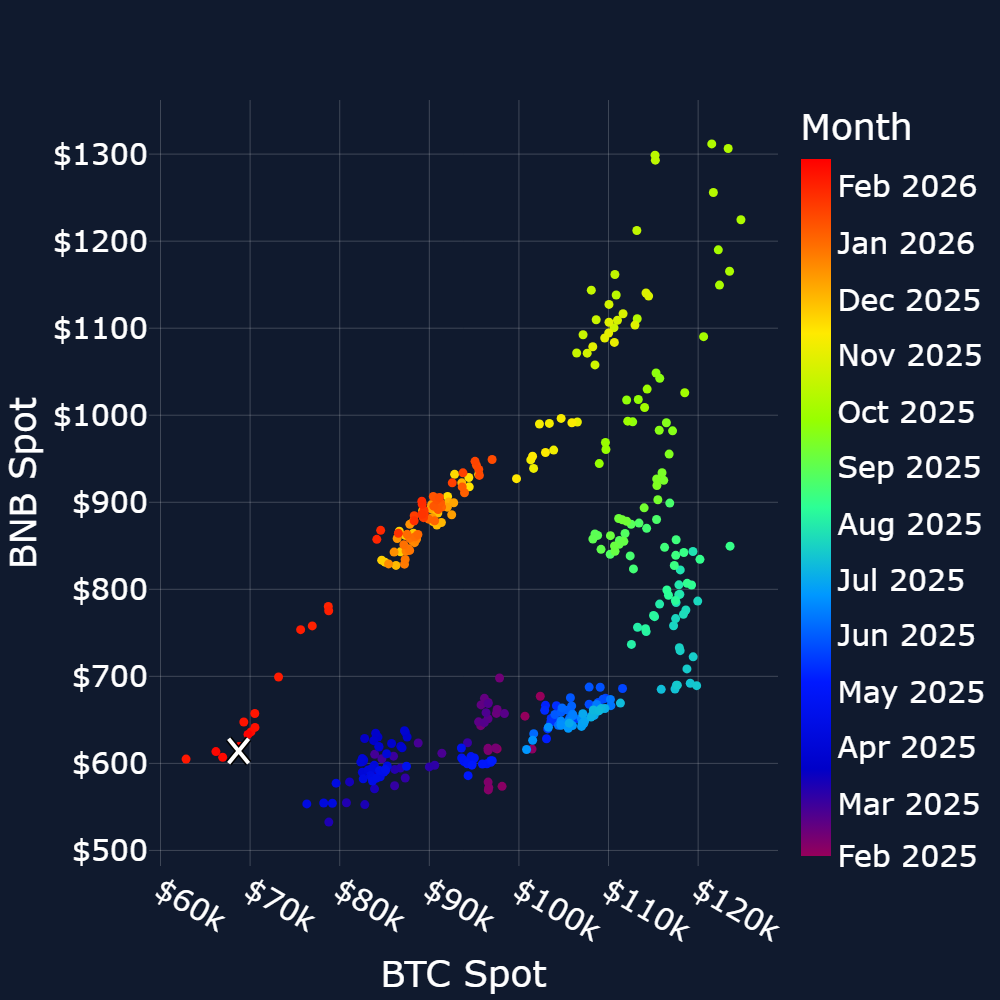
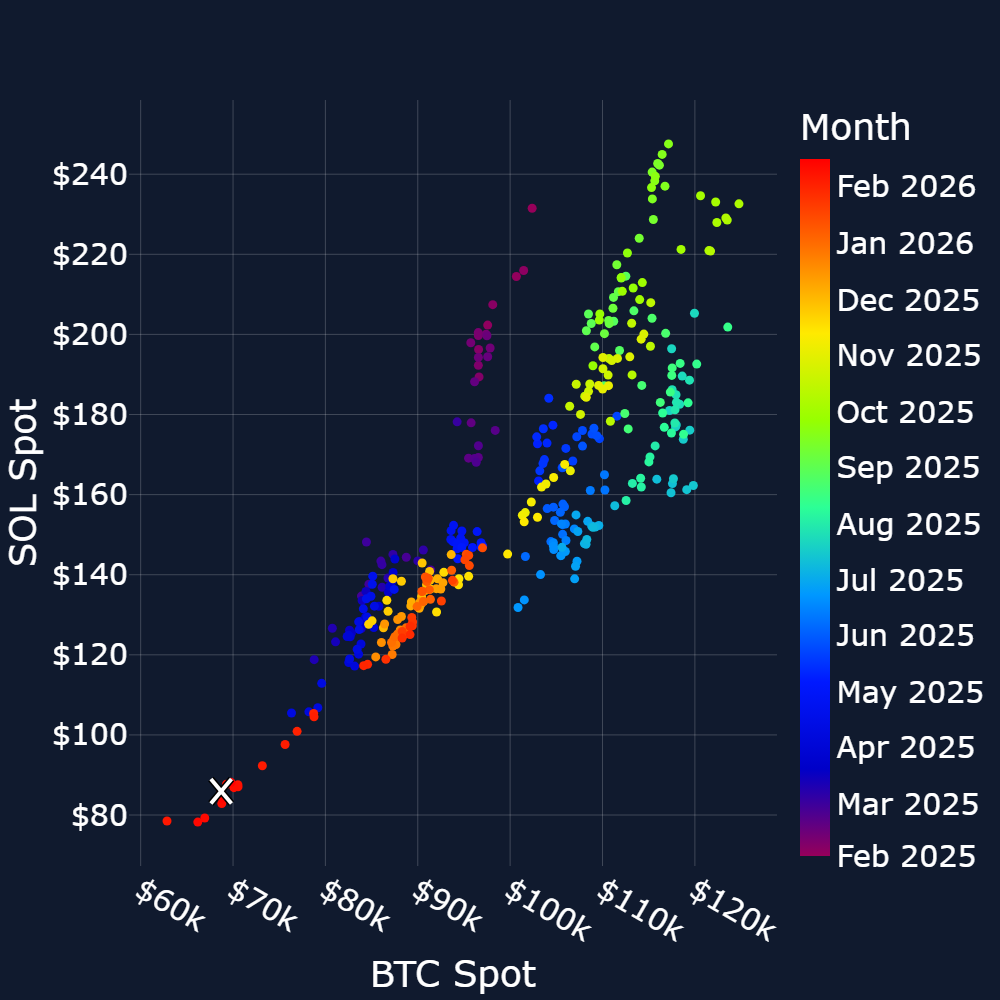
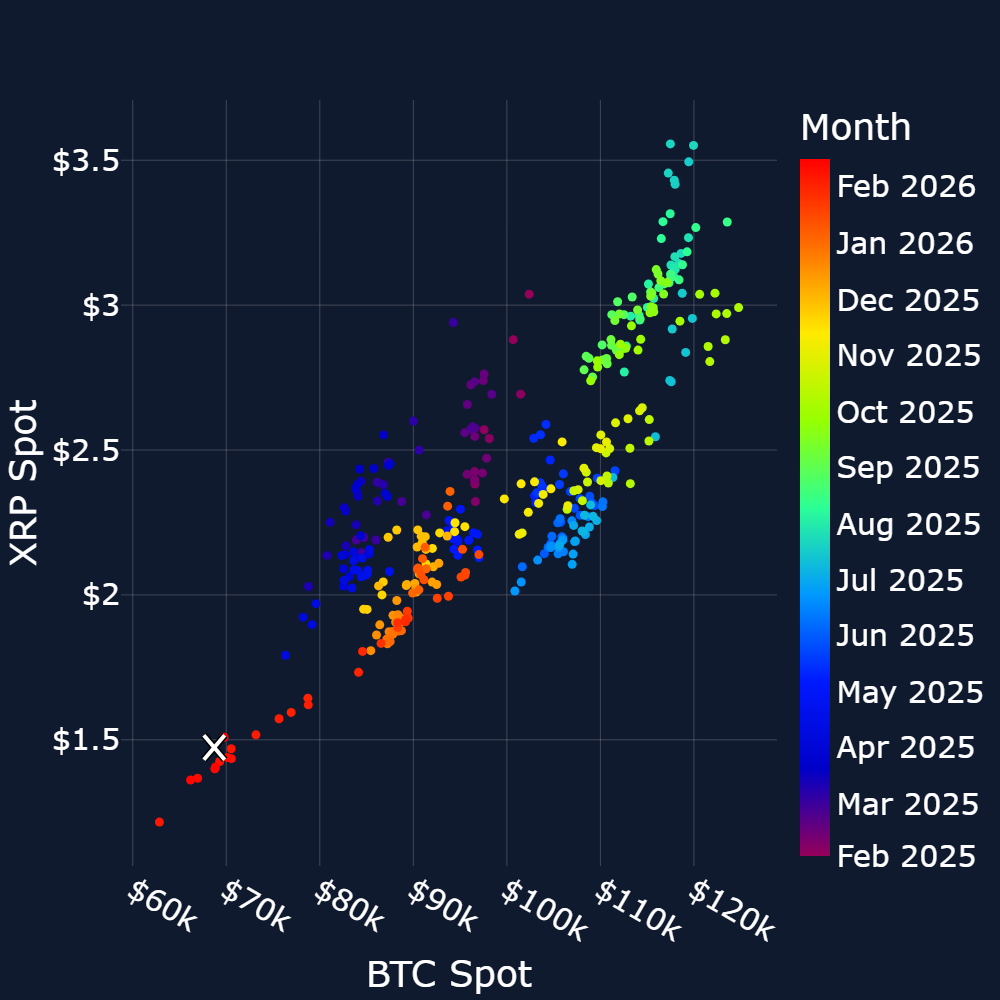
Altcoins Outperformance – ETH underperformed BTC by 5% on Feb. 16. In comparison, XRP and SOL both outperformed: SOL rose 3.6% and 3.2% relative to BTC on consecutive days following earlier-week underperformance, while XRP saw a one-day 5.9% outperformance relative to BTC and otherwise moved more in line with BTC returns for the rest of the week.
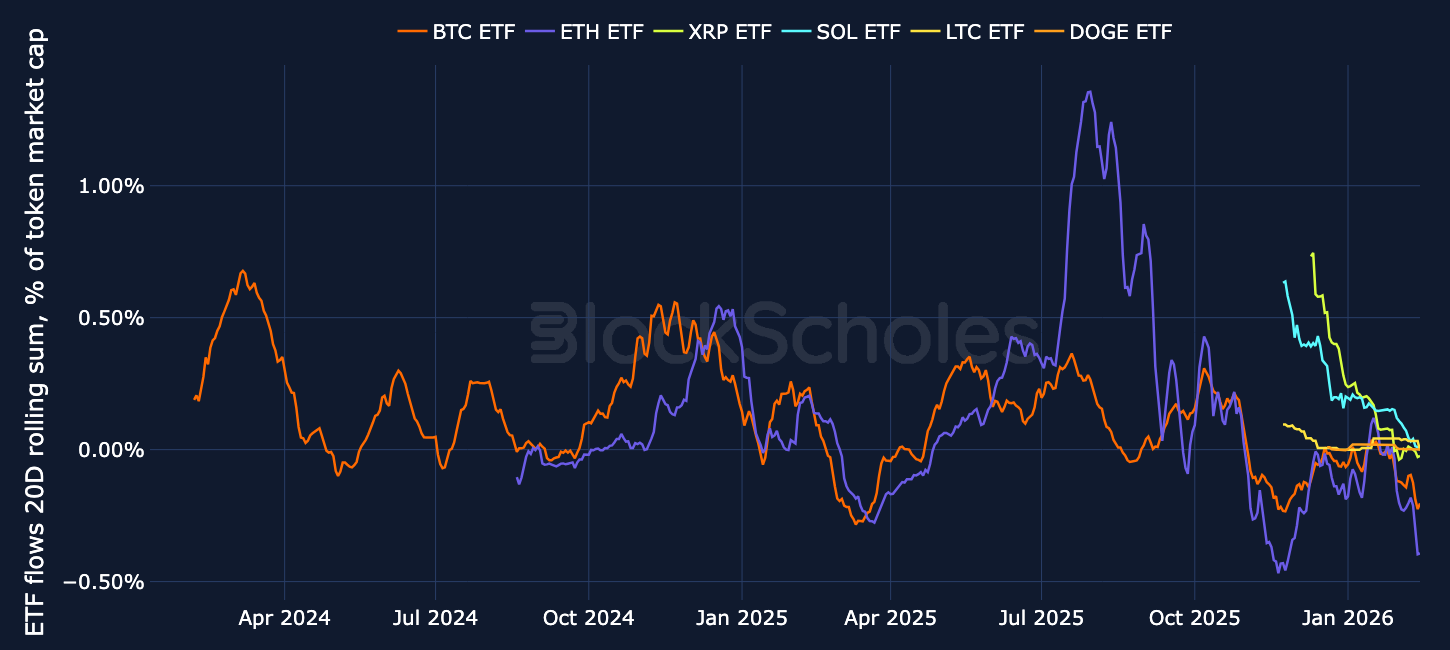
ETF Flows – BTC ETFs recorded $359.9M of net outflows, while ETH ETFs saw roughly $161.2M of net outflows.
Activity in altcoin ETFs was largely muted, with flows being close to zero for the past few days.
The only notable change occurred in SOL ETFs on Friday of $1.57M. The inflow followed the announcement that Solana Company (NASDAQ: HSDT), in partnership with Anchorage Digital and the Solana lending protocol Kamino, launched a structure allowing institutions to obtain loans secured by natively staked SOL while the assets remain staked and held in segregated custody accounts at Anchorage.
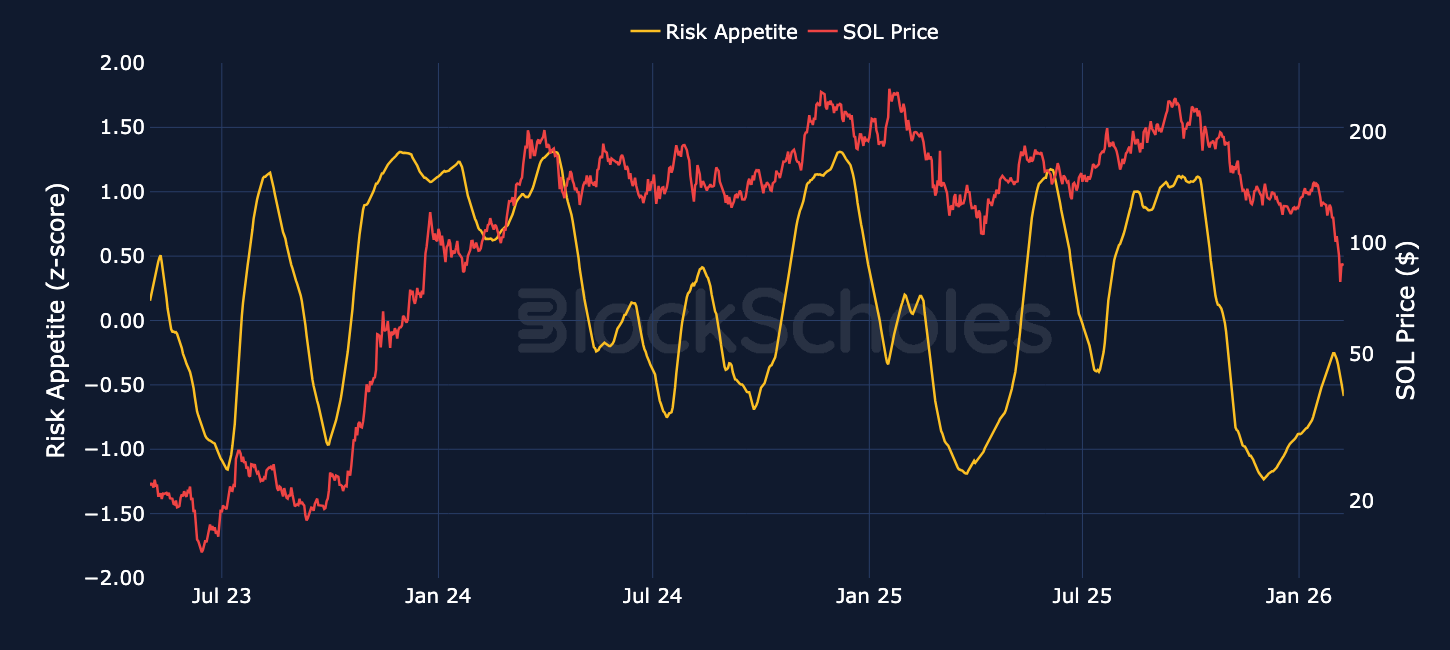
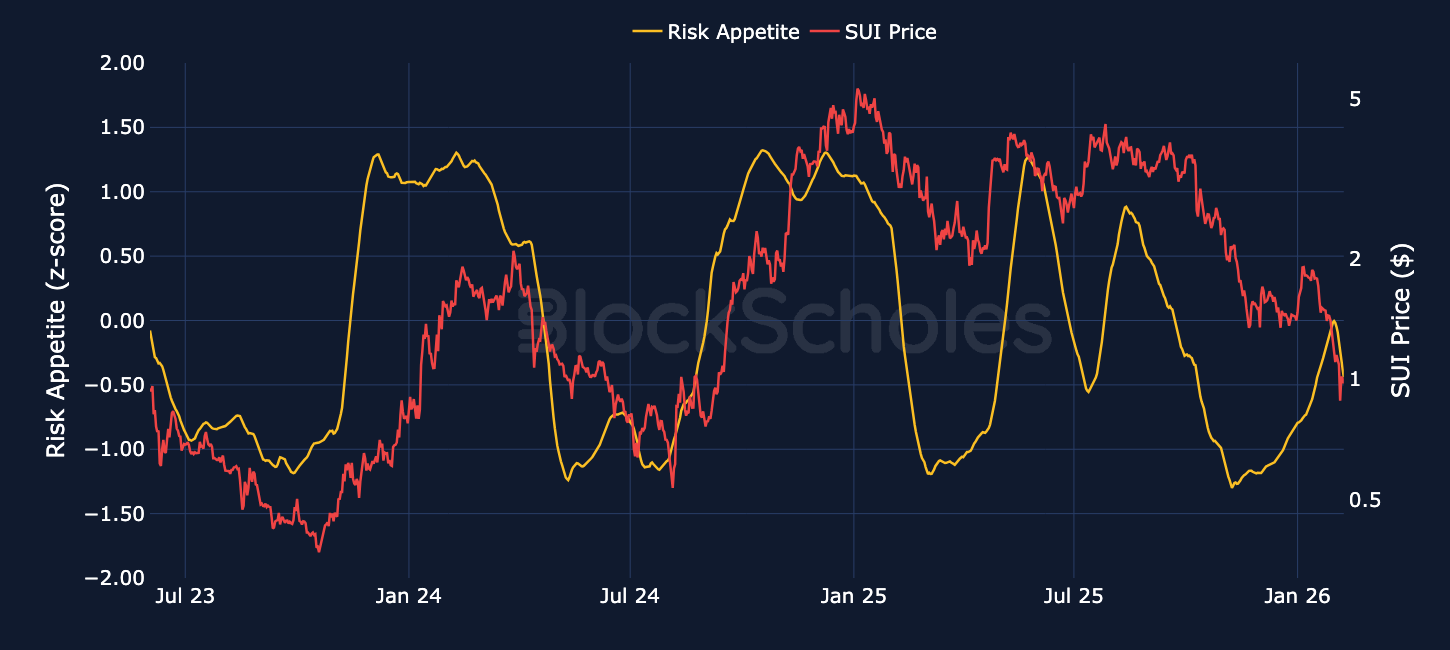
Block Scholes’ Risk Appetite Index measures the level of euphoria (above 1) or panic (below -1) in the spot market. Momentum in this index shows a strong relationship to spot returns.