Tazmina Rashid
Research Analyst
This week's edition of our Crypto Altcoins Analytics.

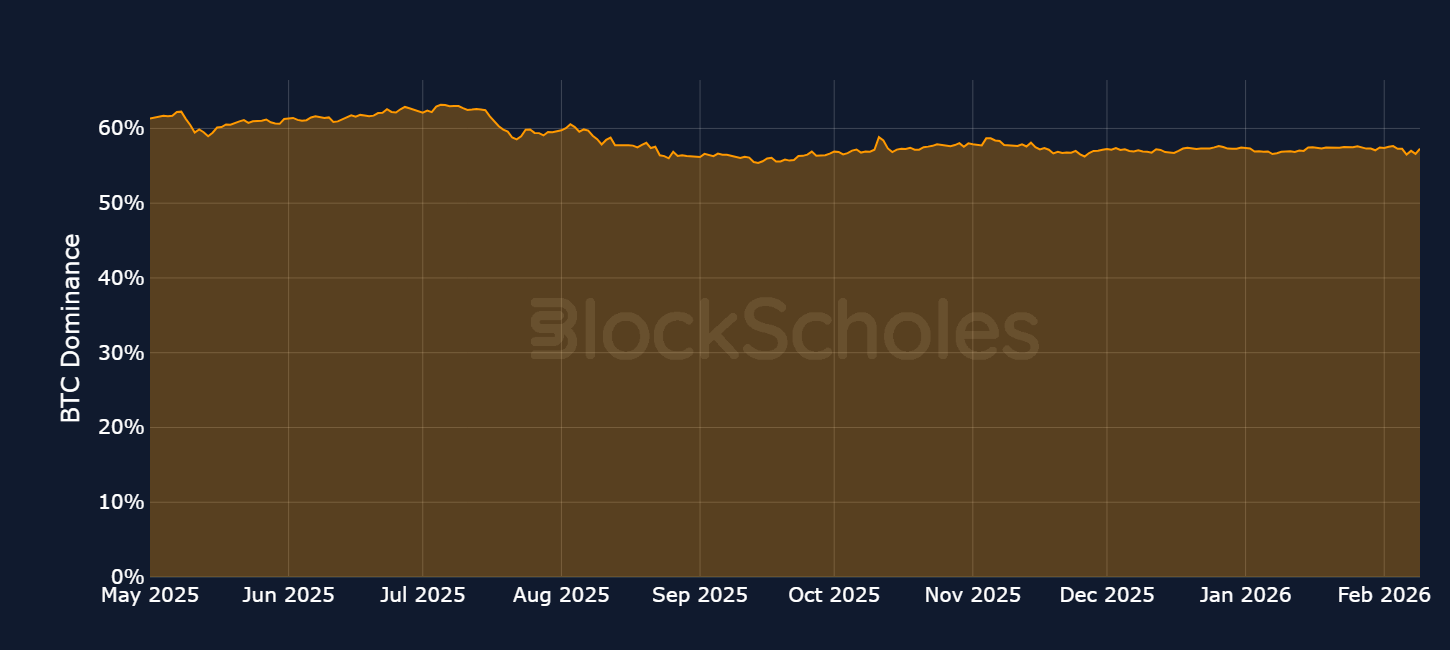
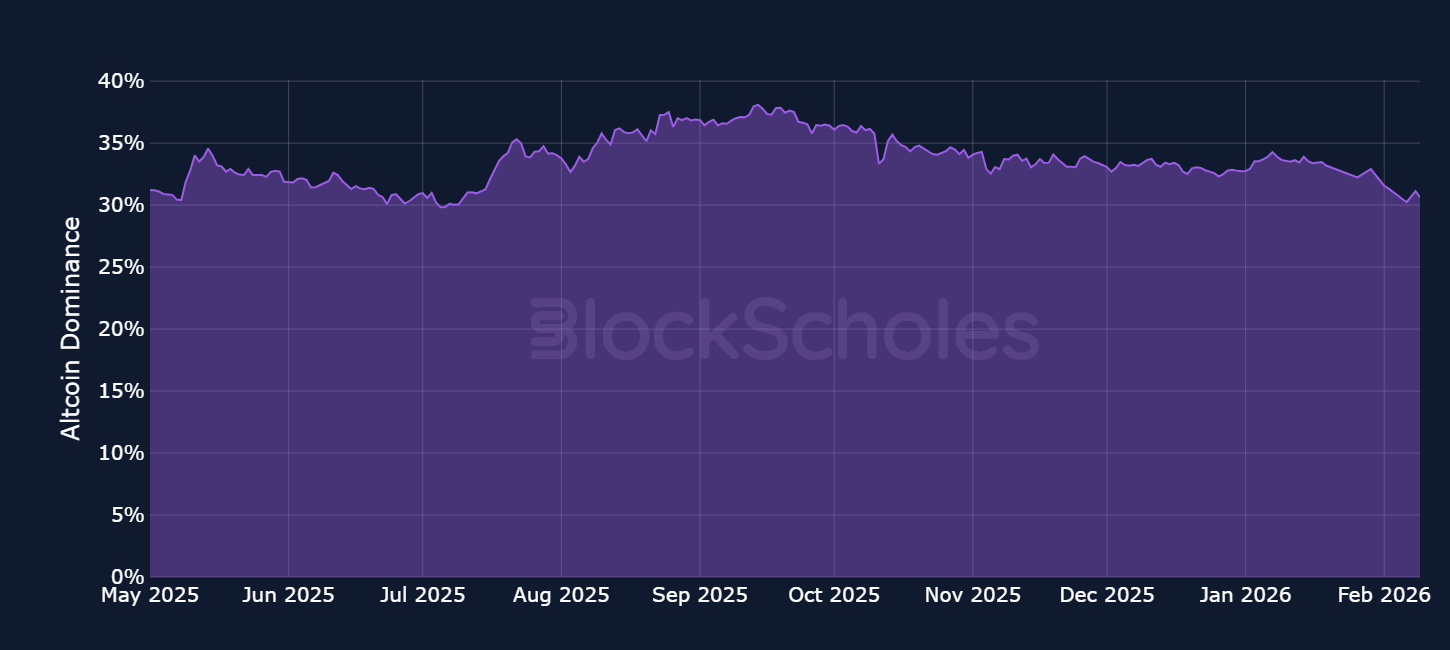
Bitcoin and Altcoin Dominance – Despite crypto prices dropping rapidly amidst broader market weakness, Bitcoin dominance remains surprisingly steady, only showing slight fluctuations over the past week. In comparison, Altcoin dominance has dropped more significantly, falling down over 5% to a 30% dominance, a reflection of the value dispersing into stablecoins, rather than a rotation into Bitcoin.
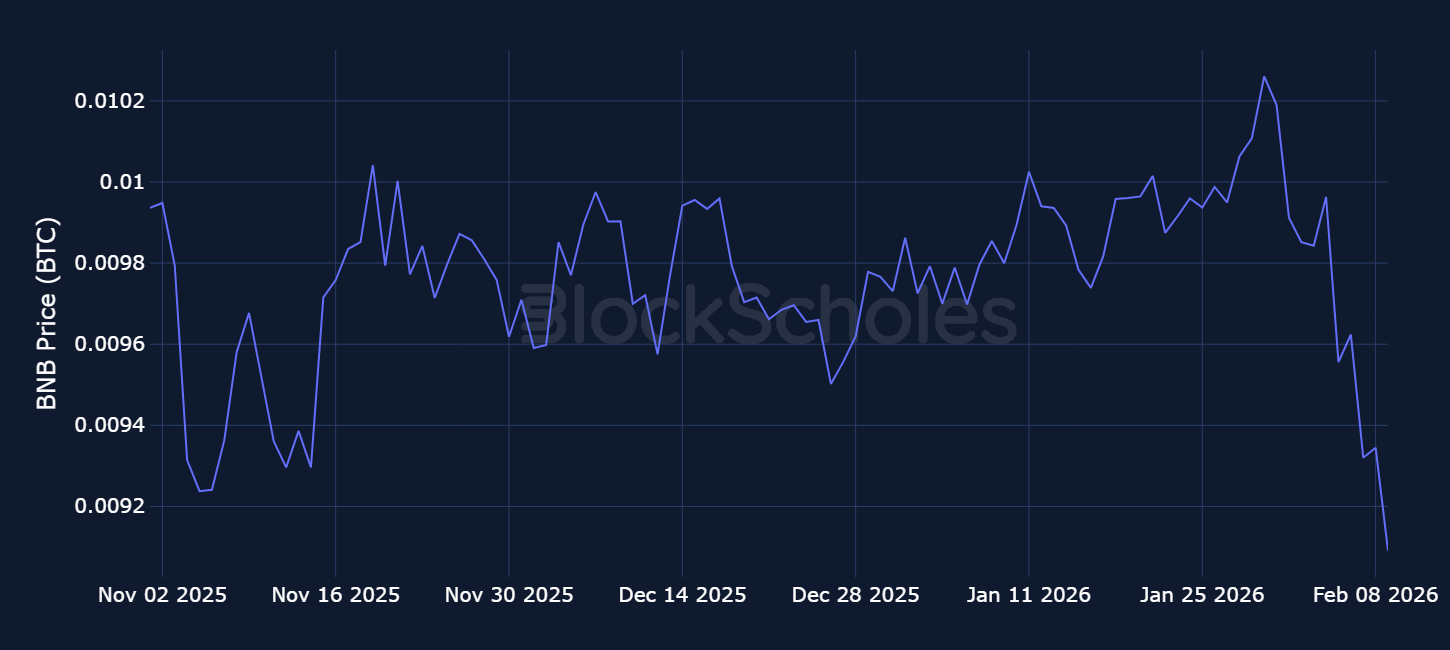
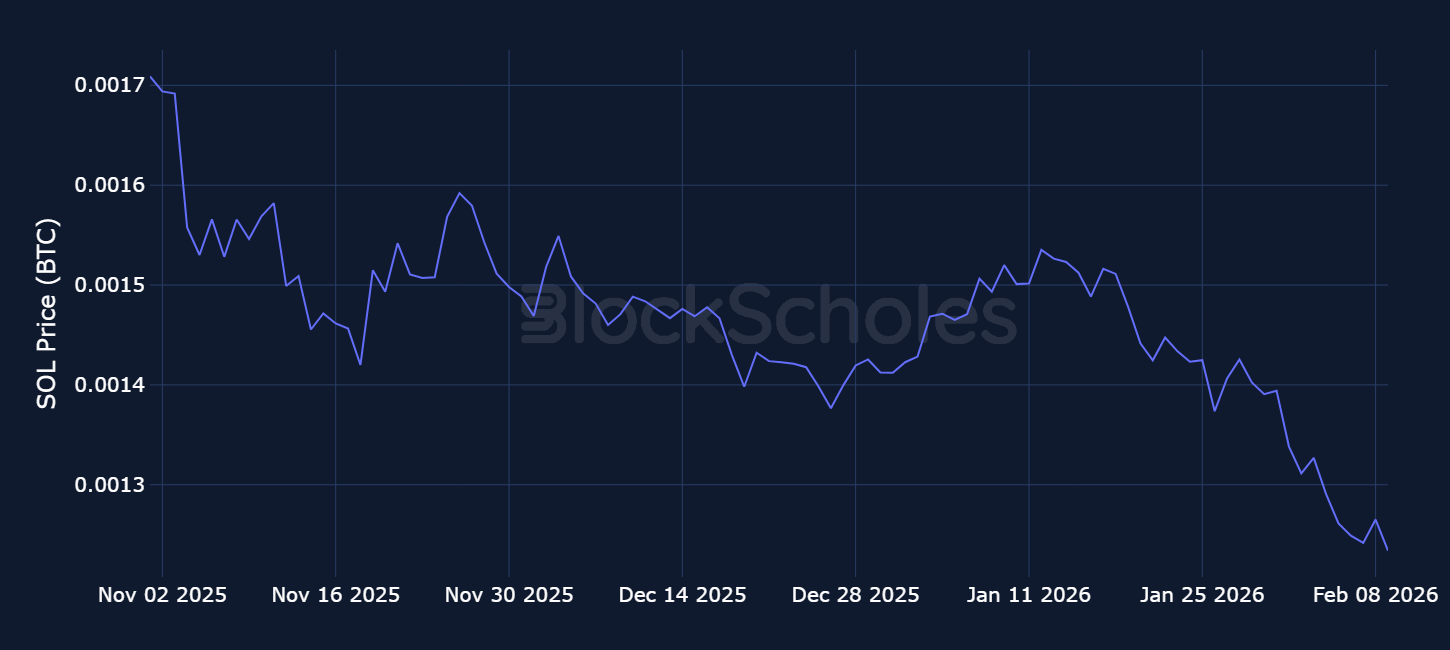
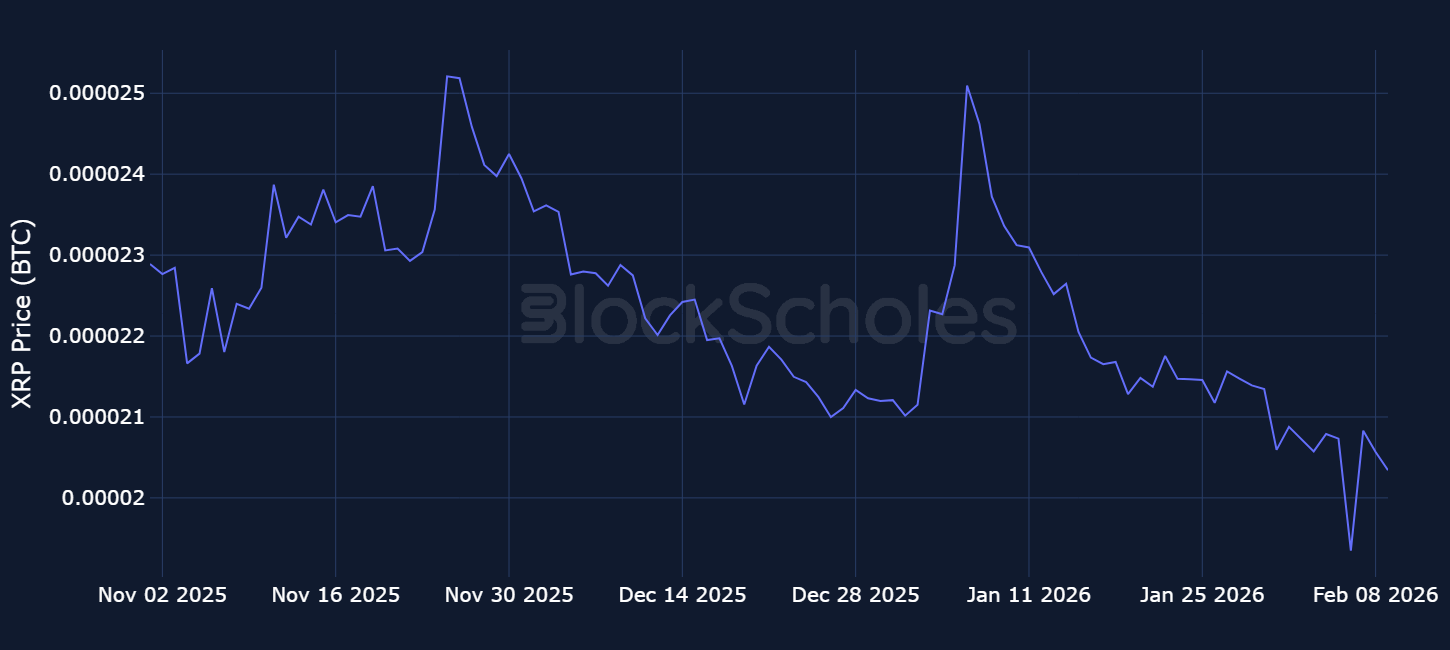
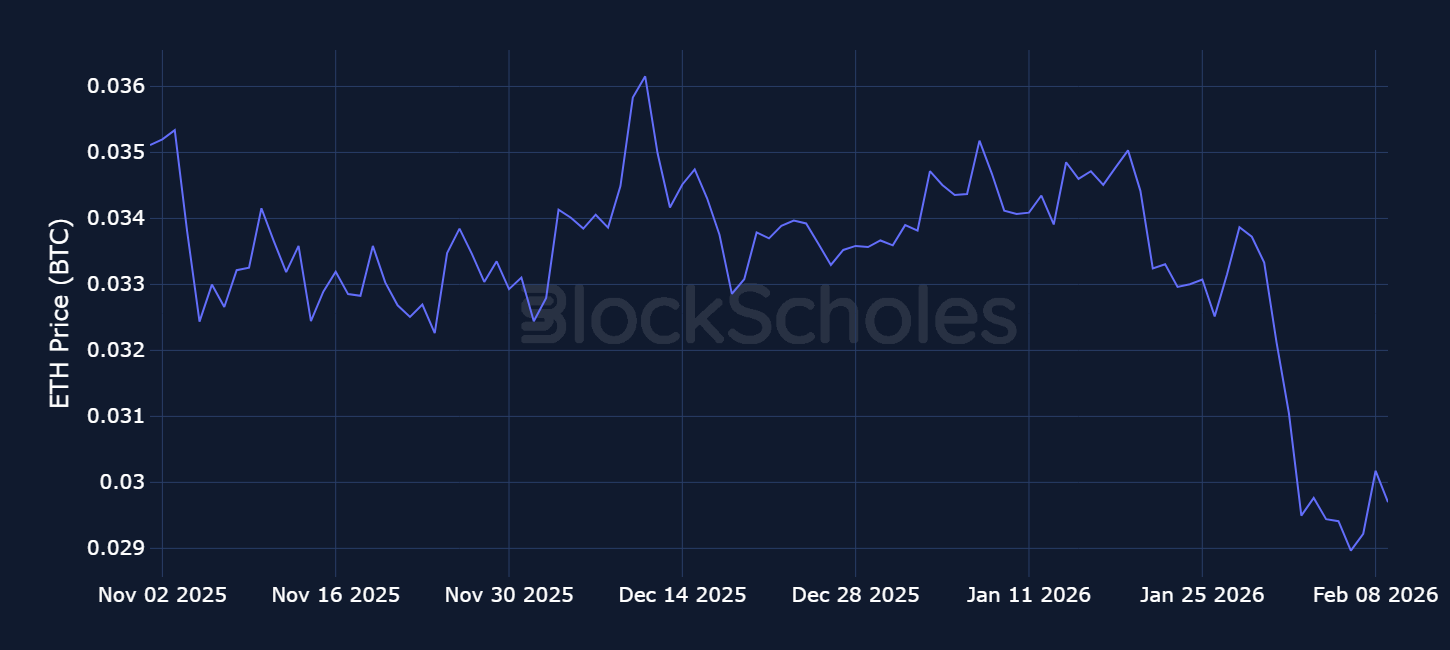
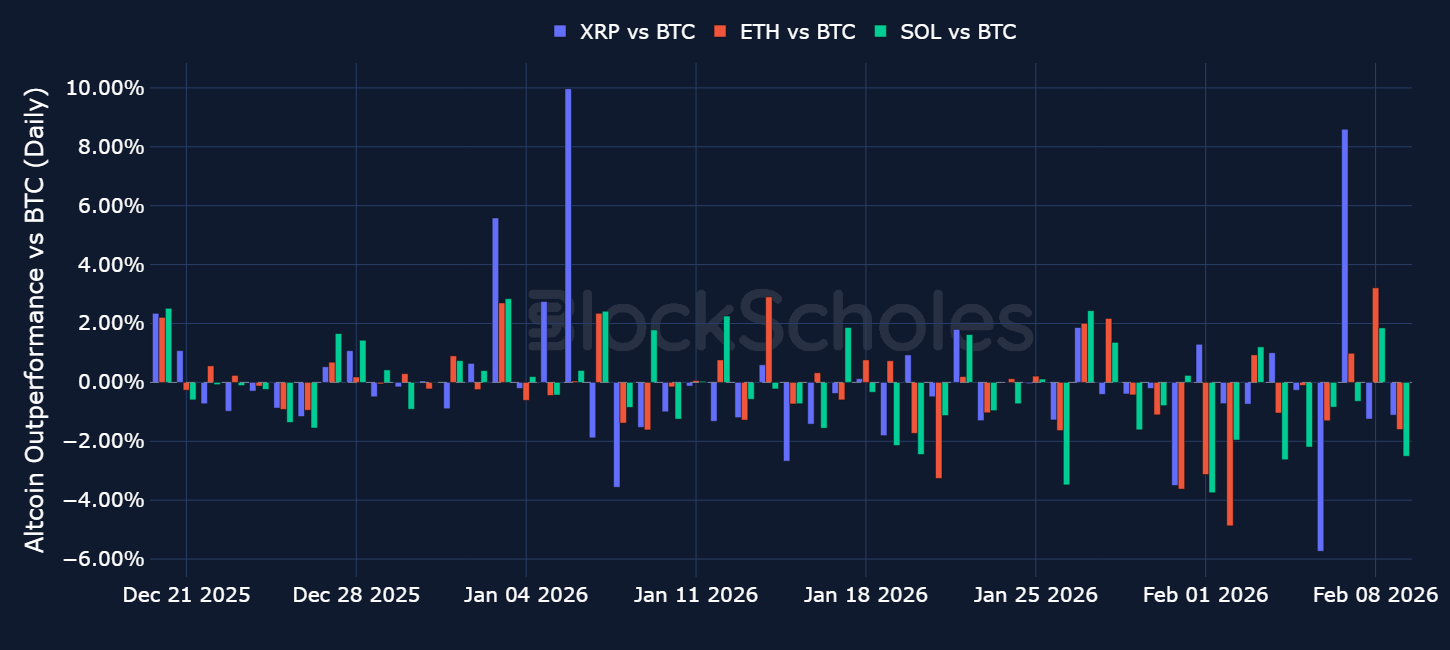
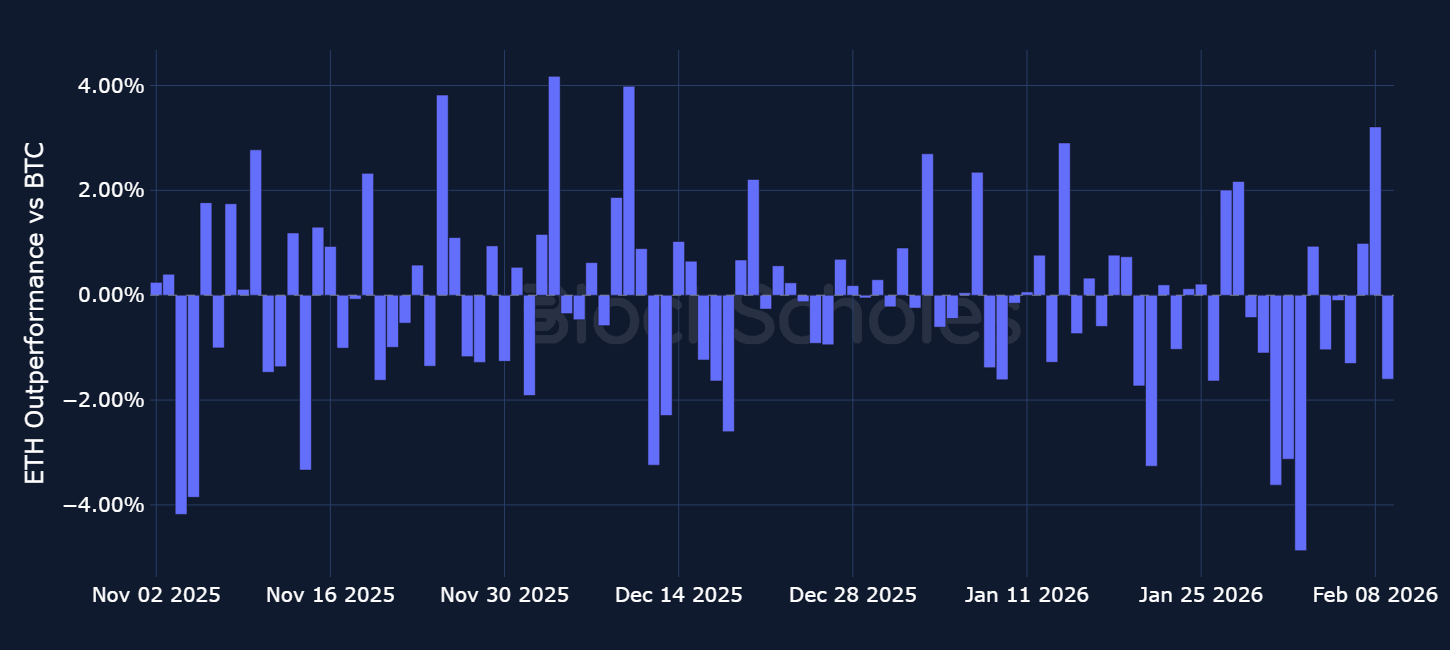
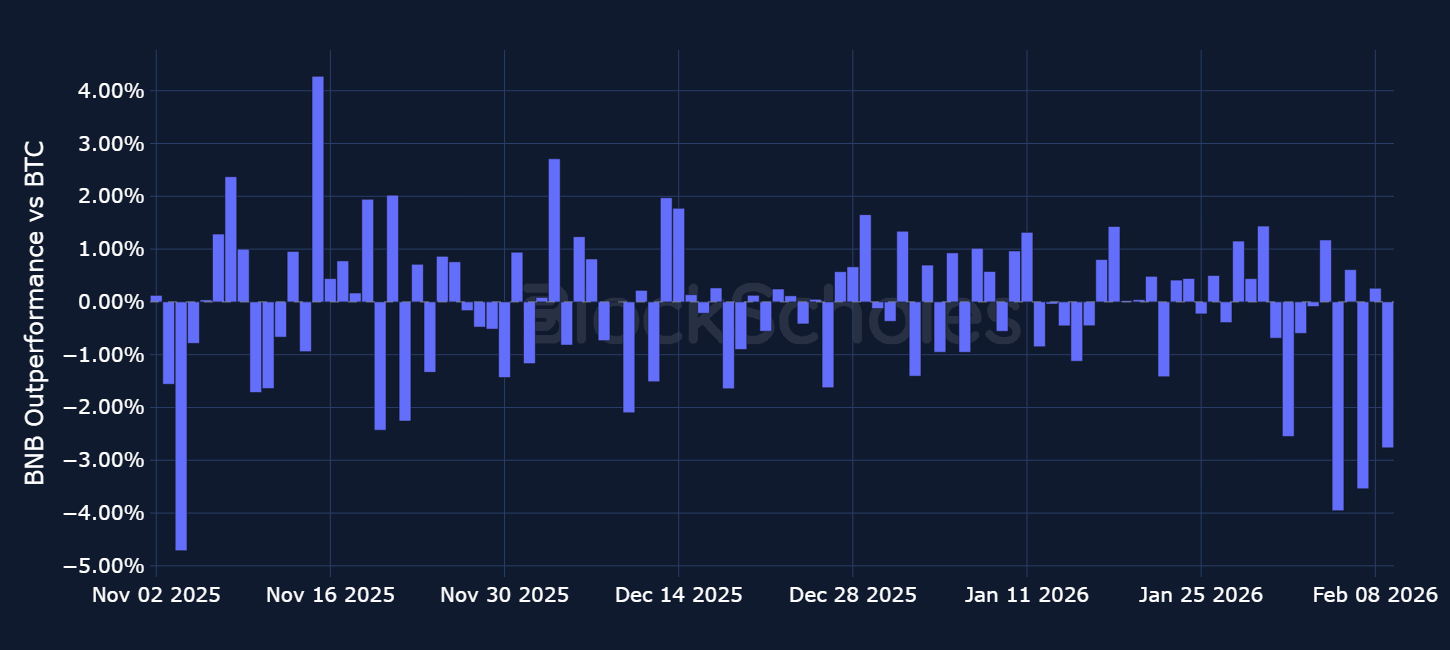
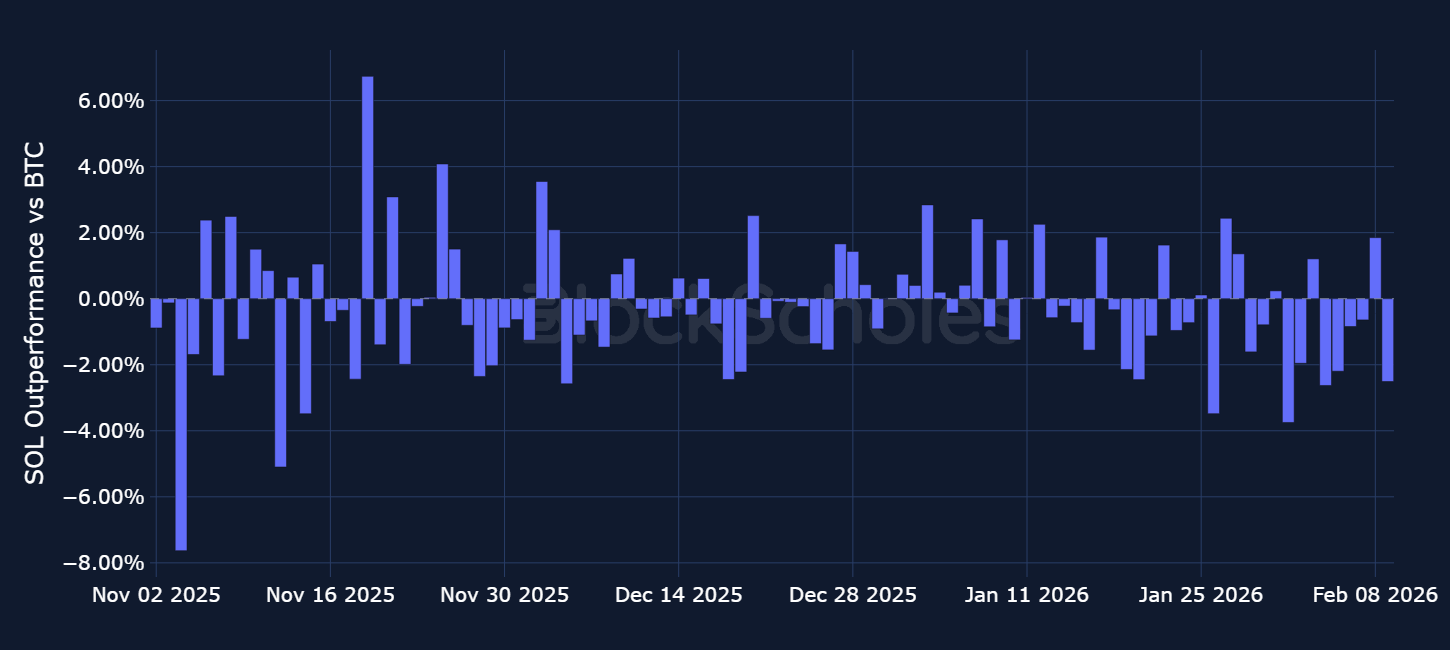
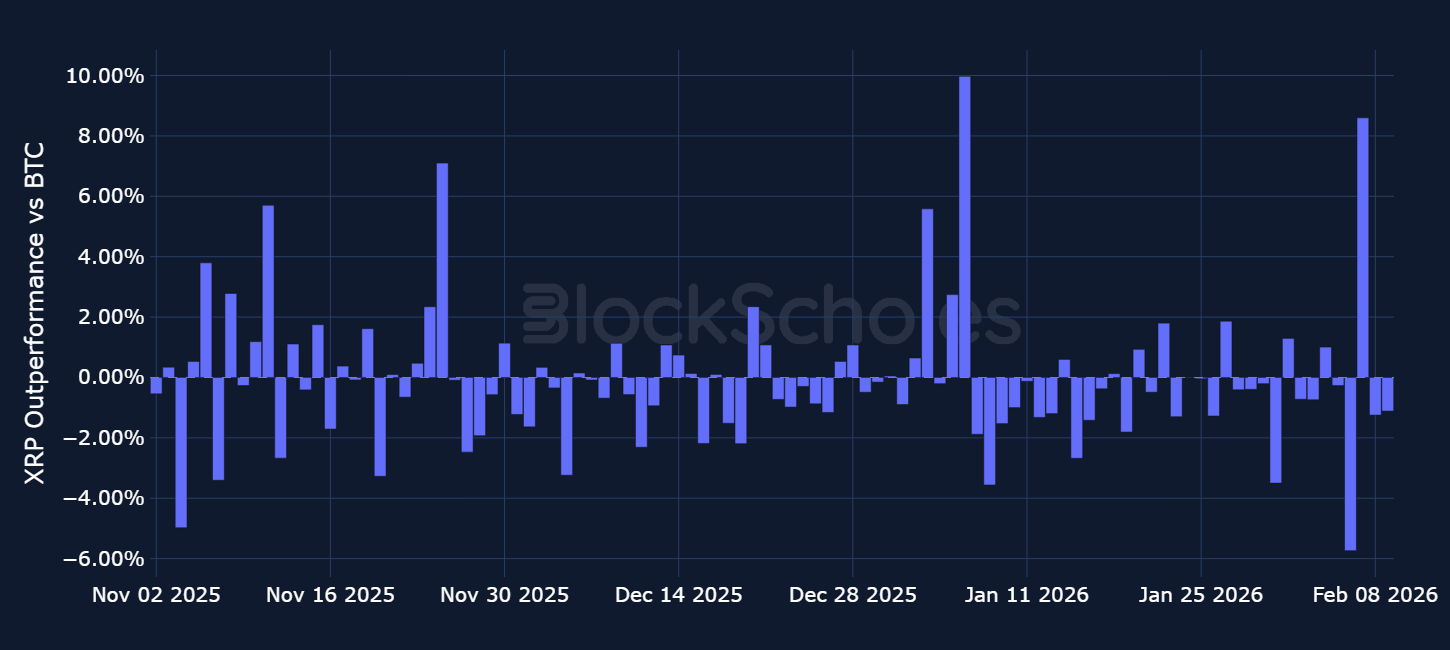
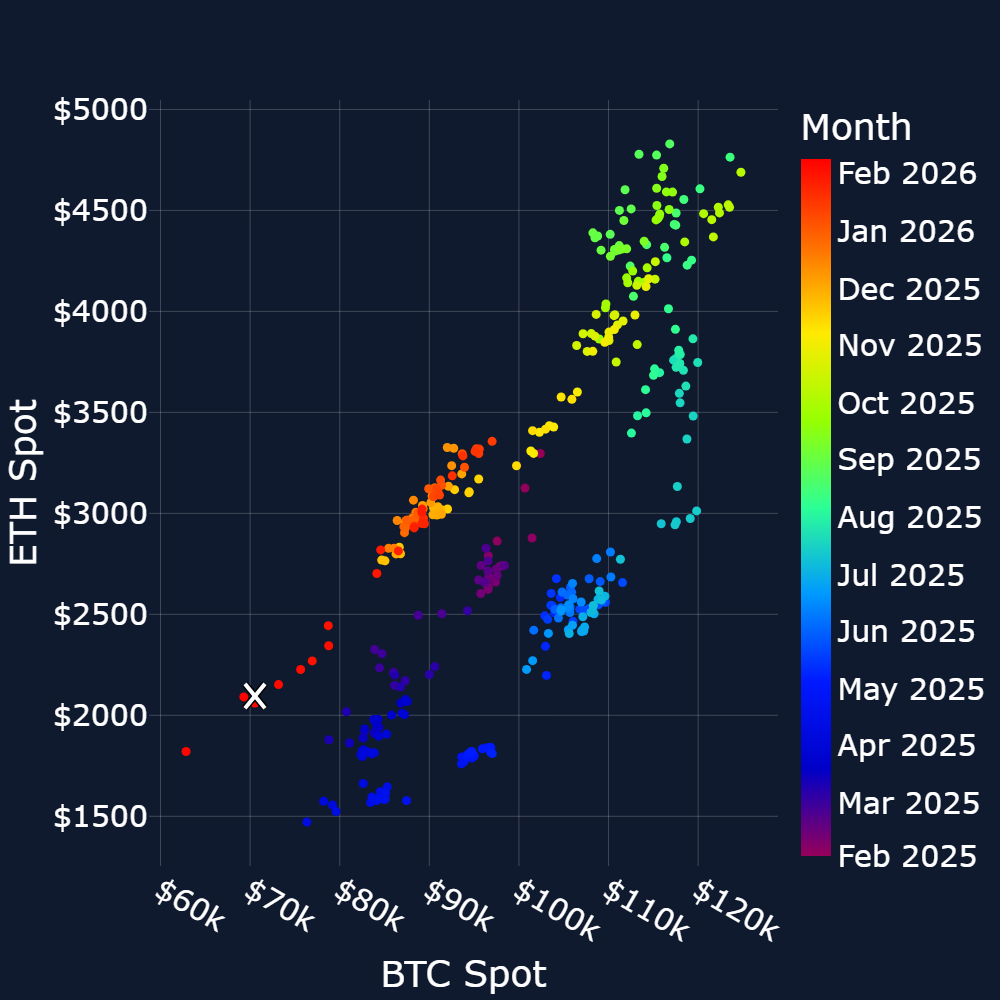
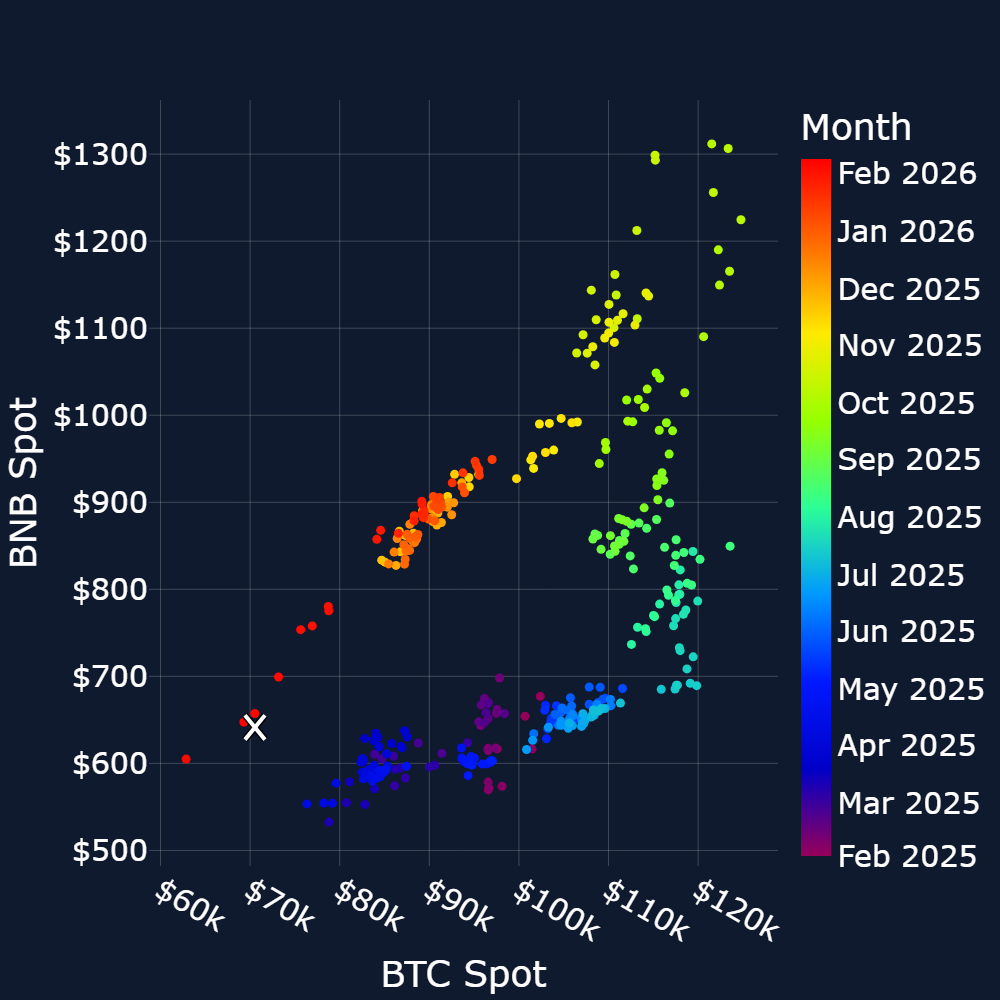
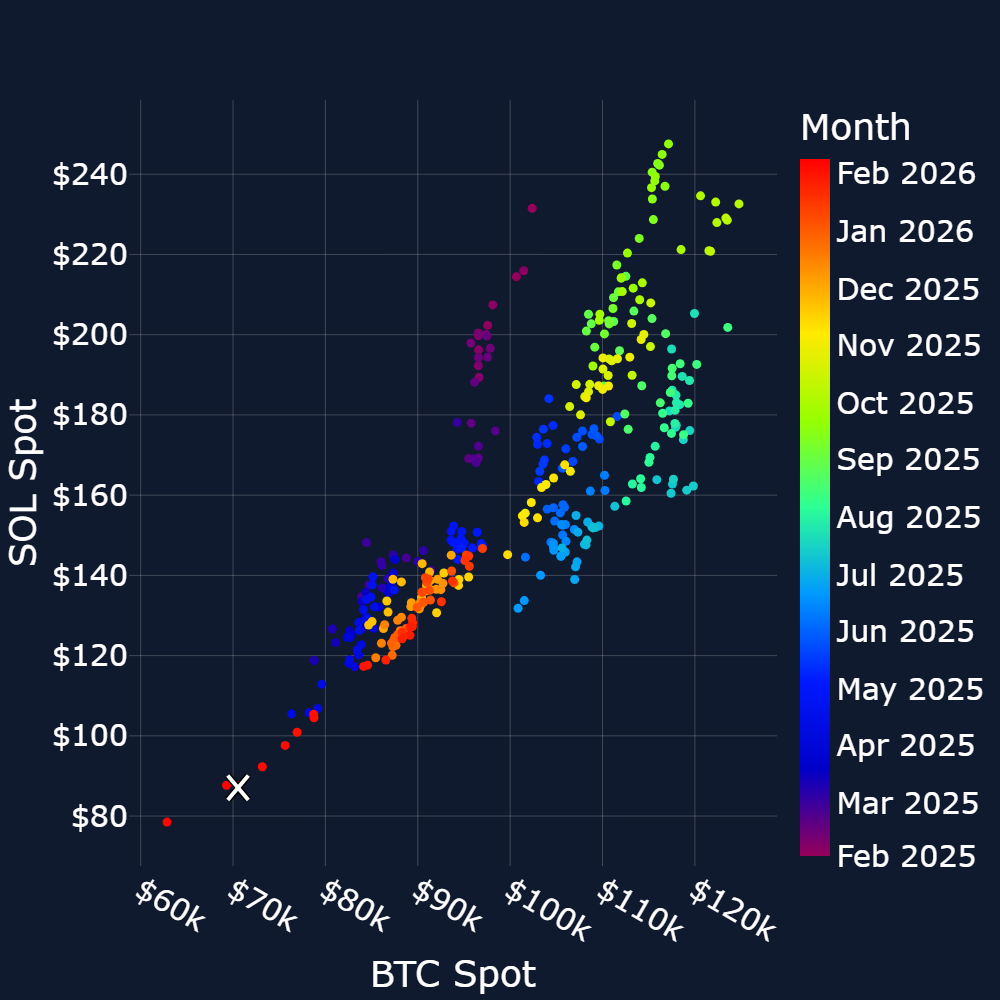
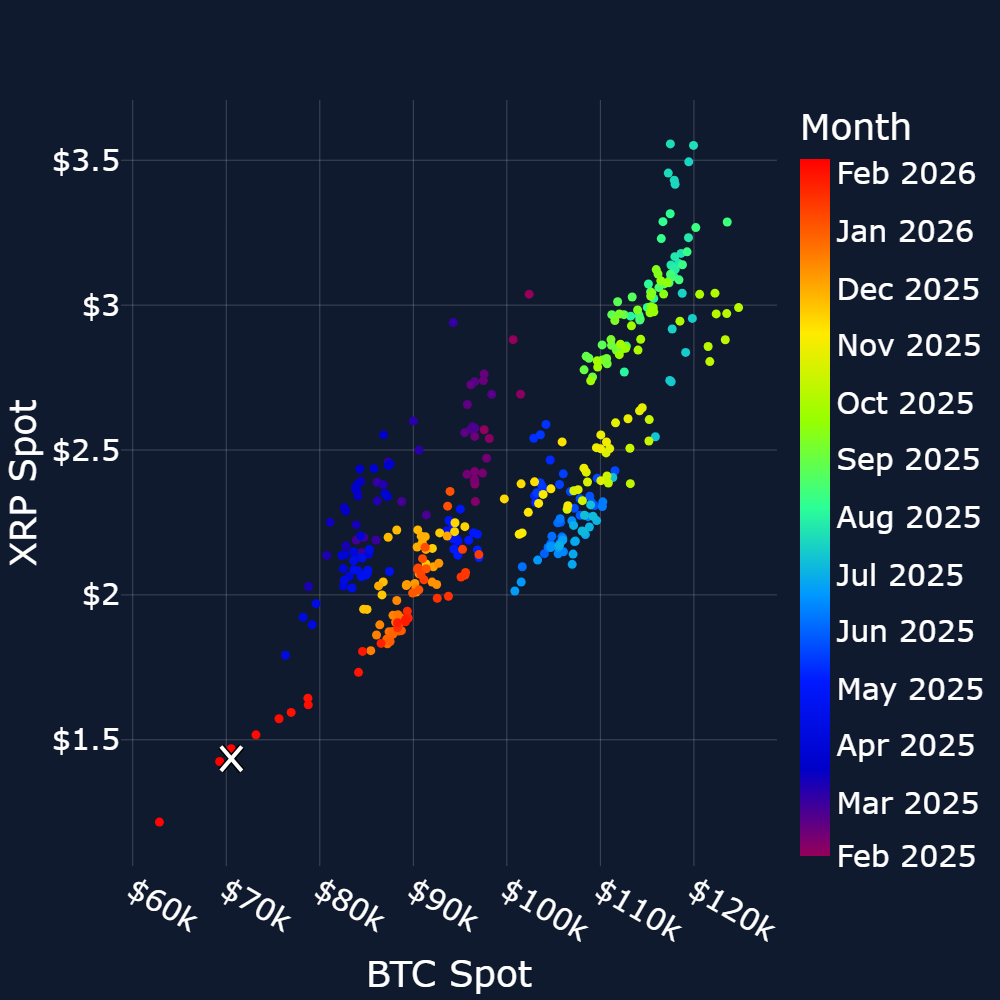
Altcoins Outperformance – Altcoin spot prices dropped alongside BTC, reaching around 50% of their previous all-time-highs. SOL, ETH and XRP have underperformed BTC’s poor returns. XRP stands out, exhibiting higher movements with a larger spike in underperformance on Feb 06, recovered by an 8.5% outperformance on Feb 07.
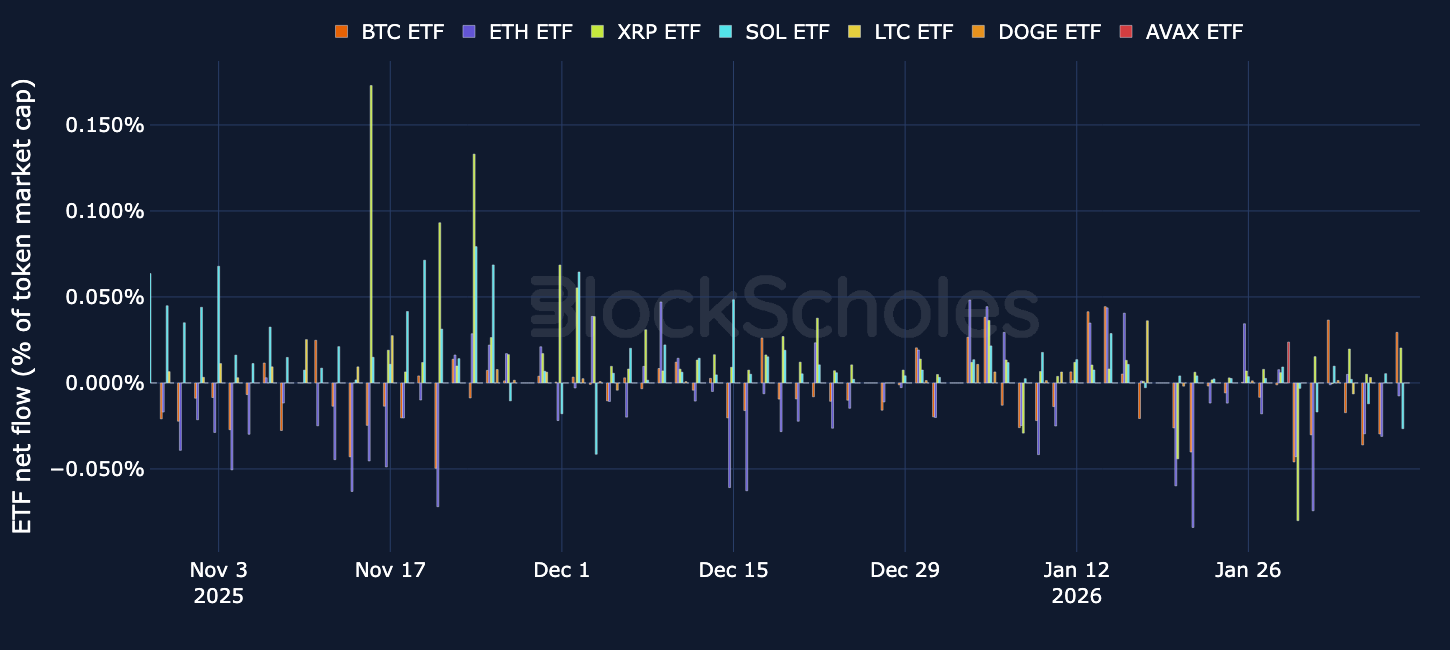
ETF Flows – The sharp sell-off on 4–5 February did not impact ETF flows as we’d expect given the size of the move. BTC and ETH ETF flows (scaled relative to their market caps) moved lower at the same time, with SOL ETF flows also decreasing.
Most of the remaining Altcoins ETFs have not experienced the same scenario and have not had any outflows throughout those days.
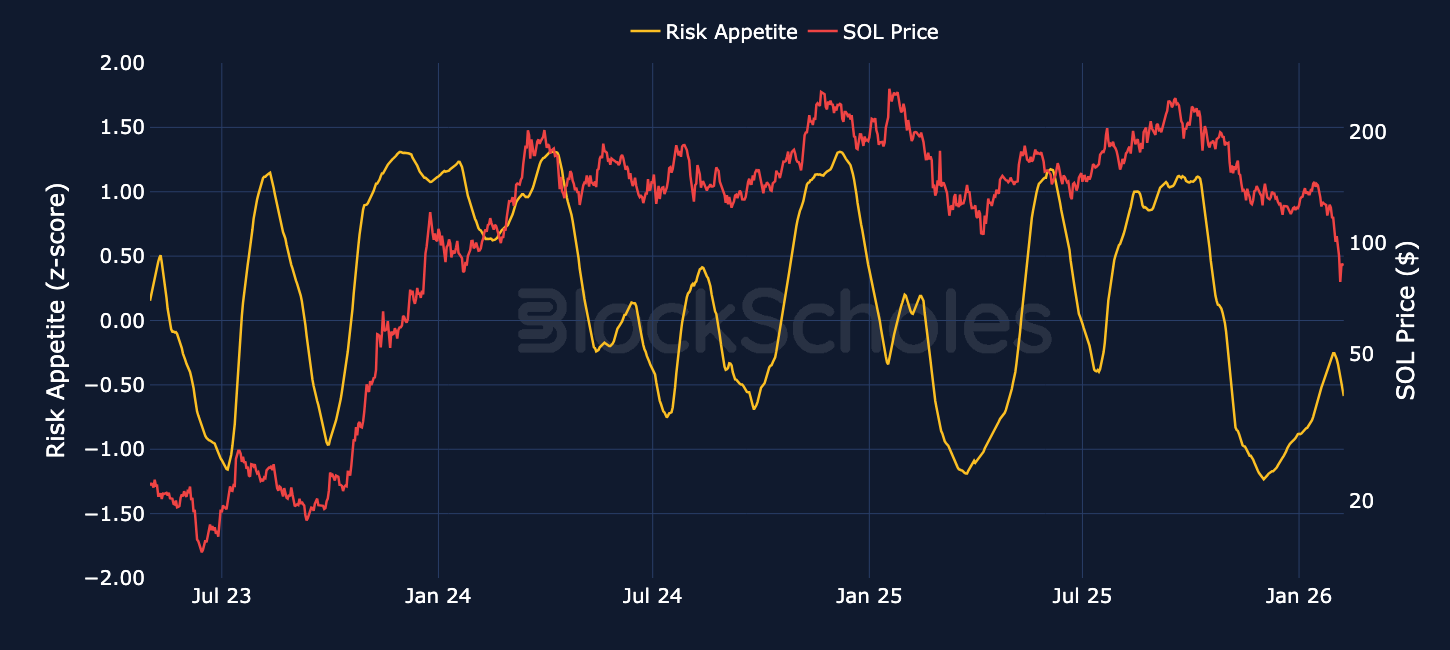
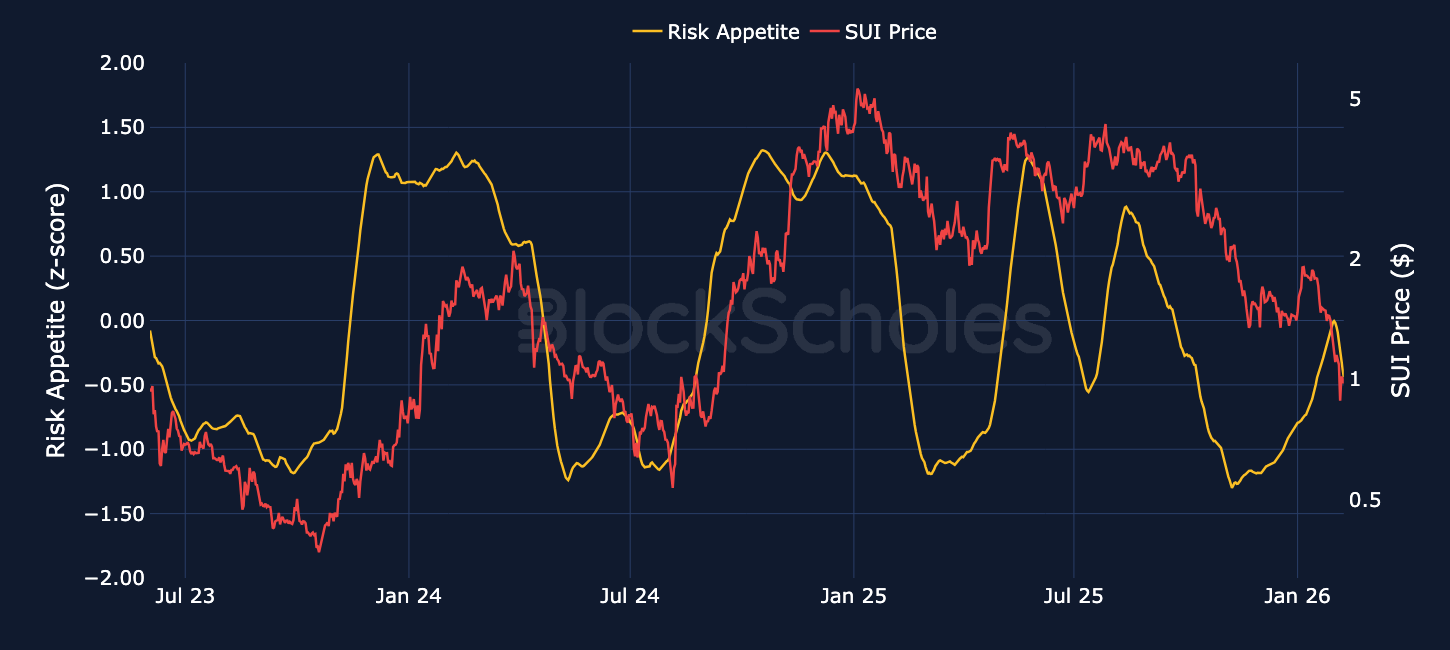
Block Scholes’ Risk Appetite Index measures the level of euphoria (above 1) or panic (below -1) in the spot market. Momentum in this index shows a strong relationship to spot returns.